Article Text

Abstract
Introduction Multimorbidity is common among patients with diabetes and can lead to catastrophic health expenditure (CHE) for their families. This study aims to investigate the prevalence of multimorbidity and CHE among people with diabetes in China, and the association between multimorbidity and CHE and whether this is influenced by socioeconomic status and health insurance type.
Methods A national survey was conducted in China in 2013 that included 8471 people aged ≥18 years who were living with diabetes. The concentration curve and concentration index were used to measure socioeconomic-related inequalities. Factors influencing CHE and the impact of multimorbidity on CHE according to socioeconomic status and health insurance type were examined by logistic regression.
Results There were 5524 (65.2%) diabetes patients with multimorbidity. The prevalence of CHE was 56.6%, with a concentration index of −0.030 (95% CI −0.035 to –0.026). For each additional chronic disease, the probability of CHE increased by 39% (OR=1.39, 95% CI 1.31 to 1.47). Factors that were positively associated (p<0.05) with CHE included older age; male sex; lower educational level; being retired, unemployed or jobless; being a non-smoker and non-drinker; having had no physical examination; lower socioeconomic status; being in an impoverished family; and residing in the central or western regions. Among participants with Urban Employee Basic Medical Insurance, Urban Resident Basic Medical Insurance, and New Rural Cooperative Medical Scheme, the probability of CHE increased by 32% (OR=1.32, 95% CI 1.23 to 1.43), 43% (OR=1.43, 95% CI 1.24 to 1.65) and 47% (OR=1.47, 95% CI 1.33 to 1.63), respectively, with each additional chronic disease. The association between multimorbidity and CHE was observed across all health insurance types irrespective of socioeconomic status.
Conclusions Multimorbidity affects about two-thirds of Chinese patients with diabetes. Current health insurance schemes offer limited protection against CHE to patients’ families.
- health economics
- health services research
- cross-sectional survey
Data availability statement
Data are available upon reasonable request. Data are available on request. The authors will make data available to scientists planning specified and agreed further analyses; for access, contact the corresponding author.
This is an open access article distributed in accordance with the Creative Commons Attribution Non Commercial (CC BY-NC 4.0) license, which permits others to distribute, remix, adapt, build upon this work non-commercially, and license their derivative works on different terms, provided the original work is properly cited, appropriate credit is given, any changes made indicated, and the use is non-commercial. See: http://creativecommons.org/licenses/by-nc/4.0/.
Statistics from Altmetric.com
Key questions
What is already known?
Data on the economic burden of multimorbidity in low-income and middle-income countries are lacking.
The Chinese government aimed to expand social health insurance coverage and provide financial protection to its citizens.
What are the new findings?
This is the first study to systematically evaluate the effect of multimorbidity on catastrophic health expenditure (CHE) and the impact of health insurance schemes for people with diabetes in China.
Multimorbidity was positively associated with a 39% increase in probability of CHE for each additional chronic disease in patients with diabetes.
The positive relationship between multimorbidity and CHE was observed regardless of insurance type and even among patients with the highest socioeconomic level.
What do the new findings imply?
Health insurance has played a limited role in protecting patients’ families from CHE in China.
Reforms in benefits packages are expected to improve financial risk protection.
Introduction
Diabetes is one of the most prevalent and fastest-growing chronic diseases in the world1 and is associated with reduced life expectancy.2 3 In 2014, 422 million people worldwide were diagnosed with diabetes4 and in 2019, the number of adults with diabetes was estimated to be 463 million.5 With the largest and a rapidly ageing elderly population, the prevalence and burden of diabetes are also increasing in China. The Global Burden of Disease, Injuries, and Risk Factors Study estimated that in 2019, approximately 92 million people were living with diabetes in China, which resulted in about 1.55 million deaths.6
Multimorbidity (defined as the coexistence of ≥2 chronic conditions7) is common in patients with diabetes,8–11 who are likely to have other chronic conditions such as obesity; cardiovascular, musculoskeletal, mental, renal and thyroid gland diseases; and chronic obstructive pulmonary disease (COPD).12–15 A large primary care cohort study in the UK found that hypertension was the most prevalent disease among diabetes patients, followed by depression12; and a UK Biobank study found that >90% of patients with diabetes had multimorbidity, with 23% having ≥4 chronic conditions.16 Multimorbidity in patients with diabetes is an enormous burden on the healthcare system.
People with multimorbidity in low-income and middle-income countries may experience financial hardship due to high out-of-pocket (OOP) expenditure on medical services.17–19 A report by the WHO showed that OOP expenditure accounted for over one-third of the total health expenditure in China in 2018.20 Patients with diabetes may have higher OOP expenditure compared with those with other chronic diseases due to the high cost of medications.15 18
The aim of universal health coverage proposed by the United Nations in its Sustainable Development Goals is a health system that allows people to use the services without financial sacrifice.21 However, the incidence of catastrophic health expenditure (CHE) is increasing.22 It was reported that people with multimorbidity who have health insurance with a generous benefits package are still affected by CHE irrespective of their socioeconomic status.23 Moreover, there is socioeconomic inequality in the distribution of CHE, whereby individuals with lower socioeconomic status are more likely to experience CHE.24
While some studies have attempted to address the impact of multimorbidity on CHE, many of them were in non-representative populations25 and less focused on low-income and middle-income countries.23 Additionally, although multimorbidity is common among patients with diabetes, its effect on CHE according to socioeconomic status and health insurance scheme remains unclear. Few studies have systematically examined the impact of multimorbidity on CHE in people with diabetes in China. In this study, we aim to bridge the knowledge gap by using data from a nationally representative survey to examine the prevalence of multimorbidity and CHE among diabetes patients in China as well as the relationship between multimorbidity and CHE and the effects of socioeconomic status and health insurance scheme on this association.
Methods
Study design and data sources
Data used in our study were from a 2013 household survey conducted in China that collected basic household information and healthcare expenditure information. The survey included 31 provinces that were selected using a multistage stratified cluster random sampling method. Five counties or districts were selected in each province; five townships or communities were sampled in each county or district; and two villages or neighbourhoods were randomly selected from each town or community. Trained investigators conducted the household survey through face-to-face interviews using a standardised questionnaire. Individuals aged ≥18 years with a diagnosis of diabetes were included, and participants with missing health or household expenditure information or height or weight data were excluded. In total, 8471 participants were eligible for inclusion in the analysis.
The survey collected information on each household’s demographic and socioeconomic characteristics including household expenditure, urban/rural classification, number of family members, sex, age, education level, employment status of household members and household goods. Household monthly expenditure on food, clothing, traffic, communication, housing, water, electricity, fuel, education, travel, entertainment and medical care as well as other expenditures were recorded. Additionally, information on unexpected household expenditures in the previous year was reported by the participants.
Multimorbidity
All participants were asked if they had clinically confirmed chronic diseases within the 6 months prior to the survey. The type of chronic disease was recorded. We defined multimorbidity as the presence of ≥2 chronic diseases including diabetes, obesity (defined as a body mass index ≥30 kg/m2),26 hypertension, and other chronic diseases such as neoplasms, anaemia, depressive disorders, epilepsy, cataract, COPD, peptic ulcer disease, nephritis, dermatitis, rheumatoid arthritis, and infectious diseases.
Catastrophic health expenditure
In the base case analysis, CHE was defined as OOP spending on health equal to or exceeding 20% of the household’s capacity to pay, which was gauged by the non-food household consumption expenditure.27 CHE is a binary variable according to the following equation27:

where E denotes that whether or not the household of the participants has CHE, T is OOP spending on health, x is the total household consumption expenditure, f(x) is food expenditure and Z is the threshold level of 20%.
Socioeconomic status
Annual adult-equivalent household expenditure was used to categorise socioeconomic groups.27 As economic development level varied across sampling regions, the quartile of socioeconomic groups was defined within each county or district and then combined across all sampled counties and districts.
Health insurance
At the time the survey was conducted in 2013, there were three main public health insurance schemes available to the study participants. Urban Employee Basic Medical Insurance (UEBMI) was launched in 1998 for urban workers and retirees, and is financed by a fixed proportion of the employee’s salary. Urban Resident Basic Medical Insurance (URBMI) covers the urban population that is ineligible for the UEBMI scheme including children, students, the elderly, the disabled and other unemployed urban residents, and is financed by government subsidies and household-level contributions. New Rural Cooperative Medical Scheme (NRCMS), which covers the rural population, was launched in 2003 and is funded by government subsidies and premiums.
Variables
We included the following individual-level and household-level variables to investigate the effect of socioeconomic status and health insurance scheme on the relationship between multimorbidity and CHE: number of chronic diseases; age; sex; education level (primary school and below, secondary school, and junior college and above); employment status (employed, retired, student, unemployed and jobless); smoking status (daily smoker, occasional smoker and non-smoker); frequency of alcohol consumption (at least three times a week, one or two times a week, less than once a week and no drinking); physical examination; health insurance (no public health insurance, UEBMI, URBMI, NRCMS and other (including Government Employee Health Insurance and Government Labor Health Insurance)); socioeconomic status quartiles, geographic region (east, middle and west); number of people in the household; and impoverishment status.
Statistical analysis
Descriptive statistics were used to show the distribution of multimorbidity across various socioeconomic and demographic groups and health-related behaviours. Continuous variables were described using mean and SD. Categorical variables were described using percentages. Differences between groups were compared with the χ2 test or by analysis of variance.
The concentration curve and concentration index27 were used to measure socioeconomic-related inequalities in the incidence of CHE. The concentration curve showed the distribution of inequality in the incidence of CHE by depicting the change in cumulative percentage of CHE on the y-axis with increase in cumulative percentage of households ranked by living standard (ie, annual adult-equivalent household expenditure) on the x-axis. If the curve lies above the line of equality (45° line), the health outcome variable (CHE) is more prevalent among the poor and conversely.27 The concentration index was produced using the CONCINDC28 to account for the correlation structure of the fractional ranks and ties in the ranking welfare variables.29 30 In addition, the CONCINDC was used in our analysis as it provides the most standard version of the concentration index for both individual and grouped data.31 The concentration index is equal to twice the area between the concentration curve and line of equality, and ranges from −1 to 1; a negative concentration index indicates that CHE is concentrated among the poor and conversely.27
The following formula was used to calculate the concentration index27:

where C is the covariance between the health outcome variable (h) and fractional rank in living standard (r) and µ is the mean of h.
Logistic regression was used to assess the variation in CHE incidence among the included social and demographic variables. Additionally, the impact of multimorbidity on CHE in study participants with different socioeconomic status and health insurance type was also explored. OR with 95% CI of CHE incidence were reported after adjusting for age, sex, education level, employment status, smoking status, frequency of alcohol consumption, physical examination status, geographic region, number of people in the household and impoverishment status.
All statistical analyses were conducted using the SPSS V.25.0 (SPSS) and Stata V.13.0 (Stata Corp). A two-tailed p value <0.05 was set as the threshold for statistical significance.
Sensitivity analyses
Sensitivity analyses were conducted to examine the association between multimorbidity and risk of CHE using the WHO definition of CHE, which is calculated as OOP spending on health equal to or exceeding 40% of non-food household consumption expenditure.32
Patient and public involvement
No patients or members of the public were directly involved in this study. There are no plans to involve patients or the public in the dissemination of results.
Results
Characteristics of the study population
A total of 8471 patients with diabetes were enrolled in the study. The participants’ socioeconomic and demographic characteristics, health-related behaviours, and the relationship between multimorbidity and these characteristics are shown in table 1. There were 2947 participants (34.8%) with diabetes only; 3734 (44.1%) reported having diabetes and another chronic disease; 1332 (15.7%) had 2 other chronic diseases; and 458 (5.4%) had diabetes and ≥3 chronic diseases. Age, sex, education level, employment status, smoking status, frequency of alcohol consumption, geographic region and number of people in the household varied significantly according to the number of chronic diseases (p<0.05).
Association between number of chronic diseases and socioeconomic, demographic, and health-related behavioural characteristics in patients with diabetes
Prevalence of CHE and associated factors
CHE was reported by 56.6% of study participants; the concentration index of CHE incidence was −0.030 (95% CI −0.035 to –0.026). The concentration curve is shown in figure 1. The poorest 20% of households accounted for 24% of total households that experienced CHE. The prevalence of CHE in patients with diabetes only was 48.2%; the prevalence increased with the number of other chronic diseases (1 chronic disease, 57.0%; 2 chronic diseases, 70.6%; ≥3 chronic diseases, 74.5%).

Concentration curve for CHE. The figure shows actual cumulative concentration curves for the change in cumulative percentage of CHE with increase in cumulative percentage of households ranked by living standard (ie, annual adult-equivalent household expenditure). CHE, catastrophic health expenditure.
With each additional chronic disease, the probability of experiencing CHE increased by 39% (OR=1.39, 95% CI 1.31 to 1.47; table 2). Age, sex, education level, employment status, smoking status, alcohol consumption, physical examination, socioeconomic status quartiles, geographic region, number of people in a household and impoverishment status were all significantly associated with the risk of CHE (p<0.05).
ORs of catastrophic health expenditure by characteristic of diabetes patients
At the household level, the likelihood of CHE was higher for families living in central (17%, OR=1.17, 95% CI 1.05 to 1.30) and western (28% OR=1.28, 95% CI 1.14 to 1.44) China compared with those living in the eastern part of the country. With each additional person in the household, the probability of CHE decreased by 16% (OR=0.84, 95% CI 0.82 to 0.87). The probability of CHE was lower in non-impoverished families (OR=0.61, 95% CI 0.47 to 0.80) than in impoverished families. At the individual level, with increasing age, the probability of CHE increased by 9% (OR=1.09, 95% CI 1.06 to 1.12). The likelihood of CHE was higher among males than among females (OR=0.80, 95% CI 0.72 to 0.90). Participants with primary school education and below had a higher probability of CHE than those with secondary school education (OR=0.86, 95% CI 0.77 to 0.96) and junior college education and above (OR=0.57, 95% CI 0.47 to 0.70). Compared with patients who were employed, those who were retired (OR=1.40, 95% CI 1.19 to 1.63), unemployed (OR=1.42, 95% CI 1.02 to 1.99) or jobless (OR=1.24, 95% CI 1.07 to 1.44) had greater odds of CHE. The probability of CHE was higher among patients who did not smoke daily (OR=1.36, 95% CI 1.01, 1.83) or at all (OR=1.38, 95% CI 1.21 to 1.58) than among daily smokers.
The odds of CHE were also higher among patients who did not drink alcohol (OR=1.51, 95% CI 1.26 to 1.81) than among those who drank alcohol at least three times a week. Patients who had not had a physical examination were more likely to experience CHE (OR=1.10, 95% CI 1.00 to 1.21) than those who underwent physical examination. The probability of CHE was significantly lower among patients with the highest socioeconomic level (OR=0.86, 95% CI 0.75 to 0.98) as compared with the lowest level.
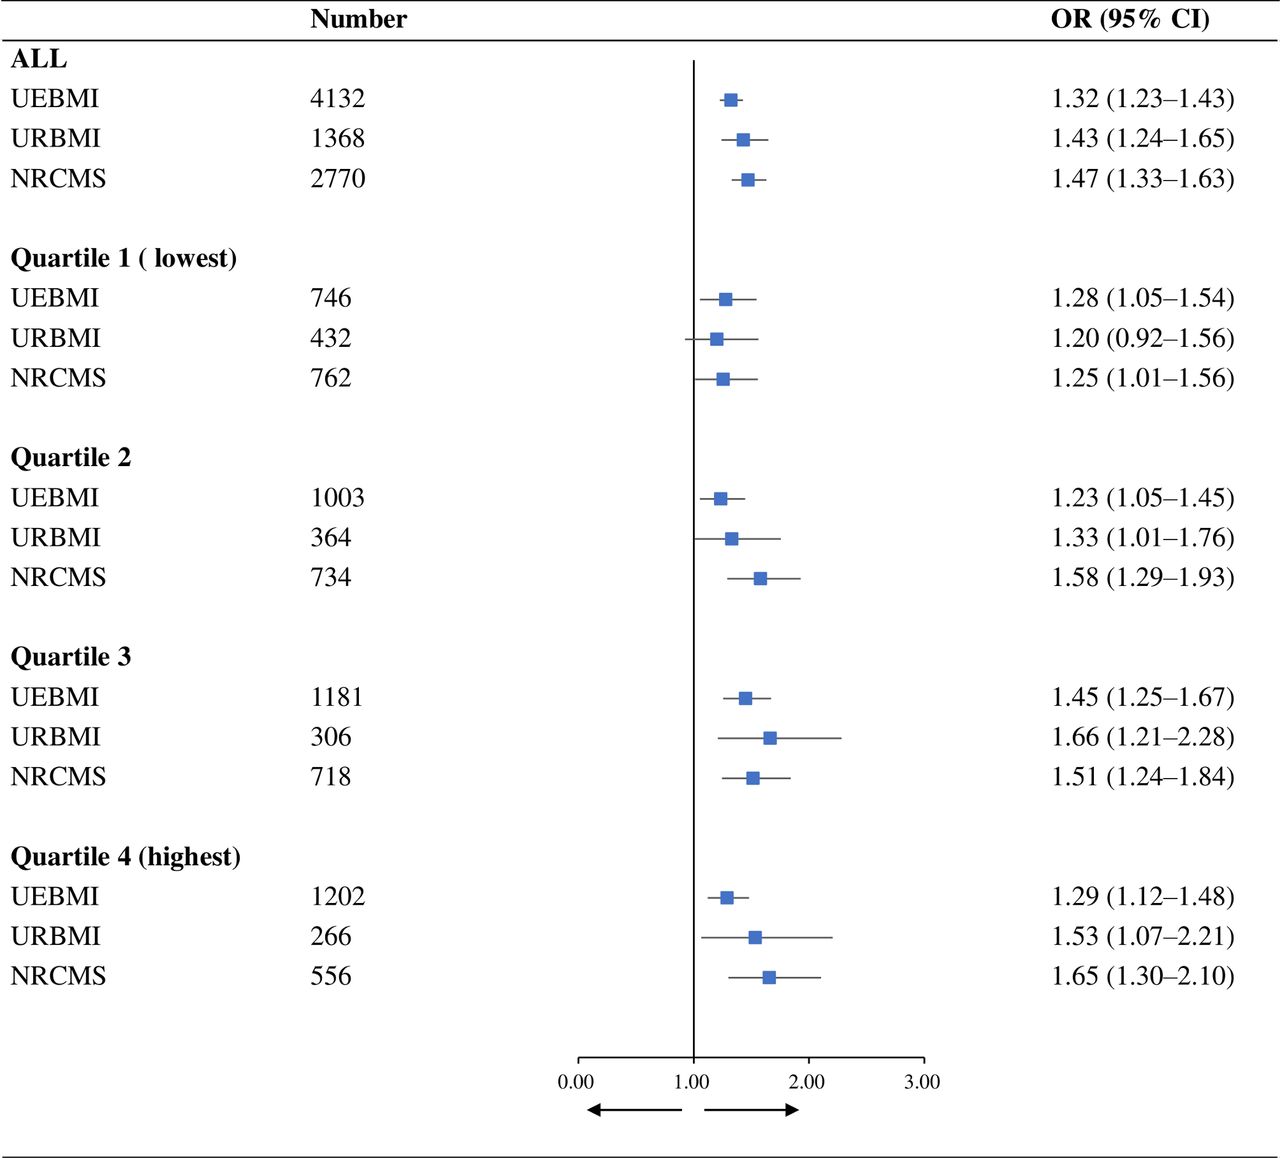
Effect of multimorbidity on CHE according to socioeconomic status and health insurance type
The effect of multimorbidity on CHE according to socioeconomic status and health insurance scheme is shown in figure 2. At all socioeconomic levels, the risk of CHE with each additional chronic disease increased by 32% (OR=1.32, 95% CI 1.23 to 1.43), 43% (OR=1.43, 95% CI 1.24 to 1.65) and 47% (OR=1.47, 95% CI 1.33 to 1.63) for patients with UEBMI, URBMI and NRCMS, respectively. The effect of multimorbidity on CHE was observed regardless of insurance type even among participants at the highest socioeconomic level.

Relationship between multimorbidity and CHE by socioeconomic status and health insurance scheme. The figure shows the effect of the number of chronic diseases on CHE in different socioeconomic statuses and different health insurance schemes. CHE, catastrophic health expenditure.
The results of the sensitivity analyses were consistent with those of the base case analyses (online supplemental table S1). The relationship between CHE risk and number of chronic diseases persisted at a CHE threshold of 40%, with a larger effect size (OR=1.44, 95% CI 1.37 to 1.53) than in the base case analysis.
Supplemental material
Discussion
To our knowledge, this is the first study to use nationally representative data to investigate the prevalence of multimorbidity and CHE and the relationship between these variables in patients with diabetes in China. We also examined whether CHE differed among patients according to socioeconomic level and health insurance scheme. We found that multimorbidity was common among Chinese patients with diabetes, with over half of families reporting CHE. The probability of CHE was positively associated with older age; male sex; a lower education level; being retired, unemployed or jobless; being a non-smoker and non-drinker; having had no physical examination; having a lower socioeconomic status; being in an impoverished family; and residing in the central or western region of China. Additionally, the risk of CHE increased with the number of multimorbidities irrespective of the type of health insurance.
We found that 65.2% of Chinese adult patients diagnosed with diabetes also reported multimorbidity. Previous studies in other populations have reported a higher prevalence of multimorbidity in patients with diabetes.8 9 15 16 33 There are a few possible reasons for this discrepancy. First, in most other studies the population consisted of middle-aged and older participants, who are more likely to have multimorbidity.15 Second, evidence of multimorbidity in patients with diabetes has mainly come from high-income countries, with little data for low-income and middle-income countries. In addition, there is no standardised definition and measure of multimorbidity,34 which could explain the variable prevalence of multimorbidity across different studies.7
In the base case analysis, we found that the prevalence of CHE was 56.6% at the 20% threshold. Compared with other studies that used the same calculation method and threshold, the prevalence of CHE was higher in our study conducted in China than in South Africa35 and Iran.36 This may be because the previous studies only included OOP spending related to diabetes. In contrast, we included all OOP spending on healthcare. Additionally, the concentration index in these two studies was −0.06 and −0.09, respectively.35 36 We have found a concentration index of −0.030, which indicated that CHE was more prevalent in the poor in our study population.
Previous studies have shown that smoking was one of the primary risk factors for CHE.37 38 However, we found that the likelihood of CHE was higher among those who did not smoke or drink alcohol. Our findings might be explained that patients with diabetes who smoked and drank were not frequent healthcare resource users and therefore were less likely to suffer from CHE. Moreover, as our data were cross-sectional, our results were limited to show the relationship between smoking and drinking and the incidence of CHE in a longitudinal manner.
In our study, multimorbidity in patients with diabetes was associated with an increased likelihood of CHE, which is consistent with an earlier report.39 This may be explained by the fact that individuals with multimorbidity tend to use more healthcare services.21 Moreover, individuals with more multimorbidities and specific chronic disease combinations were shown to have higher OOP expenditure on medicines.40 We determined that the risk of CHE increased by 39% with each additional chronic disease in patients with diabetes in China.
Social health insurance schemes are designed to protect individuals and families from financial hardship due to high health expenditure. Our results showed that patients with public health insurance experienced CHE irrespective of the insurance type. Additionally, the effect of multimorbidity on CHE persisted even among patients who were covered by health insurance schemes with a generous benefits package such as UEBMI, indicating that health insurance did not alleviate the financial burden associated with CHE and failed to protect even insured patients. In fact, health insurance reforms over the last decade have mainly focused on the expansion of the coverage rather than improvement of the benefits package.41
We found that patients with diabetes who were covered by UEBMI had a smaller risk of experiencing CHE than those covered by URBMI and the NRCMS as the number of chronic diseases increased. This may be explained by the fact that URBMI and NRCMS are inferior to UEBMI in terms of compensation and cost-sharing.42 43 For the same insurance type, the effect of multimorbidity on CHE did not decline with a higher socioeconomic status; that is, more affluent families were as likely as poor families to experience CHE with an increasing number of chronic diseases. While it is generally thought that high economic status can mitigate the risk of CHE,44 compared with wealthier people who have greater access to medical care, those who are poor may give up seeking medical care when OOP expenditure is too high, making the former more vulnerable to CHE. It was also reported that CHE was associated with demographic variables such as household size and socioeconomic status but was unrelated to health insurance type,23 41 42 indicating that CHE may not depend on social institutions such as medical insurance schemes but on the characteristics of individuals or households. A function of social institutions is to compensate for deficits in households; however, our work has shown that current health insurance schemes have not fulfilled this role.
Our study had several limitations. First, we used self-reported disease diagnosis to determine multimorbidity status, which might underestimate the true multimorbidity prevalence.17 25 For example, studies have shown that diabetes was an under-diagnosed chronic disease in China.45 Second, the health expenditure was also self-reported, which might lead to recall bias, particularly among older people. Third, our study suffered from the cross-sectional design, which limited its ability in drawing a causal relationship. Fourth, we assessed multimorbidity by simply counting the number of chronic diseases without accounting for the disease severity. In future research, unequal weights are encouraged to explore the effect of multimorbidity according to the severity of chronic diseases. Finally, the data were collected in 2013, which may not reflect the current prevalence of multimorbidity among people with diabetes in China.
With the accelerated process of population ageing, multimorbidity among patients with diabetes is expected to become a norm in China. The clinical practice needs to meet this demand and to provide good quality health services. Unfortunately, the current clinical guidelines in China mainly focus on single diseases and rarely take account of multimorbidity. Developing clinical guidelines to manage multimorbidity is urgent in low-income and middle-income countries, including China. In addition, China has made a great achievement in expanding the public health insurance coverage, which increased the access and utilisation of health services. However, the benefit packages in the public health insurance have limited capacity in protecting from the CHE. Hence, the benefits package design should be tailored to the need for multimorbidity. Finally, as expanding benefit package will inevitably increase healthcare expenditure, scrutiny of cost-effective interventions is encouraged to ensure the sustainability of the health system.
Conclusion
The results of this study demonstrate that multimorbidity is prevalent and associated with CHE among Chinese patients with diabetes. Although social health insurance coverage has greatly expanded in China, a reform of benefits packages is needed to improve their capacity for financial risk protection.
Data availability statement
Data are available upon reasonable request. Data are available on request. The authors will make data available to scientists planning specified and agreed further analyses; for access, contact the corresponding author.
Ethics statements
Patient consent for publication
Ethics approval
This study involves human participants and was approved by the Nanjing Medical University Ethics Committee (ID: 555). Participants gave informed consent to participate in the study before taking part.
References
Supplementary materials
Supplementary Data
This web only file has been produced by the BMJ Publishing Group from an electronic file supplied by the author(s) and has not been edited for content.
Footnotes
Handling editor Seye Abimbola
Contributors MC and LS led and designed the study, contributed to the data analysis, reviewed the manuscript and helped write the final draft manuscript. YF led the data collection, analysis, interpretation and wrote the first draft of the manuscript. All authors reviewed the content of the final version of the manuscript. MC is responsible for the overall content as guarantor.
Funding This study is funded by the National Natural Science Foundation of China (grant number: 71874086, 72174093) and the China Medical Board (grant number: 19-346). LS is supported by an NHMRC Early Career Fellowship (grant number: GNT1139826).
Disclaimer The funding bodies were not involved in the design of the study, or data collection, analysis, and interpretation or in writing the manuscript.
Competing interests None declared.
Provenance and peer review Not commissioned; externally peer reviewed.
Supplemental material This content has been supplied by the author(s). It has not been vetted by BMJ Publishing Group Limited (BMJ) and may not have been peer-reviewed. Any opinions or recommendations discussed are solely those of the author(s) and are not endorsed by BMJ. BMJ disclaims all liability and responsibility arising from any reliance placed on the content. Where the content includes any translated material, BMJ does not warrant the accuracy and reliability of the translations (including but not limited to local regulations, clinical guidelines, terminology, drug names and drug dosages), and is not responsible for any error and/or omissions arising from translation and adaptation or otherwise.