Article Text

Abstract
Introduction Maximising efficiency of resources is critical to progressing towards universal health coverage (UHC) and the sustainable development goal (SDG) for health. This study estimates the technical efficiency of national health spending in progressing towards UHC, and the environmental factors associated with efficient UHC service provision.
Methods A two-stage efficiency analysis using Simar and Wilson’s double bootstrap data envelopment analysis investigates how efficiently countries convert health spending into UHC outputs (measured by service coverage and financial risk protection) for 172 countries. We use World Bank and WHO data from 2015. Thereafter, the environmental factors associated with efficient progress towards UHC goals are identified.
Results The mean bias-corrected technical efficiency score across 172 countries is 85.7% (68.9% for low-income and 95.5% for high-income countries). High-achieving middle-income and low-income countries such as El Salvador, Colombia, Rwanda and Malawi demonstrate that peer-relative efficiency can be attained at all incomes. Governance capacity, income and education are significantly associated with efficiency. Sensitivity analysis suggests that results are robust to changes.
Conclusion We provide a 2015 baseline for cross-country UHC technical efficiency scores. If countries wish to improve their UHC outputs within existing budgets, they should identify their current efficiency and try to emulate more efficient peers. Policy-makers should focus on strengthening institutions and implementing known best practices to replicate efficient systems. Using resources more efficiently is likely to positively impact UHC coverage goals and health outcomes, and without addressing gaps in efficiency progress towards achieving the SDGs will be impeded.
- health economics
- health systems
- health systems evaluation
- other study design
This is an open access article distributed in accordance with the Creative Commons Attribution Non Commercial (CC BY-NC 4.0) license, which permits others to distribute, remix, adapt, build upon this work non-commercially, and license their derivative works on different terms, provided the original work is properly cited, appropriate credit is given, any changes made indicated, and the use is non-commercial. See: http://creativecommons.org/licenses/by-nc/4.0/.
Statistics from Altmetric.com
Key questions
What is already known?
High-income countries tend to be more efficient than low/middle-income countries in converting their health resources into health outcomes (increased life expectancy).
Robust methodologies exist for comparing the technical efficiency of different countries but have not before been applied to a global set of countries to assess the efficiency with which health spending converts to universal health coverage (UHC) indicators.
What are the new findings?
Although countries with higher incomes tend to be more efficient, some low-income and middle-income countries outperform higher income counterparts.
The main drivers of efficiency in achieving UHC are governance, income and education.
What do the new findings imply?
Efficiency is an important measure of progress on achieving UHC. This study serves as a benchmark on UHC efficiency prior to the introduction of the sustainabledevelopment goals (SDGs), enabling future work to draw comparisons of pre-SDG and post-SDG.
Countries who perform relatively poorly (low efficiency) could learn from better performing peers and replicate efficient strategies to avoid wastage of resources while improving health outcomes.
Background
Following the successes of the millennium development goals, the United Nations introduced 17 sustainable development goals (SDGs) to continue progress on global development. Within SDG 3 (‘Ensure healthy lives and promote well-being for all at all ages’), target 3.8 aims to ‘achieve universal health coverage (UHC), including financial risk protection, access to quality essential healthcare services and access to safe, effective, quality and affordable essential medicines and vaccines for all’.1 UHC comprises three dimensions: covering more people, offering more services and increasing financial protection. Although no country will ever reach 100% of services for 100% of its people at no cost to the individual, progress is being made, although with each country following its unique path.2 Performance management and efficiency are considered priorities for public health systems,3 crucial to accelerate progress on health outcomes at times of slow economic growth and health budget limitations.4
WHO estimates that half of the world’s population cannot access basic essential services, and in 2015, 12.7% of the global population experienced catastrophic health expenditures (out-of-pocket payments (OOP) greater than 10% of their household budgets).5 There are stark global inequalities in both healthcare provision and health. Health and other inequalities leading to ill-health (eg, education, social behaviours, income and so on) exist both between and within countries, yet some countries have been able to achieve relatively better outcomes than peers with similar levels of income.6 UHC aims to address within-country and cross-country inequalities in health by providing an underlying level of access to care for all individuals within a population. Other social inequalities ought to be addressed via other public and social interventions but are considered in this paper as factors associated with health status.
At this stage, it is unknown how efficiently different countries use their resources to progress towards UHC coverage goals. The WHO established performance measurement and efficiency as priorities for public health systems worldwide.3 Given growing and ageing populations, fiscal constraints, competing development priorities, an expansion of healthcare options and providers, and an increased need for healthcare with a rising prevalence of non-communicable diseases, healthcare budgets are increasingly restricted and thus optimising health inputs to produce maximum health outcomes is a paramount management objective of public health systems. WHO has estimated that 20%–40% of health systems’ resources are wasted,2 thereby undermining service delivery. By reducing inefficiencies, welfare gains can be achieved in the absence of budget increases. This paper measures how efficiently countries convert existing resources into UHC, providing a benchmark of UHC performance in 2015, when the SDGs were introduced, and enabling cross-country comparisons going forward. Specifically, three questions are posed: (1) how efficient are different countries at converting healthcare inputs into UHC coverage goals? (2) what factors are associated with efficiency? and (3) what lessons can guide the efficient provision of UHC for countries going forward? This paper improves on the existing literature in four ways: first, it focuses on UHC service provision rather than health systems outcomes in general; second, it includes 172 countries in the analysis compared with smaller sample sizes found in other studies; third, it uses a complete service coverage index and finally, it applies a more robust and refined efficiency measurement technique.
Methods
Data envelopment analysis (DEA)
DEA is a widely used linear programming technique to measure performance in healthcare because it offers a deterministic relationship between resource inputs and health outcomes, and can incorporate several inputs and outputs simultaneously.4 7 DEA calculates a relative efficiency score for decision-making units (DMUs) based on an optimally weighted allocation for a set of inputs and outputs. DMUs, countries in this analysis, receive scores between 0 (least efficient) and 1 (most efficient) with the efficient DMUs forming a production frontier that envelopes others, and to which all inefficient DMUs are compared. DEA models define efficiency as the weighted sum of outputs to the weighted sum of inputs, comparing how well countries convert inputs into outputs. Inefficiency is then the ratio of actual to ‘optimal’ performance.8
DEA models can be input-oriented or output-oriented. The former minimises inputs for a constant set of outputs while the latter maximises outputs while holding inputs constant. This paper uses output-oriented DEA because changes to inputs are unlikely to take place in the short term in complex national health systems.9 This approach is consistent with the existing literature, which has opted for output orientation in health system DEA9–11 given that changes to inputs are unlikely to take place in the short-run and managers have little discretion over budget allocations.12 13 Decentralised systems have far less control over how local units’ budgets are allocated and cannot necessarily reallocate inputs.14 Countries with large private healthcare markets or relying on donor aid also have little influence over how healthcare is organised. A description of the DEA algorithm can be found in online supplemental materials S1 and S2.
Supplemental material
Secondary analysis
The two-stage DEA investigates the factors associated with the estimated efficiency scores. Simar-Wilson bootstrapping15 is a two-stage DEA method that has been widely applied in analyses at the national, regional, hospital and ward levels.12 16 17 The Simar-Wilson method adjusts the standard DEA score by the amount of bias caused by contextual factors. In the second stage, the bias-corrected efficiency scores are regressed in a truncated model against explanatory variables suspected of impacting the outputs, which corrects the estimates from serial correlation and measurement error of the technical efficiency scores.18 Repeated samples are drawn with replacement, thus approximating the true sampling distribution of the DEA and subsequently estimating CIs not suffering from bias. In this study, 1000 bootstrap iterations are performed, thus allowing for a good approximation of 95% CIs.15 The result measures technical efficiency, the ratio of actual output to maximum possible output or minimum possible input to actual input,19 alongside the estimated bias-corrected efficiency scores.
Data sources
Cross-sectional data for health systems and environmental variables were obtained from the WHO Global Health Observatory and Global Health Expenditure Database,20 and the World Bank’s World Development Indicators for 193 countries.21 Countries with missing data were excluded. Countries were grouped by income according to 2015 World Bank classifications. Patients and public were not involved in the research given that this was not relevant to the study.
Outputs
While progress has been made in compiling service coverage data, financial protection data remain sparse and outdated.22 Typically, cross-country performance reviews include outputs such as life expectancy and mortality rates to reflect overall population health.23–25 However, UHC coverage targets and indicators are more directly related to healthcare spending than health outcomes (eg, life expectancy and mortality) are, and therefore we opt to use UHC outputs as a more accurate reflection of the association between health spending and health outcomes.17 To measure UHC attainment, two indicators from the UHC Monitoring Framework are used as output variables.26
UHC service coverage index
This WHO-produced index variable comprises 16 tracer indicators relating to reproductive, maternal and child health; non-communicable diseases; communicable diseases; and service capacity and access.27 The index values for 2015 are available for all countries.
Proxy for financial risk protection
In the absence of complete data on financial risk protection, one minus OOPs (1−OOPs) as a proportion of current health expenditure (CHE) is used as a proxy for impoverishing spending. As data availability improves, catastrophic health expenditure (defined as OOPs exceeding a threshold of total household consumption22) should replace 1−OOPs/CHE as the output.
Combining these two outputs is important since they must be obtained simultaneously. High levels of service coverage is ineffectual if it leads to impoverishment; reduced OOP could reflect both good state-funded provision of care or low uptake of services due to cost barriers. To reflect this, the model is required to assign each output a weight greater than 0, forcing the model to include both.
Inputs
The input is CHE in 2015 int$. A 5-year average from 2011 to 2015 is used to reflect a lag in outputs and to smooth outliers and/or mismeasurement in the data. The paper considers CHE rather than government expenditure (as conducted previously by Jowett and colleagues17) because this includes other forms of health financing, including private pooled insurance and OOPs. If private input contributions were not included, service coverage would appear relatively more efficient for those countries with higher proportions of private payments.
Second-stage DEA: what explains variations in efficiency?
UHC efficiency can be explained by social, political, economic or environmental explanatory factors. Isolating those associated with UHC efficiency could highlight focus areas for policy-makers and control for inherent biases caused by factors outside of the health system. We expect variables such as income, governance, education and health system capital (number of beds and doctors) to be associated with efficiency. Detailed variable descriptions and their expected relationship with technical efficiency are presented in the online supplemental material S3.
Key statistics for inputs, outputs and explanatory variables
Descriptive statistics (included in online supplemental material S4) highlighted the unequal distribution of healthcare globally. Per capita health expenditure ranges from $23.4 in the Democratic Republic of the Congo (DRC) to $8181.5 in the USA. Even within low-income countries, Haiti spends seven times more ($159.8 per capita) than DRC. Similarly, 76% of expenditure on health in Yemen is out-of-pocket, compared with almost 0% in Kiribati. Average service coverage and government expenditure steadily increase across income groups. Electricity access more than doubles between low-income and lower-middle income countries. Education and governance appear to increase as income rises. Health worker density and number of beds increase steadily across income groups. Overall, country health profiles are heterogeneous, with trends favouring high-income countries.
Model specifications
The second-stage analysis included a Simar-Wilson bootstrap (Algorithm #2) to test bias-corrected variable returns-to-scale (VRS) efficiency scores against environmental variables to investigate which factors are associated with how efficiently countries provide UHC. The paper uses VRS rather than constant returns-to-scale because countries do not operate as optimal scales, whereby an increase in inputs produces a proportionate increase in output.28 This analysis could aid policy-makers in determining which actions to take in order to reach UHC goals more efficiently, given the current level of national spending. Nine potential environmental variables were considered for inclusion in the double bootstrap regression. Spearman’s rank correlation showed strong, but not severe correlation, with 0.7526 being the highest correlation value between education and governance. The main model includes eight environmental factors with data for all 172 countries, while the secondary model includes these eight plus the Gini Index, which had data available for 145 countries. Service coverage prioritises equity-seeking countries and inequality might impact efficiency. Therefore, the secondary model captures the effect of within-country inequalities.
Sensitivity analysis
To assess the robustness of the findings, given that DEA can produce sensitive results, an in-depth sensitivity analysis was performed. The following adjustments were made to determine the robustness of results:
The financial protection proxy, 1−OOPs/CHE, was substituted with domestic general government expenditure (GGHE-D)/CHE, which is a similar and alternative proxy for financial protection, but without considering private pooled insurance.
3-year lag for CHE were used in place of the 5-year lagged average to test the sensitivity of the time lag.
Outlying countries were removed one at a time, since deterministic models like DEA do not allow for random noise and are particularly sensitive to outliers.
Tobit regression as an alternative methodology was used as second stage in place of Simar-Wilson.
Results
There is an exponential relationship globally between health expenditure and both UHC indicators (figure 1). Initially, small increases in health expenditure yield large changes in service coverage and financial protection. Yet, as levels of health expenditure rise, the marginal improvement to UHC outputs diminishes. There are decreasing marginal returns because the most cost-effective programmes are typically implemented first. From figure 1, it appears that there is little additional benefit when spending more than $2000 per capita. However, this is partly because the service coverage indicator omits the benefits of secondary-level and tertiary-level spending outside of the 16 tracer indicators, which reflect primary care coverage. Under $2000 per capita, large health gains are associated with marginal additional expenditure.

UHC indicators by current health expenditure. CHE, current health expenditure; OOP, out-of-pocket payment; UHC, universal health coverage.
Technical efficiency of converting health spending into UHC outputs
Table 1 indicates that high-income countries can improve their efficiency by up to 5%. By comparison, low-income countries can produce 31% more UHC outputs under full efficiency. These findings suggest high-income countries on average produce UHC outputs more efficiently than other income groups after correcting for bias. Top performers by income group are Switzerland, Austria and Belgium (high income), Colombia, Brazil and Peru (upper-middle income), El Salvador, Samoa and Vietnam (lower-middle income) and Malawi, Zimbabwe and Rwanda (low income).
Summary of bias-corrected Shepherd efficiency scores by income group (full results in online supplemental material S4)
Associations of technical efficiency
Results from the Simar-Wilson bias-corrected regression identify three variables that were statistically significantly associated with a country’s technical efficiency (table 2). These are: (a) Gross Domestic Product (GDP) per capita, (b) governance capacity and (c) education. Higher income, better governance and more years of schooling within a country are associated with greater technical efficiency in converting health spending to UHC goals. Governance has the strongest relationship with efficiency and a one unit increase in governance could lead to a 0.06-unit improvement in UHC service goals, keeping health expenditure constant.
Associations of Simar-Wilson bias-corrected efficiency scores
When including the Gini index for a secondary model with a subset of 145 countries, findings suggest that inequality is significantly positively associated with technical efficiency but results in governance becoming insignificant. Countries with more inequality tend to more efficiently provide UHC. This is the opposite of what is to be expected and therefore this result should be interpreted cautiously.
Sensitivity analysis of efficiency scores
The sensitivity analysis demonstrated that the results of this study are largely robust (further details in online supplemental material S5). Substituting the financial protection proxy to GGHE-D/CHE had an average effect of 0.1% across all countries’ bias-corrected efficiency scores and resulted in income becoming insignificant and electricity significant. Removing efficient and outlier DMUs did not substantially impact results, with three countries moving more than 5% on average and none changing more than 7%. Education, GDP per capita, governance and electricity were significant when using a Tobit regression instead of a Simar-Wilson bootstrap.
Discussion
Associations of efficiency
This paper estimates how efficiently total health expenditure per capita is converted into UHC service goals for 172 countries in 2015 and provides a pre-SDG baseline for future analyses. We address a gap in the literature on UHC efficiency by using most recent UHC data and applying a more robust methodology, specifically DEA with a double bootstrap truncated regression analysis, to more countries than in previous studies. Given large heterogeneity across countries, comparisons are made within peer groups.
The main study findings suggest that although high-income countries tend to outperform lower income countries, some countries such as Colombia, El Salvador and Malawi outperform their income group peers. This implies that for a given level of resources and spending, peers could increase their performance and increase their outcomes against UHC indicators. Peers should emulate best practice approaches that these outperforming countries have taken, to the extent that they are compatible in the national and local context. Simar-Wilson bootstrap results suggest that, in the main model, GDP per capita (income), governance capacity and education have a statistically significant relationship with how efficiently a country can convert spending into UHC service goals.
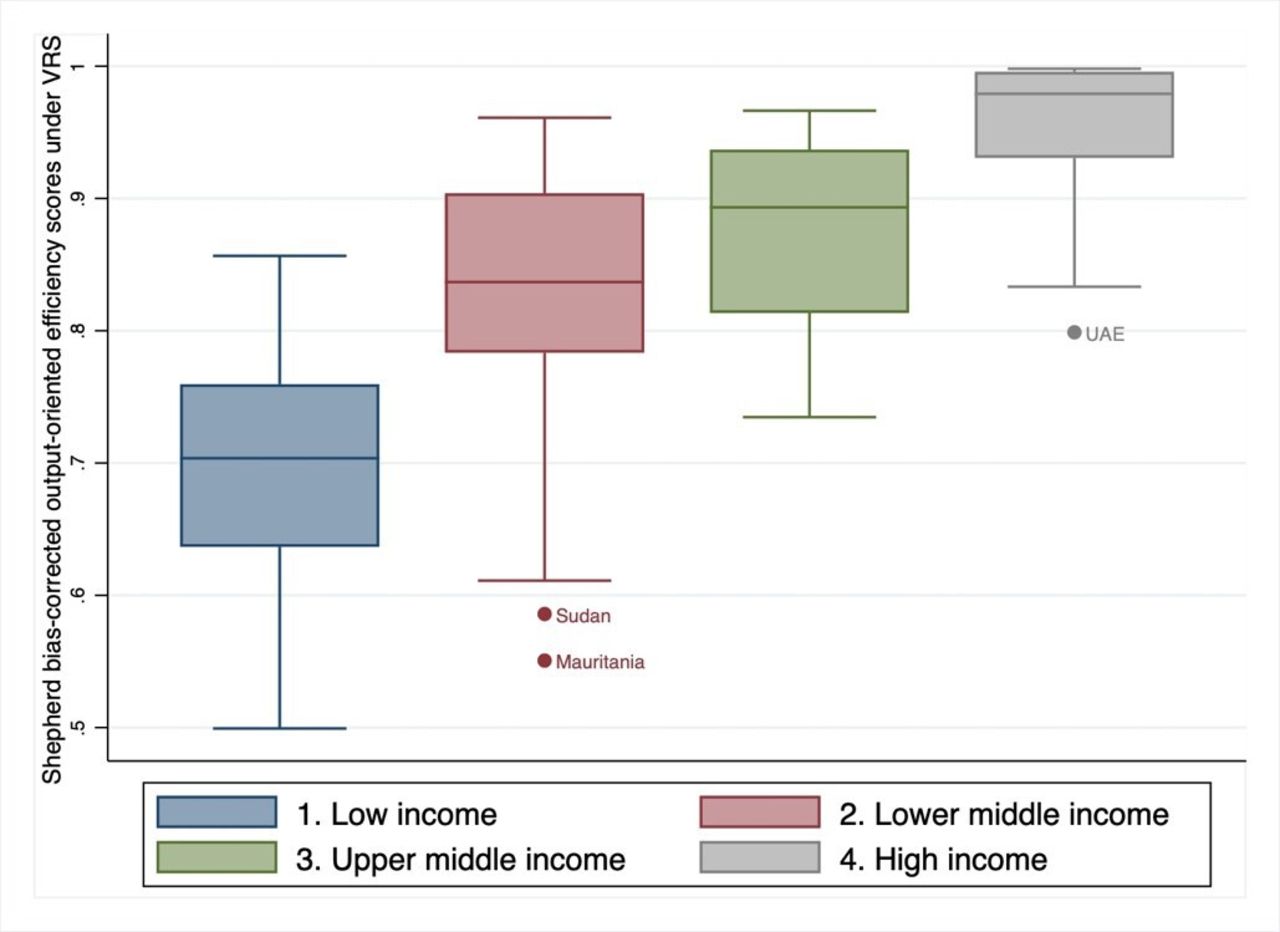
The mean efficiency scores by income group after bias-correction were 95% (SD 0.05), 88% (SD 0.07), 82% (SD 0.10) and 69% (SD 0.11) for high, upper-middle, lower-middle and low-income countries respectively. The lowest score was 49.9% for Mali. Figure 2 shows the distribution of bias-corrected efficiency scores within income groups.

Distribution of VRS bias-corrected efficiency scores by income group. VRS, variable returns-to-scale.
There are opportunities to improve efficiency
Many countries, particularly low or middle income, can drastically improve the efficiency with which they provide UHC. Specific policy changes should be investigated further for contextual, evidence-based and implementable advice for decision-makers at national levels. We show that there are three ways to improve efficiency. The first is reducing healthcare expenditure, holding all else constant. Most countries showed decreasing returns to scale in the DEA. Covering more people becomes increasingly costly since hard-to-reach individuals are covered last, at greater cost. Countries with worse health outcomes are likely to experience the effects of diminishing marginal returns, where initial returns to investment are high and decrease as the investment increases. As countries spending little spend more, the gap in spending will close and efficiency gains from low spending will be less pronounced. To improve efficiency at already high levels of expenditure, countries require an even greater focus on efficiency to improve health outcomes. This said, even at higher marginal costs, governments should continue to prioritise health spending given the direct relationship with health and quality of life associated therewith. Three common drivers in countries’ UHC trajectories include: political reforms in favour of UHC; income growth and increased health spending; and increased pooled spending over OOP.29 Thus, increasing health spending will help countries progress towards achieving UHC. Highly privatised health systems are also considered more inefficient than public ones, and therefore countries should try to reduce fragmentation and move towards unitary publicly financed health systems to improve efficiency.30
More services can be provided for the same expenditure by reallocating and diversifying resources towards most cost-effective programmes, thereby covering more essential services. For example, Chad and DRC have low scores for access to modern family planning methods and tuberculosis treatment coverage. Increasing service coverage from the lowest score to the highest is associated with 21 years of additional life.27 One way to reduce costs and provide more services would be a shift to primary and preventative healthcare, which often requires improving step-down facilities and procedures for referral.30
Good governance matters
Good local governance plays a significant role in achieving UHC service goals efficiently, according to our results. The role of strong governance mechanisms in allocating health resources most efficiently and effectively, thereby improving health coverage and status, is recognised in the context of maternal and child health, a key dimension of UHC.31 More broadly, one leading theory on the causative processes leading to economic growth and development suggests that development is reliant on institutions.32 We have shown that governance (defined as institutional strength, institutional memory and political commitment) are key to achieving UHC coverage goals. Political engagement, ideally at the highest levels of government, is also a likely prerequisite to achieving UHC efficiency improvements.
In addition to developing local governance, policy-makers can seek guidance from global governance mechanisms and non-state actors which also play a critical role in local delivery of health programmes, through collective action and developing norms and standards.33 Good governance practices supported by national and supranational health actors, including governments, large donors and international organisations, should be locally tailored to suit national interests before being implemented but can provide pragmatic solutions to delivering care equitably, effectively and cost efficiently.
Efficiency gains can compound
While producing more outputs for the same level of inputs is itself valuable, efficiency gains may support requests for budget reallocation towards healthcare if ministries can prove to national treasuries or aid donors that they are attaining a high return on investment. Funds may migrate towards programmes or countries providing efficient UHC services.
Does income matter?
Income is significant in both the main model and the secondary (includes Gini Index). Both models demonstrate clear trends in UHC provision efficiency by income group. Lower efficiency scores are predominantly seen among lower income nations, many of which suffer from political, economic and regional instability. Yet, lower income does not eliminate the possibility for countries to perform efficiently. El Salvador, Samoa and Vietnam (lower-middle-income) have scores higher than some high-income countries (for example Estonia, Bahrain and Slovakia) and Malawi (low-income) performs better than several upper-middle-income countries. Prior to bias correction, several low-income countries are equally as efficient as high-income countries, suggesting that income group does not eliminate the ability to provide UHC efficiently.24 Income likely aids efficiency, but UHC efficiency can be attained at any income level with the right supporting factors in place.
Our findings that income (GDP per capita), education and governance are related to how efficiently countries convert health spending into UHC are aligned with findings from similar studies (although these look at healthcare not UHC).34 35 Standard cross-country efficiency studies are frequently criticised in that measures of health (typically life expectancy and mortality) are highly influenced by factors widely outside the health system.36 Our approach better withstands this criticism since it is measuring the efficiency of the health system’s ability to produce UHC service goals (a direct relationship) and not good health generally (an indirect relationship).
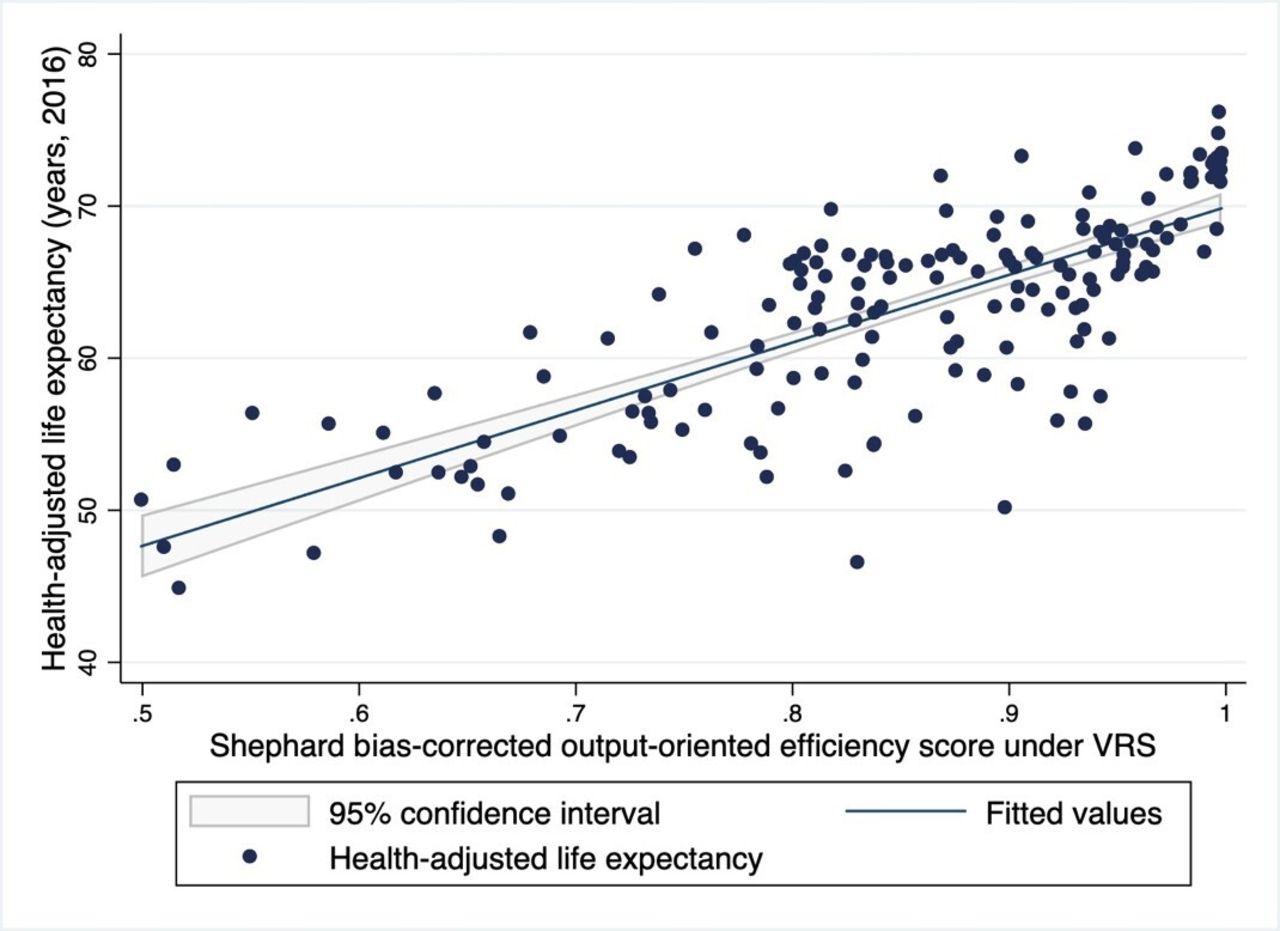
We explored the relationship between UHC efficiency and good health more generally, which is the ultimate goal of UHC provision. UHC is important for achieving good health outcomes37 but the relationship between how efficiently UHC is provided and good health has not been investigated. Figure 3 shows a strong linear relationship between bias-corrected technical efficiency scores and health-adjusted life expectancy (HALE) in the following year. Since the latest data on HALE are from 2016, and historical UHC data are not available, a time lag could not be incorporated and a full regression analysis should be performed when the data become available.

Relationship between bias-corrected technical efficiency scores and HALE in the following year. HALE, health-adjusted life expectancy; VRS, variable returns-to-scale.
DEA methodology has intrinsic limitations. It is deterministic, relying heavily on the data selected; it is only as good as the data that inform it and cannot perform where data are absent, nor can it produce useful estimates if the underlying data are inaccurate. Additionally, DEA provides a relative measure of each unit to ‘perfectly efficient’ peers scoring one, and so including or excluding certain peers could influence the relative performance and results. The methodology assumes a homogeneous production function, which is unrealistic, as not all countries have access to the same human capital and technology. Efforts should be made to complete datasets for countries with missing health systems data to avoid the need for a financial protection proxy. The choice of variables used for the second-stage analysis was largely dependent on data availability. Many of these limitations have been addressed through sensitivity analysis. The conclusions drawn from the findings remained largely consistent despite adjustments to the models. Further studies could investigate the optimal combination of primary to secondary/tertiary care maximum efficiency or the effects of UHC efficiency on HALE. These questions require more nuanced healthcare data.
Conclusion
These findings provide a benchmark for the efficiency that countries convert expenditure to UHC, offering a useful comparison for post-SDG studies assessing progress towards UHC attainment. This study fills a literature gap in UHC-specific efficiency analysis and benefits from its wide country coverage and its robust methodology. The findings suggest that although high-income countries tend to outperform lower income countries, some countries such as Colombia, El Salvador and Malawi outperform their income group peers. Peer countries could emulate some of the best practice approaches these countries have taken, to the extent that they are compatible in the national and local context. Better governance, improved education, higher GDP per capita and Gini Index are significantly associated with how efficiently countries convert total health expenditure into UHC. Health outputs, such as UHC efficiency, may be better indicators than health outcomes to guide national policy development for health system strengthening, as health outputs have a more direct relationship with national health spending. Efficiently producing UHC is likely to positively impact health outcomes, and without addressing gaps in efficiency, progress towards achieving the SDGs will be impeded.
References
Supplementary materials
Supplementary Data
This web only file has been produced by the BMJ Publishing Group from an electronic file supplied by the author(s) and has not been edited for content.
Footnotes
Handling editor Lei Si
Contributors HH-B and EJ conceptualised the study. EJ collected and collated the data, carried out the analysis and wrote the first draft of the paper. HH-B, CP, MJ and GJAJ contributed to the interpretation of the results and contributed to the final written version of the paper. All authors approved the final version of the manuscript.
Funding The authors have not declared a specific grant for this research from any funding agency in the public, commercial or not-for-profit sectors.
Competing interests None declared.
Patient consent for publication Not required.
Provenance and peer review Not commissioned; externally peer reviewed.
Data availability statement Data are publicly available from the WHO Global Health Observatory database, and may be shared directly upon request.
Supplemental material This content has been supplied by the author(s). It has not been vetted by BMJ Publishing Group Limited (BMJ) and may not have been peer-reviewed. Any opinions or recommendations discussed are solely those of the author(s) and are not endorsed by BMJ. BMJ disclaims all liability and responsibility arising from any reliance placed on the content. Where the content includes any translated material, BMJ does not warrant the accuracy and reliability of the translations (including but not limited to local regulations, clinical guidelines, terminology, drug names and drug dosages), and is not responsible for any error and/or omissions arising from translation and adaptation or otherwise.