Article Text

Abstract
Introduction Understanding the number of cases of podoconiosis, its geographical distribution and the population at risk are crucial to estimating the burden of this disease in endemic countries. We assessed each of these using nationwide data on podoconiosis prevalence in Cameroon.
Methods We analysed data arising from two cross-sectional surveys in Cameroon. The dataset was combined with a suite of environmental and climate data and analysed within a robust statistical framework, which included machine learning-based approaches and geostatistical modelling. The environmental limits, spatial variation of predicted prevalence, population at risk and number of cases of podoconiosis were each estimated.
Results A total of 214 729 records of individuals screened for podoconiosis were gathered from 748 communities in all 10 regions of Cameroon. Of these screened individuals, 882 (0.41%; 95% CI 0.38 to 0.44) were living with podoconiosis. High environmental suitability for podoconiosis was predicted in three regions of Cameroon (Adamawa, North West and North). The national population living in areas environmentally suitable for podoconiosis was estimated at 5.2 (95% CI 4.7 to 5.8) million, which corresponds to 22.3% of Cameroon’s population in 2015. Countrywide, in 2015, the number of adults estimated to be suffering from podoconiosis was 41 556 (95% CI, 1170 to 240 993). Four regions (Central, Littoral, North and North West) contributed 61.2% of the cases.
Conclusion In Cameroon, podoconiosis is more widely distributed geographically than was initially expected. The number of cases and the population at risk are considerable. Expanding morbidity management and follow-up of cases is of utmost necessity. Promotion of footwear use and regular foot hygiene should be at the forefront of any intervention plan.
- podoconiosis
- non-filarial
- elephantiasis
- lymphedema
- cameroon
- mapping
This is an open access article distributed in accordance with the terms of the Creative Commons Attribution (CC BY 4.0) license, which permits others to distribute, remix, adapt and build upon this work, for commercial use, provided the original work is properly cited. See: http://creativecommons.org/licenses/by/4.0/
Statistics from Altmetric.com
Key questions
What is already known?
Previous studies have documented that, although prevalence is low, podoconiosis is widespread in Cameroon.
This is the first comprehensive analysis using modelling and nationwide data to estimate the population at risk and burden of podoconiosis in Cameroon.
What are the new findings?
Our model prediction suggests marked ecological limits and identified environmental drivers of podoconiosis in Cameroon.
In 2015 in Cameroon, there were 5.2 (95% CI 4.7 to 5.8) million people at risk and 41 556 (95% CI, 1170 to 240 993) podoconiosis cases.
What do the new findings imply?
The findings presented here indicate the need to scale up interventions including early diagnosis, morbidity management and follow-up of cases.
Introduction
Neglected tropical diseases affect more than 1 billion people, the vast majority of whom are among the poorest living within endemic countries.1 The neglected tropical disease podoconiosis is one of the principal causes of tropical lymphoedema,2 3 which can lead to massive swelling of the lower legs with subsequent suffering to those affected.2 4 The disease is found in highland areas of tropical Africa, Central America and limited areas of India (north-west) and south-eastern Asia, according to WHO.5 6 However, the actual geographical distribution and burden remain unknown in most endemic areas. Determining the burden and geographical distribution of podoconiosis is of utmost importance to guide resource allocation and to monitor and evaluate the impact of prevention and control interventions.2 5 Additionally, estimating the number of potential cases has shown to help strengthen active surveillance and inform national control strategies and case enrolment.7 8
Podoconiosis is one of the diseases with potential for elimination.9 It can easily be prevented through the consistent use of footwear starting in early childhood, coupled with proper foot hygiene. Those who have developed the disease can reduce their likelihood of morbidity and disability through hygiene-based management.2 This includes foot hygiene, custom-made footwear, bandaging, exercise and elevation, wound care and prevention and management of acute attacks. Previous studies have documented the success of these strategies in improving quality of life and reduction of morbidity burden.9–11
Podoconiosis is caused by long-term exposure to red clay soils, with mineral particle-induced inflammation on a background of genetic susceptibility.12–17 Interactions between genetic and environmental factors trigger an inflammatory response that leads to lymphoedema and fibrosis.2 It is hypothesised that mineral particles that penetrate bare skin are engulfed by macrophages in the lower limb lymphatics and induce an inflammatory response in the lymphatic vessels. This is followed by fibrosis and obstruction of the vessel lumen leading to oedema of the lower leg, which progresses into elephantiasis.2
Certain types of soils such as clay and silt have proven to be associated with a higher risk of podoconiosis.13–15 Thus, soils that are fine textured and sticky in nature are more easily able to penetrate the skin and become absorbed within the body.18 Rainfall, altitude, terrain slope and some types of land cover have been found to favour the occurrence of podoconiosis.13–15 All these factors ultimately contribute to the type of soils generated.14
Nowadays, the availability of geographical data on soil composition, climate (ie, temperature and precipitation) and topography, primarily derived from remotely sensed data, and the development of robust statistical and modelling approaches are making the study of the relative contribution of all these environmental factors possible.7 14 15 Studies conducted in Ethiopia, a country that is thought to bear the highest burden of podoconiosis, have enabled identification of up to eight environmental factors (elevation and derived slope, annual precipitation, Enhanced Vegetation Index (EVI), clay and silt content of the top soil, population density and distance from water bodies) driving the distribution of podoconiosis across the country.14 Other research carried out in Ethiopia, but on a more local scale, showed that soil chemicals such as smectite quartz and mica, present in clay-rich soils, were strongly associated with the occurrence of podoconiosis.15 However, it is likely that these factors and others that may not have been reported yet do not equally influence the distribution of podoconiosis everywhere. Therefore, identifying environmental factors that determine the distribution of podoconiosis in distinctive geographic areas should be considered a prerequisite for delineating the global distribution of podoconiosis.2 5 14
In Cameroon, another podoconiosis-endemic country, a few studies have been conducted in the north-west of the country.19–21 Yet, the presence of podoconiosis elsewhere in Cameroon and the environmental drivers underpinning its distribution remain to be determined. We use machine learning and geostatistical methods7 13 14 and podoconiosis prevalence data collected in two surveys in Cameroon to (1) identify the environmental drivers of podoconiosis, (2) determine its geographical limits and finally (3) estimate the disease burden in environmentally suitable areas.
Methods
Podoconiosis prevalence data
We compiled a database of 748 geo-located prevalence records of podoconiosis in Cameroon (figure 1). Podoconiosis prevalence data were assembled from two cross-sectional surveys conducted in Cameroon. The first survey, conducted in the North West region of Cameroon in 2014, was a cross-sectional study involving stratified and cluster sampling. The sampling design and findings of this survey are detailed in a separate publication.22 Briefly, at least 50% of the communities from all the health areas in each of the 19 health districts of the region were screened for lymphoedema of the lower limbs. Preliminary community screening was carried out by trained community health implementers, and final confirmation of podoconiosis was done by expert research assistants and health personnel following a standardised clinical diagnosis algorithm.21 23 Overall, in the 19 Health Districts of the North West region of Cameroon, 204 551 individuals from 672 communities were investigated for podoconiosis. The second study was a nationwide cross-sectional survey conducted in 40 Health Districts from all 10 regions of Cameroon.24 In this survey, 76 communities were randomly selected, with 10 178 individuals from 4603 households screened for podoconiosis. Field workers used the same validated clinical diagnosis algorithm as that used in the first survey, to confirm podoconiosis case.

Distribution of surveyed community and background points for podoconiosis across Cameroon. Presence are points where presence of podoconiosis has been desired. Absence are areas where the absence of podoconiosis has been confirmed. Pseudo-absences are points to compensate for the lack of absence data; we created an evidence-based probabilistic framework for generating pseudo-absences.
Explanatory environmental variables
Data on extrinsic determinants of podoconiosis were assembled from remotely sensed environmental datasets (online supplementary figure 1S). Geographical coordinates of each community were used to extract from gridded map estimates on silt and clay soil fraction, pH of the soil, slope, precipitation, elevation, land surface temperature, distance to stable lights, EVI and distance to water surfaces (water bodies and streams).
Supplementary file 1
Gridded continuous maps, namely raster datasets, of averaged EVI and land surface temperature (LST) for the period 2000–2015 were obtained from the African Soil Information System project.25 This project generates time series average products for several environmental indicators such as vegetation indices and LST using MODIS satellite image data collected by the National Aeronautics and Space Administration. The MOD13Q1 product from MODIS library, which is updated every 16 days at 250 m spatial resolution, includes vegetation indices such as Normalised Difference Vegetation Index and EVI26 day and night LST data are generated from MOD11A2 products, and have a spatial and temporal resolution of 1 km and 8 days, respectively.27
Information on rainfall was extracted from a synoptic gridded map of annual precipitation calculated from monthly total precipitation gridded datasets obtained from WorldClim database.28 This database provides a set of global climate layers obtained by interpolation of precipitation data for the period 1950–2000 collected in weather stations distributed across the world.29 From the Consortium for Spatial Information (CGIAR-CSI), we obtained a raster dataset of elevation at 1 km2.30 This elevation layer resulted from processing and resampling the gridded digital elevation models (DEM) derived from the original 30-arcsecond DEM produced by the Shuttle Radar Topography Mission. The elevation raster was processed to calculate terrain slope in degrees.
Soil data including silt and clay fraction and soil pH of the top soil were obtained from the ISRIC-World Soil Information project.31 This project provides gridded maps of soil composition at 250 m resolution worldwide. We also generated continuous surfaces of straight line distance (Euclidean distance) in kilometres to the nearest water body and permanent rivers based on the Global Database of Lakes, Reservoirs and Wetlands32 and Digital Global Chart,33 respectively.
Finally, night-light emissivity for 2013 captured by the Operational Linescan System instrument on board a satellite of the Defence Meteorological Satellite Programme was used as a proxy measure of poverty across Cameroon.34 This instrument measures visible and infrared radiation emitted at night time, resulting in remote imagery of lights on the ground. This information has been correlated with gross domestic product in developed countries35 36and, although far from precise, would provide an indirect measure of poverty in these areas.37
Input grids were resampled to a common spatial resolution of 1 km2 using the nearest-neighbour approach and clipped to match the geographical extent of a map of Cameroon, and eventually aligned to it. Raster manipulation and processing was undertaken using raster package in R V.3.3.2 and final map layouts created with ArcGIS V.10.3 software (ESRI, Redlands, CA, USA).
Environmental modelling using machine learning approaches
An ensemble of distribution models was generated based on the reported occurrence of podoconiosis in the surveyed communities and the environmental factors. Communities were reclassified as endemic (1) or non-endemic (0) for podoconiosis based on records of confirmed podoconiosis cases. We used two machine learning-based algorithms available within the BIOMOD framework38 to obtain those ensembles of predicted distribution: generalised boosted regression tree modelling (BRT) and random forest (RF). The latter was run using the parameters set by default in the biomod2 R package38 whereas for the former, the learning rate (lr) and tree complexity (tc), key parameters in BRT models, were set enabling the model to account for up to four potential interactions and slowing it down enough (lr: 0.005) to get the model converged without overfitting the data. This tuning was undertaken using the gbm package in R V.3.3.2.
All these models are intended to discriminate the suitability of the environment for the presence of podoconiosis (ie, environmental suitability), and for this they need to be trained with presence and absence records. From this first modelling exercise, we had to make some decisions regarding the community data to be used due to differences on sampling design between the two cross-sectional surveys. While the first survey dataset was obtained during an intensive screening exercise in a region known to be endemic for podoconiosis, the nationwide cross-sectional survey was intended to be geographically representative of disease distribution across the country. Therefore, the unbalanced representation of communities at North West region was compensated by selecting a random subset (75%) of ‘positive’ communities (reporting podoconiosis cases) from this region and generating a set of background points or pseudo-absences39 for the whole dataset (figure 1). Background points were randomly selected with the underlying geographical bias as the occurrence data, as some authors have recommended it.40 For this, we created a sampling bias surface by counting the number of occurrence records within each grid cell (1 km x 1 km resolution) and then extrapolated these data across Cameroon using kernel density estimation. We used kernlab, ks and sm R packages for running this process. Lastly, we generated the background points (n=500) from random locations weighted by the sampling bias surface.41 42 In order to maximise the ability of the model to discriminate between suitable and unsuitable areas, regression weights were used to down-weight pseudo-absence records, so that the summed weights of the absence and pseudo-absence records matched that of the presence records.
Models were calibrated using an 80% random sample of the initial data and evaluated against the remaining 20% data using the area under the curve (AUC) of the receiver operation characteristic (ROC), the true skill statistic (TSS)43 and the proportion correctly classified (PCC). Projections were performed 100 times, each time selecting a different 80% random sample while verifying model accuracy against the remaining 20%. The evaluation statistics (AUC and TSS) were used to select the models to be assembled based on the matching between predictions and observations. Here, models with AUC <0.8 or TSS values <0.7 were disregarded when assembling the final model.
The final assemble model was obtained by estimating the mean of probabilities across the selected models per grid cell. The range of uncertainties was also calculated by estimating the CIs around the mean of probabilities across the ensemble per grid cell.
The resulting predictive map quantifies the environmental suitability for podoconiosis. In order to convert this continuous metric into a binary map outlining the distribution limits (ie, ecological limits), a threshold value of suitability was determined, above which transmission was assumed to be possible. Based on the ROC curve, the threshold value that represents a better trade-off between sensitivity, specificity and PCC was determined.
In addition, partial dependence functions were performed separately for both modelling approaches (BRT and RF) to visualise dependencies between the probability of podoconiosis occurrence and covariates. The partial dependence function shows the marginal effect of each covariate on the response after averaging the effects of all other covariates.
Geostatistical modelling to estimate disease burden
Empirical data and spatially matched covariates were then used within a geostatistical framework. We developed a geostatistical model to predict podoconiosis prevalence in environmentally suitable areas, as delineated by first modelling exercise, at village level across Cameroon. We let podoconiosis risk depend on the suite of measured risk factors mentioned above. We included spatial random effects in order to account for spatial variation in podoconiosis prevalence between villages that is not explained by the explanatory variables. We carried out validation of the model using a variogram-based procedure, which tests the compatibility of the adopted spatial structure with the data. More details are provided in the online supplementary material (Text 1S). The analysis was carried out using the R package PrevMap, which implements parameter estimation and spatial prediction of geostatistical models. This model was applied to produce continuous predictions of prevalence of podoconiosis among adults (≥15 years old) at 1 km2 spatial resolution and probability maps exceeding a 1% prevalence threshold, which were used to define podoconiosis endemicity. We checked the validity of the assumed covariance model for the spatial correlation using the Monte Carlo algorithm and empirical semi-variogram as described in the online supplementary file (figure 2S). Additionally, maps of the number of SEs from the posterior mean prevalence of podoconiosis (≥15 years) and number of cases were generated for each 1 km×1 km grid location.
Gridded maps of both population density and age structure were obtained from the WorldPop project.44 45 We used these gridded surfaces of population estimates to compute the potential affected adult population (older than 15). An output raster dataset computing the estimated number of podoconiosis cases per grid cell was obtained by multiplying the 1 km2 raster dataset of predictive prevalence with the corresponding adult population density surface. The same procedure was used to estimate the uncertainty range of the affected population using the gridded surfaces of 95% CI for predicted prevalence. These surfaces were then used to extract the aggregate number of people with podoconiosis and uncertainty range by administrative area (health districts and regions).
Results
Main outcomes of surveys
A total of 214 729 records of individuals screened for podoconiosis in 748 clusters were assembled for the current analysis from all 10 regions of Cameroon. Of the 214 729 screened individuals, 882 (0.4%; 95% CI 0.38 to 0.44) had podoconiosis. Of the 748 clusters, 59.2% (443/748) recorded zero cases of podoconiosis. On average, the number of individuals screened per cluster was 273, with 83% screening 100 or more individuals (table 1).
General description of podoconiosis surveys conducted in Cameroon in 2014 and 2017
Factors associated with podoconiosis occurrence
Figures 3S to 6S in the online supplementary file show the marginal effect of each covariate on the probability of podoconiosis occurrence, while the relative contribution of each predictor variable on the outcome (podoconiosis prevalence) is summarised in figure 7S (online supplementary file). Both marginal effect plots and covariate contribution have been estimated separately for BRT and RF assemble models. Briefly, 6 of 11 selected environmental covariates were the major contributors to the assemble models: silt and clay fraction of top soil, precipitation, elevation, slope and distance to stable night lights (online supplementary figure 5S). In both modelling approaches, when the silt fraction exceeds 25%, the probability of podoconiosis occurrence increases. The association of probability of podoconiosis and annual precipitation is steadily high over 1000 mm and sharply decreases when the annual mean rainfall goes beyond 2000 mm to 2500 mm. Areas located between 1000 masl (metres above sea level) and 2000 masl are most suitable for the occurrence of podoconiosis. Slope above 10 degrees and clay fraction of the top soil exceeding 40% seem to prevent the occurrence of podoconiosis (online supplementary figure 3S to 6S).
Environmental limits of podoconiosis in Cameroon
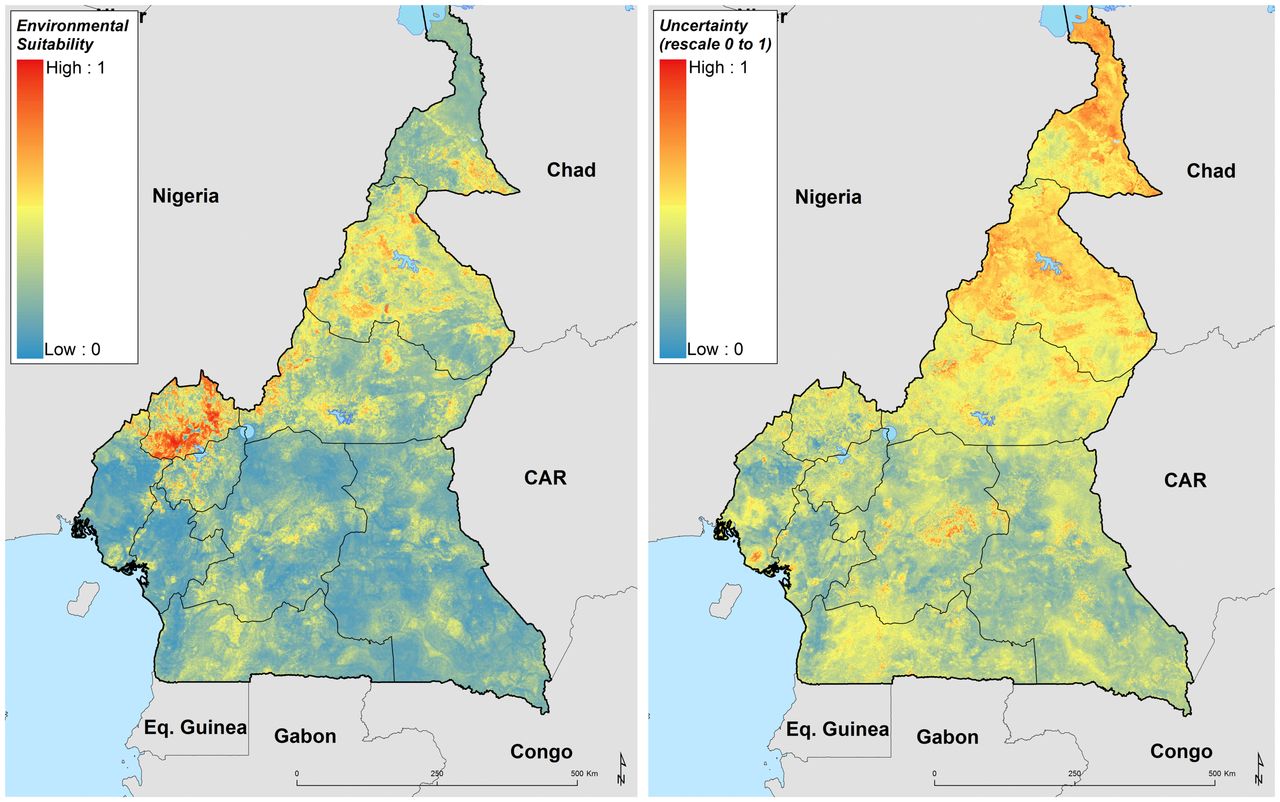
High environmental suitability for podoconiosis was predicted in three Regions of Cameroon (Adamawa, North West and North). Absence of podoconiosis was predicted in much of South West, Littoral, East, Central and South regions (figure 2). A suitability cut-off of 0.43 (0.39 to 0.45, for 95% CI lower and upper bounds, respectively) with a sensitivity of 99.6% and specificity 99.8% provided the best discrimination between presence and absence records in the training data, and therefore this threshold value was used to reclassify the predictive risk map into a binary map outlining the potential environmental limits of occurrence (figure 8S, online supplementary file). Uncertainty was calculated as the range of the 95% CI in predicted probability of occurrence for each pixel (figure 2) indicating high uncertainty in the northern part of the Extreme North region. Cross-validation analysis for the BRT and RF ensemble models using a 20% held-out subsample indicated their high predictive performance, with AUC values of 0.92 (95% CI 0.9 to 0.94) and 0.96 (95% CI 0.95 to 0.97), respectively. This high performance is also consistent through the true skill statistic, with TSS values of 0.78 (95% CI 0.75 to 0.82) and 0.82 (95% CI 0.8 to 0.86) for the BRT and RF models, respectively.

Ensemble of predicted environmental suitability models for podoconiosis and corresponding uncertainty of prediction. Uncertainty was calculated as the range of the 95% CI in predicted probability of occurrence for each pixel and rescaling to a 0–1 scale.
Predicted prevalence, population at risk and estimation of podoconiosis burden
The national population living in areas environmentally suitable for podoconiosis is estimated to be over 5.2 (95% CI 4.7 to 5.8) million, which corresponds to 22.3% of Cameroon’s population in 2015. The largest portion (32.2%) of the most-at-risk population live in the North West Region.
The predicted prevalence map showed heterogeneous distribution of podoconiosis burden across Cameroon (figure 3). The highest prevalence of podoconiosis is predicted in four regions (Adamawa, North West, North and in some parts of Extreme North). In the remaining regions, the distribution of podoconiosis would be focal and prevalence low. Nationally, we estimated 41 556 adults (95% CI 1170 to 240 993) to be living with podoconiosis in 2015 in Cameroon (table 2). Four regions (Central, Littoral, North and North West) contributed 61.2% of the absolute number of cases (figure 4). The greatest proportion of all individuals with podoconiosis resided in the Central Region (17.6%). The South and East regions contributed marginally to the total number of people with podoconiosis. At least one case of podoconiosis was estimated in 170 of 189 Health Districts. A total of 94 Health Districts reported ≥100 podoconiosis cases and only 20 had more than 500 predicted cases (table 1S). We have also estimated the continuous probability of exceeding 1% podoconiosis prevalence (the threshold considered for intervention) across the endemic areas (figure 5). Most of the areas have low probability of exceeding 1%, and only a few restricted areas at the North West region would potentially exceed that threshold.
Estimated number of podoconiosis cases and population at risk among adults in Cameroon in 2015.
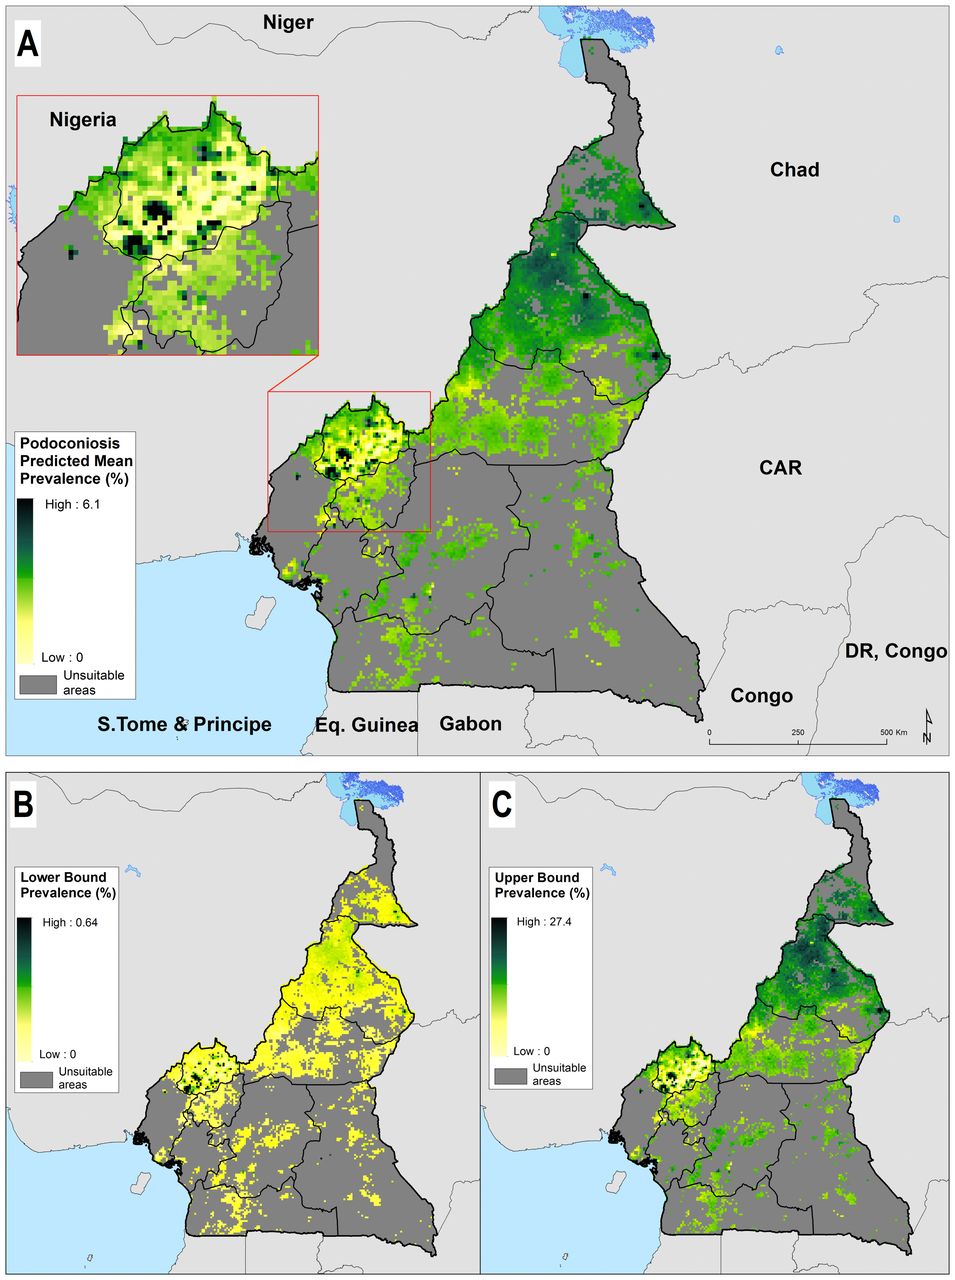
Predicted podoconiosis prevalence maps of Cameroon; mean predicted prevalence (A) and lower (B) and upper 95% CI bounds (C).

Estimated number of adults (≥15 years old) with podoconiosis across Cameroon: estimated number of cases (A) and lower (B) and upper 95% CI bounds (C).

Map of probability of exceeding 1% podoconiosis prevalence in Cameroon.
Discussion
Podoconiosis is a highly neglected disease that is often under-reported in endemic countries.2 46 Understanding the occurrence of podoconiosis is crucial for identifying populations at risk and to estimate the number of cases in order to scale up interventions.2 Here, we used data on podoconiosis prevalence to model the environmental suitability, estimate the population at risk and the number of cases of podoconiosis in Cameroon. We quantified the relationship of climate, environmental and meteorological factors to the spatial distribution of podoconiosis. Our model prediction suggests marked ecological limits separating the broad areas of environmental suitability in western, central and northern parts of Cameroon from the southern and eastern parts of the country, which are considered to be free of podoconiosis. Despite estimating a large number of individuals living in the predicted podoconiosis risk zone (5.2 million), the total number potentially affected would be relatively small (41 556 adults). This suggests that the disease could be controlled and eliminated in Cameroon if the appropriate interventions were put in place in the most-at-risk areas. However, current intervention efforts in the country cover only a fraction of the population potentially at risk.2
We believe this work increases insight into the epidemiology of podoconiosis and simultaneously has practical consequences for the Cameroon health system. First, the identification of areas at risk and quantification of disease burden presented in this work should support more comprehensive plans for podoconiosis control in Cameroon. The risk maps presented can help set priority areas for intervention and lead to more rational use of available resources. Health services and surveillance systems in these at-risk areas should be prepared to diagnose podoconiosis cases correctly and provide the necessary healthcare that patients require. Ensuring health workers are well trained in the diagnosis and management of podoconiosis is essential.
Second, we have extended the understanding of the environmental drivers of podoconiosis. In addition to the factors identified in previous work,13 24 46 such as precipitation, elevation and soil composition, we have found that land surface temperature, distance from stable night-light and pH of the soil may contribute to the risk of podoconiosis occurrence. The results here indicate that, although the same suite of environmental and climatic factors drive the distribution of podoconiosis in different settings, there is spatial variation in their effect and relative contribution. The interplay among podoconiosis risk, climate, environment and socioeconomic development is inevitably complex. Our analysis highlights the fact that a focus on simple, single factors fails to adequately explain the risk of podoconiosis. This study provides an analytical framework for developing podoconiosis risk model and estimating the disease burden in other potentially endemic countries. Ultimately, it will also contribute to the construction of constructing continental and global risk maps, as well as an and to estimation of the actual global burden of podoconiosis at global scale.5
In the current analysis, we have identified environmental factors associated with the risk of occurrence of podoconiosis. In addition to the factors identified in our previous model in Ethiopia, we have identified13 14 47 land surface temperature, distance to stable night-lights and pH of the soil as additional factors that drive the risk of occurrence of podoconiosis. In our previous model using data from Ethiopia, the factors that were found to be associated with the spatial distribution of podoconiosis were elevation, precipitation and EVI.13 14 47 According to our study, major drivers of podoconiosis occurrence in Cameroon appear to be soil composition and landscape characteristics (silt and clay composition of soil and slope of the land).
Our results show that podoconiosis is present in other regions of Cameroon besides the historical endemic North West region.24 Most of the areas where high prevalence of podoconiosis is documented are in the Cameroon Volcanic Line (CVL).48 The CVL is a 1600 km chain of volcanoes that extends along the border region of eastern Nigeria and includes islands such as São Tomé and Príncipe,49 and Bioko,18 which are also endemic for podoconiosis. These volcanic activities occurred over 1 million years ago,48 with subsequent weathering and generation of soils. Dense tropical forest has flourished over these rich soils for thousands of years and become highly rich in clay and silt because of the decomposition of organic matter.
Although podoconiosis was reported four decades ago in Cameroon,19 50 there has been no systematic effort to map the distribution and quantify the burden in the country. Podoconiosis services are only available in the North West region provided by a non-governmental organisation. Exposure to soil is common, as shoes are not worn regularly in rural areas of Cameroon.50 They are preserved for special occasions such as attending weddings, church ceremonies and weekly markets.51 In a survey conducted in the North West region, only a handful of interviewees reported wearing shoes during farm-related activities such as planting, harvesting and working on a rice farm.22 This is likely to have contributed to the continued presence of the disease in environmentally suitable areas. The lack of attention by national agencies and international partners, and difficulties in ensuring access to preventive methods, such as shoes,52 are listed among the major challenges for podoconiosis elimination.
This study had some limitations. First, most of the prevalence data gathered for this study came from the North West region of the country, which may have introduced geographical bias in the analysis. We mitigated the impact of this bias by generating more random background points around areas with more dense distribution of communities reporting podoconiosis cases. Furthermore, the nationwide mapping survey was designed to capture the potential variation of podoconiosis risk across the country. Thus, although sparse, surveyed communities were selected from the various ecological settings existing in the country. Second, although we accounted for the most significant environmental predictors when constructing our models, we did not include important risk factors that operate at the individual or household level, such as shoe-wearing practice and household socioeconomic status.13 15 53 We tried to minimise this limitation by including a proxy measure of poverty (night-light emissivity).37 However, the wide CIs around the estimates of prevalence and disease burden point to important risk factors, which we may not yet be taking into account. Third, the results also indicate that the unexplained variation on scale smaller than 1.2 km is the main contributor to total variation in podoconiosis prevalence. In statistical terms, this is reflected by large estimates for the variance of unstructured random effect (also known as nugget effect), which incorporates the cumulative effect of both individual and within-communities unmeasured risk factor. Finally, larger sample size would have led to more precise predication, but the sample size used was the largest we could achieve given the available resources.
This is the first comprehensive assembly of contemporary data on podoconiosis occurrence and prevalence in Cameroon. We have applied new modelling approaches to maximise the predictive power of these data.54 55 However, data on podoconiosis are scant both in space and time compared with other diseases and neglected tropical diseases, such as soil-transmitted helminth infections,56 57 malaria58 and lymphatic filariasis.59 The production of fine-resolution maps of podoconiosis is contingent on the availability of geo-referenced data. A simplified case definition of podoconiosis can be included in the integrated diseases surveillance systems in endemic countries to heighten the index of suspicion among healthcare providers.
Conclusion
The distribution of podoconiosis in Cameroon is wider than initially thought, according to our predictive models. The number of cases and population at risk are considerable in Cameroon. The findings presented here indicate the need to scale up interventions for those at risk and in need of care services. Promotion of footwear and foot hygiene through social mobilisation will be important. Morbidity management and disability prevention services should be made accessible to those suffering from the condition. The results presented here may help decision-makers to make evidence-based plans and evaluate performance.
Acknowledgments
The authors are grateful to Sarah E Ray and Nicole Weaver from Institute for Health Metrics and Evaluation, University of Washington, USA for proofreading the manuscript.
References
Footnotes
Handling editor Seye Abimbola
Contributors Conceived and designed the experiments: KD, MJN, SIH, GD and SW. Performed the experiments: KD, AJN, MEE, AAB and SW. Analysed the data: KD, JC, EG. Contributed reagents/materials/analysis tools: KD, JC, EG, FE and DMP. Wrote the first draft of the manuscript: KD. Contributed to the writing of the manuscript: JC, EG, GD, MJN, SIH, JC, AJN, MEE, AAB, DMP, RLP, AMN, FE, CJLM and SW. Agree with the manuscript’s results and conclusions: KD, JC, AJN, MEE, AAB, EG, DMP, RLP, AMN, FE, CJLM, SIH, MJN, GD and SW. All authors have read and confirmed that they meet the ICMJE criteria for authorship.
Funding This work was primarily supported by a grant from the Wellcome Trust (grant no. 201900) to KD as part of his Intermediate Fellowship in Public Health and Tropical Medicine. SIH is funded by grants from the Bill & Melinda Gates Foundation (OPP1106023, OPP1093011, OPP1132415, OPP1159934 and OPP1176062), Wellcome Trust (grant no. 209142) and Fleming Fund.
Competing interests None declared.
Patient consent Obtained.
Ethics approval The protocol used for this study received ethical approval from the Cameroon National Ethics Committee (CNEC) and Brighton and Sussex Medical School Research Governance and Ethics Committee (RGEC).
Provenance and peer review Not commissioned; externally peer reviewed.
Data sharing statement No additional data are available.