Article Text

Abstract
Introduction Internationally comparable estimates of unintended pregnancy and abortion incidence can illuminate disparities in sexual and reproductive health and autonomy. Country-specific estimates are essential to enable international comparison, and to inform country-level policy and programming.
Methods We developed a Bayesian model which jointly estimated unintended pregnancy and abortion rates using information on contraceptive needs and use, contraceptive method mix, birth rates, the proportions of births from unintended pregnancies and abortion incidence data. Main outcomes were the estimated rates of unintended pregnancy and abortion for 150 countries and territories, reported for the 5-year period 2015–2019, as annual averages per 1000 women aged 15–49 years.
Results Estimated unintended pregnancy rates ranged from 11 (80% uncertainty interval: 9 to 13) in Montenegro to 145 (131 to 159) in Uganda per 1000 women aged 15–49 years. Between-country heterogeneity was substantial in all Sustainable Development Goal (SDG) regions, but was greatest in sub-Saharan Africa. Estimated abortion rates ranged from 5 (5 to 6) in Singapore to 80 (55 to 113) in Georgia. Variation between country estimates was similar in all SDG regions except for Europe and Northern America, where estimated abortion rates were generally lower.
Conclusion The estimates reflect variation in the degree to unintended pregnancy and abortion that are experienced in countries throughout the world. This evidence highlights the importance of investing in access to contraception and comprehensive abortion care, including in regions which may have lower rates of unintended pregnancy or abortion, respectively, as countries may differ substantially from regional averages.
- public health
Data availability statement
Data are available in a public, open access repository. All data relevant to the study are included in the article or uploaded as supplemental information.
This is an open access article distributed in accordance with the Creative Commons Attribution Non Commercial (CC BY-NC 4.0) license, which permits others to distribute, remix, adapt, build upon this work non-commercially, and license their derivative works on different terms, provided the original work is properly cited, appropriate credit is given, any changes made indicated, and the use is non-commercial. See: http://creativecommons.org/licenses/by-nc/4.0/.
Statistics from Altmetric.com
Key questions
What is already known?
Unintended pregnancy and abortion rates are smaller on average in high-income countries in which legal abortion is broadly available than in high-income countries with restrictive laws as well as compared with low/middle-income countries regardless of the legal status of abortion; and some of this difference likely reflects greater access to family planning.
What are the new findings?
We analysed country-specific estimates.
The release of the first set of national estimates can support stakeholders in comparing outcomes in their countries with other country contexts.
What do the new findings imply?
Whereas earlier studies highlighted average differences between high-resource and low-resource settings, this new evidence suggests that barriers to accessing sexual and reproductive healthcare exist in settings with greater as well as fewer resources.
Introduction
Internationally comparable estimates of unintended pregnancy and abortion incidence can illuminate disparities in sexual and reproductive health and autonomy.1 Regional average model-based estimates have made global comparisons over time possible.2–8 However, these studies have not provided the country-specific estimates that would allow country stakeholders to understand their own sexual and reproductive health context and to compare with other countries which may differ in policies and other factors which influence individuals’ ability to access care.1 This limits our understanding of these widespread phenomena which can substantially affect patterns of fertility and family formation.
Gaps in the evidence base pose substantial challenges for developing abortion estimates for most countries. Abortion is highly restricted in a large number of countries, and many countries where abortion is broadly legal lack robust systems for collecting abortion data.7–10 Self-reports of abortions are conservatively biased, which has necessitated the development of indirect approaches to estimate abortion incidence in settings which lack robust data collection systems. The most widely used approach entails combining information from health facilities on the number of complications from unsafe abortions with information on the proportion of abortions likely to result in a complication treated in a facility in that country; other information is incorporated in settings where legal abortion is also available.11–13 A substantial number of in-country studies have been undertaken since the 1990s to fill in gaps in the evidence base, including in 28 countries in Africa, Asia and Latin America.13–15 However, comparing cross-sectional studies is complicated as evidence may date to different time periods and because of methodological differences between studies. Also, different regions have seen investment in abortion data collection at different points in time. In sub-Saharan Africa, for example, the most recent nationally representative study estimated abortion incidence in Ghana for 2017. In Latin America, by contrast, the most recent such study estimated the number of abortions which occurred in Mexico in 2009.16
Most abortions follow from pregnancies which were unwanted at the time they were conceived or occurred earlier than desired. In demography and public health, these pregnancies are typically referred as those that were unintended. Since most abortions follow from these, unintended pregnancy estimates are needed to contextualise differences in abortion rates across countries. Unfortunately, many countries, including high-income countries, also lack data on the proportions of births from unintended pregnancies.
We developed a model-based approach to estimate unintended pregnancy and abortion incidence, to enable country comparison and for global reporting in light of data limitations. Several studies have used model-based approaches to develop country-specific estimates of reproductive health indicators including maternal mortality and demand satisfied for modern methods of contraception.17–20 Our approach uses country-specific evidence on unintended pregnancy and abortion in concert with other data on contraceptive needs and use (ie, the proportions of women who do not want to become pregnant and whether they are using contraception), pregnancy intentions and births, to make it feasible to produce estimates accounting for data limitations.8 15 We developed a model-based approach from which regional averages were previously reported,8 and in this paper, we report country-specific estimates.
Methods
We published our analytical strategy in an open-access study protocol to permit full transparency.21 Additionally, a complete description of the model used to produce the country estimates discussed in this paper is available in a technical paper.15 However, we provide a general summary of our methodology below, to aid in interpreting the estimates in this manuscript.
Data compilation and classification
Data on abortion incidence and the share of births from unintended pregnancies (hereafter, intention data) were compiled from official statistics, country-based surveys and from one-time studies found through a literature search (pp. 3–4). For published studies, we searched PubMed and Google Scholar from May 2018 to May 2019. Our search terms were “unplanned birth”, “unintended pregnancy”, “unwanted pregnancy”, “unplanned pregnancy”, “pregnancy intention”, “unintended births”, “unwanted birth”, “abortion incidence”, “abortion estimates”, “termination of pregnancy”, “induced abortion” and “menstrual regulation”, followed by, one by one, the name of each country.
Though this manuscript reports estimates for 2015–2019, we included data from all 5-year time periods 1990–1994 through 2015–2019. This is because information about the past can inform estimates of the present, as we will discuss later, and this model was also used to estimate regional average time trends reported in a previous study.8
Country-nominated focal point(s) had the opportunity to provide feedback and additional data through a WHO country consultation process. However, this does not imply that the countries have endorsed the estimates and countries may choose to use their own data to inform national programmes and policies; country data may differ from our estimates as they are model based and because data sources were standardised to allow for international comparison.
We used a data classification process described in the study protocol21 designed to ensure consistency in how the model-based estimates incorporated information on data sparsity and quality (pp. 4–6). We followed the Guidelines for Accurate and Transparent Health Estimates Reporting statement in developing the database, analysis and presentation of the study (online supplemental appendix B). The abortion data used in this study are found in the Global Abortion Incidence Dataset.22 Data on all outcomes input into our model are found in online supplemental appendix C, and how these data differ from the modelled estimates for each country are graphed in online supplemental appendix D.
Supplemental material
Supplemental material
Intention data classification
For the data on pregnancy and birth intention (hereafter, intention data), estimates of the per cent of births unintended were treated as point estimates, whereas information on the per cent of pregnancies unintended was treated as minimum estimates due to abortion under-reporting.
Where micro-data were available, we computed estimates from births occurring within the year preceding interview to minimise response bias. Published estimates may use various recall periods—the most common were Demographic and Health Surveys (DHS) and Reproductive Health Surveys reports, which pooled data pertaining to children who were up to 3 or 5 years old. For studies that lacked information referring to the year prior to the survey, a bias term was included. This bias term was estimated using the public-use DHS micro-data (pp. 4 and 15).
Some studies employed the London Measure of Unplanned Pregnancy, which, in contrast to the (un)intended dichotomy, classifies pregnancies as unwanted, ambivalent or planned using a 12-item psychometric scale. We entered these as range estimates, since the proportion unintended included those which were unwanted—and so is at least this much—as well as an unknown proportion of ambivalent—and so is no greater than the sum of those two categories (pp. 4 and 16).
Abortion data classification
Published studies
For abortion estimates from published studies using indirect methods, we input the study’s estimated number of abortions from the direct component (eg, the number of complications from illegal abortions treated in hospitals) and the indirect component (eg, the per cent of all abortions that this represented), to allow for larger error in the indirect component (supplement p. 17). A few studies collected data from health facilities from which they estimated the number of treated complications from unsafe abortions, and multiplied this by a number which was not based on in-country data collection—for example, the first abortion incidence study in sub-Saharan Africa divided the complications by the proportion of abortions resulting in treated complications in a Latin American country. In those cases, we ignore the published estimate, entering the estimated number of complications as a minimum estimate of the true abortion incidence. Additional error was modelled if a study was non-representative, except for studies of capital cities in sub-Saharan Africa; these were treated as maximum estimates of the national rate because otherwise similar nationally representative studies in this region have consistently found abortion rates to be higher in cities (pp. 4, 6 and 17).
Surveys of women
As with previous abortion incidence estimates, data from surveys of all women of reproductive age were treated as minimum-only estimates, except for Central Europe, Eastern Europe, Central Asia and the Caucasus, where sufficient information comparing estimates based on surveys of women with reliable official statistics was available. Per the protocol, we computed a bias term using a multilevel model: this indicated that approximately two-thirds of abortions were reported in surveys of women in these regions, the same figure used in previous approaches,7 and modelled additional uncertainty associated with this adjustment (p. 17).
Official statistics
Due to issues around abortion under-reporting, official abortion statistics have historically been assessed for completeness. Thus, data from official statistics were reviewed—for whether legal abortion was not broadly available, whether the government acknowledged that its statistics were incomplete, whether the official statistics were below an estimate from a survey of women, whether a sizeable portion of abortions occurred outside the formal health sector and whether implausible trends implied a country’s data were incomplete—to ascertain when data should be treated as point or minimum estimates (pp. 4–6 and 16).
Data availability
We obtained data from 166 countries (table 1, column a), somewhat fewer than half of which (75; column c) had reliable abortion data (ie, data which were treated as point estimates). Three-quarters of reproductive-aged women lived in these 75 countries, reflecting that reliable abortion data were more likely to be found in larger countries. We also obtained data on the proportion of births unintended from 139 countries, such that overall, 150 countries—in which 95% of the population of reproductive-aged women live—had reliable data on either/both outcomes (column b).
Summary of data availability, globally and for Sustainable Development Goal regions
The availability of reliable abortion data varied substantially by region, ranging from 12% of countries in Western Asia and Northern Africa to 73% of countries in Europe and Northern America. Data availability also varied over time. In Latin America, for example, reliable abortion data were available for 37% of countries in one or more years 1990–2019. Excluding data from 1990 to 2009, however, this reduces to 11% of countries in 2010–2019 for that region.
When considering the availability of reliable abortion or intention data, we found considerably less variability across regions, as well as over time. Excepting the regions of Western Asia and Northern Africa, and the Oceania region, the proportion of countries with reliable data in one or more years ranged from 76% in Eastern and Southeastern Asia, as well as in Latin America, to 93% of countries in Central and Southern Asia. The proportions of countries with reliable data in these same regions in 2010–2019 were 65%, 58% and 79%. Differences in the availability of reliable data on these related outcomes—birth intendedness and abortion—therefore informed our modelling strategy.
Modelling strategy
To jointly estimate unintended pregnancy and abortion incidence, we developed a theoretical framework in which the rate of pregnancy ω and the propensity for a pregnancy to end in abortion α varied across population subgroups f delineated by marital status, contraceptive needs and use (figure 1). Estimates of the number of women  in each population subgroup were provided by the United Nations Population Division, and the modelled parameters were the subgroup-specific rates
  and propensities
  . With this set-up, the total number of abortions is the sum of abortions across all population groups:
  . To estimate the incidence of unintended pregnancy, pregnancies are summed among the relevant subgroups of women; that is, reflecting their pregnancy desires (pp. 8–9).
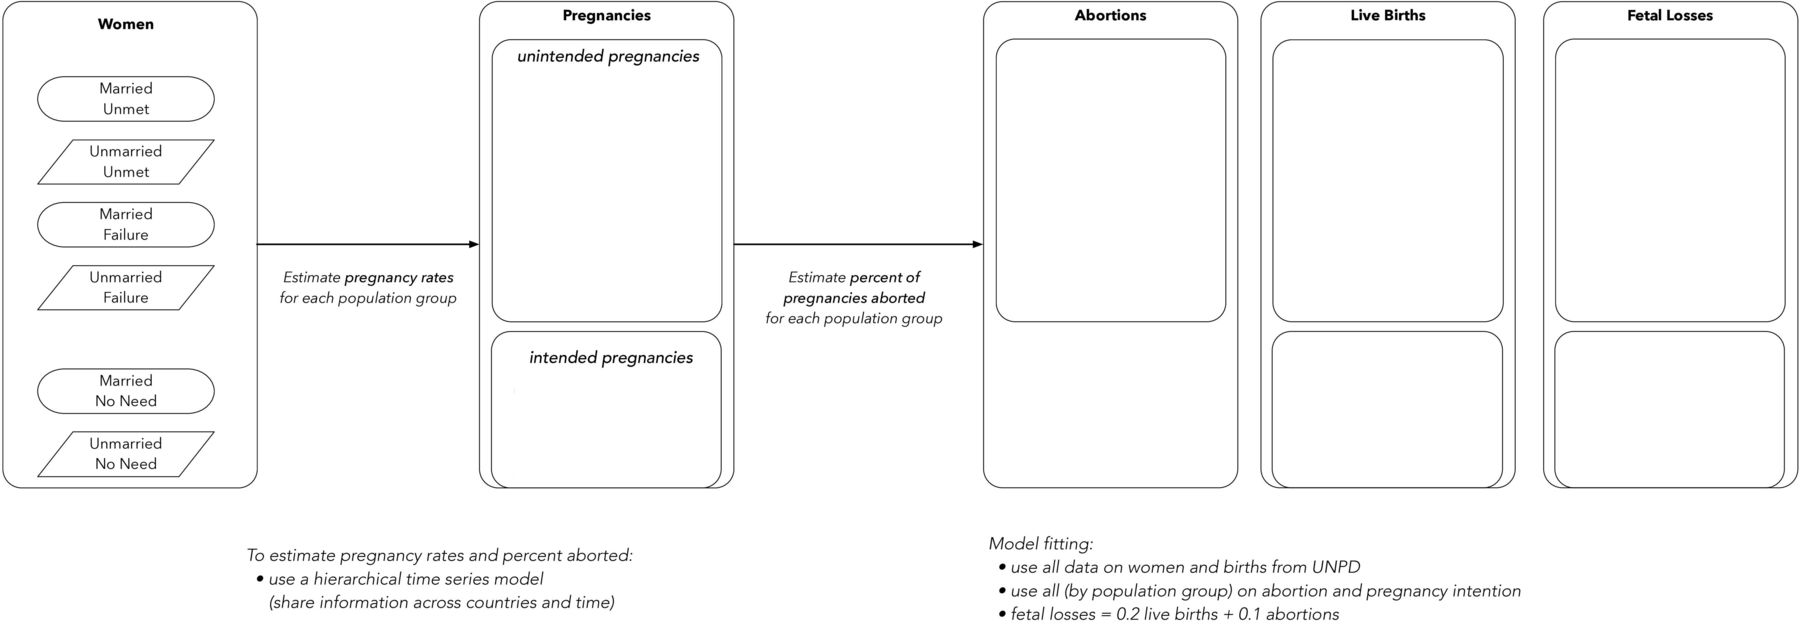
Process model (adapted from the study protocol21).
Pregnancy outcomes in addition to abortions include live births and fetal losses (miscarriages and stillbirths). To model birth rates from pregnancy rates and proportions aborted, consistent with earlier work, we estimated fetal losses using an approach derived from life tables of pregnancy loss by gestational age, and assume a fetal loss for every 5 births and, additionally, for every 10 abortions.23–25 Proportions unintended were estimated by summing the modelled numbers of births among the relevant population groups and dividing by the total number of births (p. 15).
As illustrated in figure 1, differences across countries and periods in rates of unintended pregnancy reflect differences in the subgroup-specific rates and the proportion of women in each group. Hypothetically, if one had perfect information on the predictors of unintended pregnancy, birth rates and the proportions of births unintended, then, abortion incidence could be estimated through simple calculus.
However, in reality, it is necessary to estimate the subgroup rates and propensities and allow them to vary between countries and time periods. This is because differences across countries and over time in fecundity as well as the timing and frequency of sexual activity can influence the subgroup-specific pregnancy rates. Likewise, the subgroup-specific proportions of pregnancies ending in abortion may vary according to differences in women’s motivation to avoid an unintended birth, social and personal stigma, and concrete obstacles to abortion access. For these reasons, parameters were estimated for every country c, time period t and population subgroup f.
To allow for similarities between groups of countries in the relationships between the predictors and outcomes and exchange information across countries and periods, we used Bayesian hierarchical time series models. Countries were grouped (online supplemental appendix table A1) so that parameters were modelled around means within each subcluster of countries. Subcluster parameters, in turn, were centred around cluster means, and these were centred around global means.
Temporal correlations in the parameters were modelled using hierarchical random walks (pp. 10–14). This means that differences between time periods in country-specific parameters were centred around subcluster means, separately for each subgroup. Subcluster average trends, in turn, were centred around cluster average trends, also modelled for each subgroup-specific parameter.
Our modelling approach resulted in point estimates that combined information directly from the data for the respective country–periods with information from other periods and countries. Uncertainty intervals (UIs) accounted for the quantity and quality of all available data, as well as the unexplained heterogeneity across countries and periods.
To validate our model-based estimates, we performed several exercises. These included deleting one-fifth of all observations within each data class at random (pp. 20–21) as well as a country jackknife (separately for each of the 166 countries with data, estimating the model leaving out the country’s data) (pp. 22–23). We computed median error, median relative error, median absolute error and median absolute relative error, as well as the proportion of left-out observations/countries whose estimates fell outside the prediction intervals, and examined averages across all left-out observations (or countries) for each cluster and class of data (pp. 24 and 26). The results were consistent with our model producing statistically unbiased estimates with well-calibrated UIs.
Reported estimates
We used a Markov Change Monte Carlo algorithm, implemented using JAGS V.4.3.0,26 to generate samples of the posterior distributions of all model parameters, and we carried out our analysis using R V.4.1.0.27 Point estimates are medians from the posterior distributions, and UIs were computed using the percentile method.
We examine the certainty with which comparisons can be made by examining posterior probabilities of differences. We avoid the dichotomisation of statistical significance28 ; however, we embedded heat maps in online supplemental appendix tables A3–A5 which illustrate the certainty with which comparisons can be made. Additionally, plots and tables report 80% and 95% UIs, and 80% intervals are shown within parentheses.
Although we obtained data from 166 countries, we report results for 150. This is because of reliable abortion data were unavailable in the Middle East and Northern Africa (online supplemental table A2).
Results
Unintended pregnancy
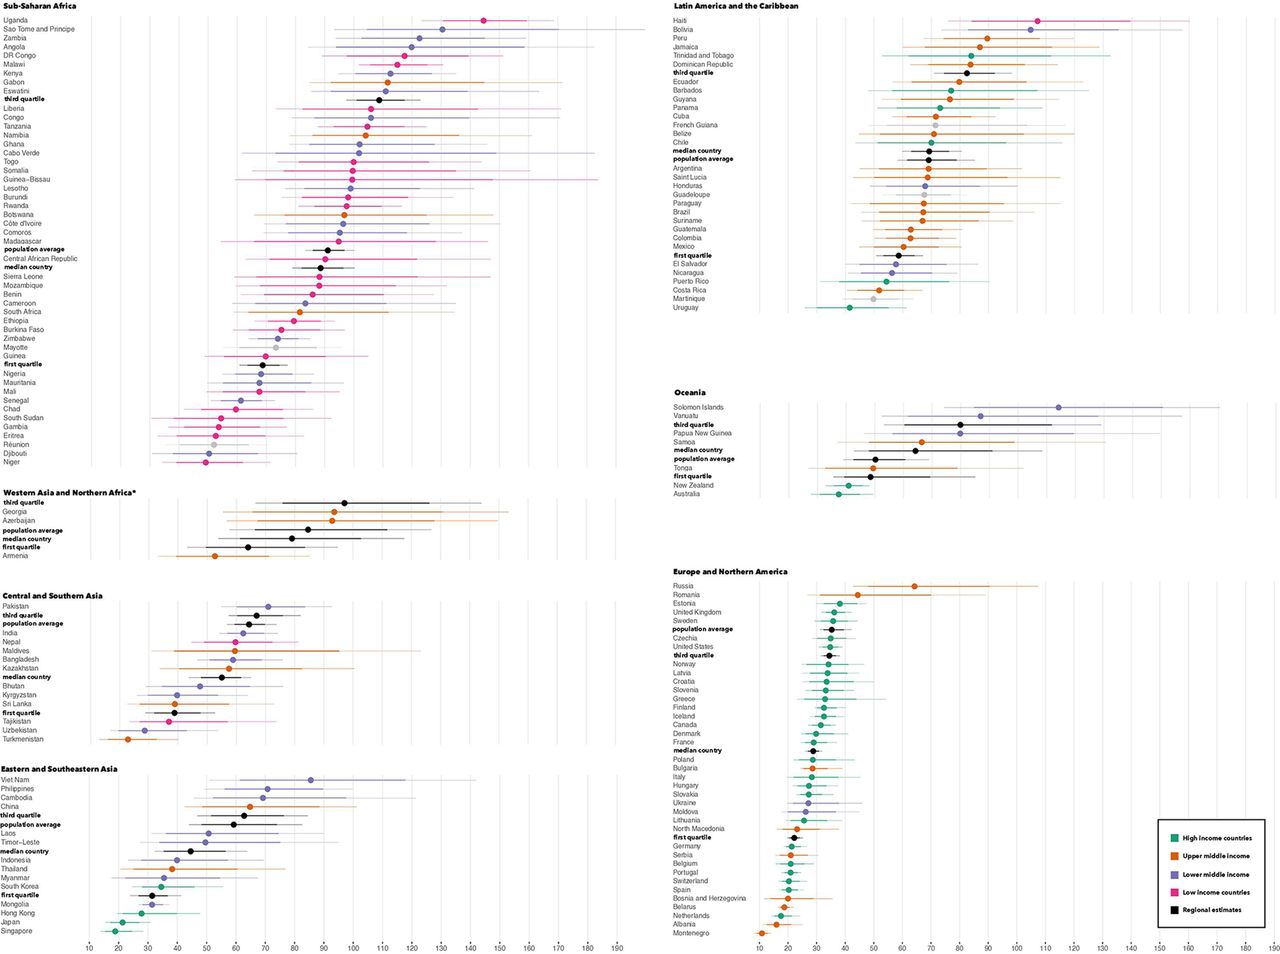
Existing studies have highlighted differences in regional average unintended pregnancy rates, and this has obscured important differences between countries. Substantial heterogeneity was found within all regions, with the largest differences found in sub-Saharan Africa—where we estimated a rate of 49 (39 to 62) in Niger and 145 (131 to 159) in Uganda (figure 2).

Model-estimated unintended pregnancy rates sorted within Sustainable Development Goal (SDG) regions, annually per 1000 women aged 15–49 years in 2015–2019. Thicker and thinner lines are 80% and 95% uncertainty intervals. Northern America is an SDG region and contrasts with North America, with Mexico in Latin America and the Caribbean. Countries shown in grey were not grouped by the World Bank. *Regional averages were computed from 195 countries and territories; countries in Western Asia and North Africa are shown only if clustered with Eastern Europe.
As the strength of the evidence base underlying these estimates can vary substantially between countries, it is further important to consider, in addition to the magnitude of heterogeneity between point estimates, the degree of certainty with which countries are estimated to be above or below average. In sub-Saharan Africa, there is an absence of reliable official statistics on abortion. Yet, we found 16 countries in sub-Saharan Africa whose unintended pregnancy rates exceeded, or fell below, the regional average with 99% or greater certainty (online supplemental table A2). In Europe and Northern America, 13 countries met this threshold of exceeding or falling below the regional average with 99% of greater certainty, even though reliable official statistics on abortion are the norm in the region. These correspond to one-third of the countries in either region. This speaks to the strength of our joint estimation approach, as whereas sub-Saharan Africa, Latin America and Asia have less reliable abortion data compared with Europe and Northern America, countries in these regions are more likely to have birth intention data from multiple surveys conducted at regular intervals.
We also found regions in which population average estimates—averages across countries weighted by the number of reproductive-aged women—differs substantially from the unweighted median. In Europe and Northern America, 35 (32 to 40) unintended pregnancies occurred per 1000 reproductive-aged women, but the unweighted median unintended pregnancy rate was 29 (27 to 31). As, moreover, the third quartile was 34 (32 to 37), this means that the population-average estimate for this region falls outside its IQR. In Eastern and Southeastern Asia, and in Central and Southern Asia, we likewise found that the population average was closer to the third quartile than the unweighted median. Across these three regions, the probability that the median and population average estimates differ ranged from 94% to more than 99%. This reflects a pattern of above-average rates found in larger countries such as China, Russia and the USA.
Differences between regional averages have also obscured the extent to which regions share similarities. While unintended pregnancy rates were on average greatest in sub-Saharan Africa compared with the other regions, we also found countries in every region except Europe and Northern America—where estimates ranged from 11 (9 to 13) in Montenegro to 64 (48 to 90) in Russia—whose rates fell within sub-Saharan Africa’s IQR. More than in other regions, such countries were found in Latin America, where rates ranged from 41 in Uruguay (30 to 55) to 107 in Haiti (84 to 139).
Averages have also obscured how unintended pregnancy rates vary between country income groups. In general, unintended pregnancy rates are greatest among women who live in lower-income countries, and smallest among women who live in higher-income countries. However, the smaller average unintended pregnancy rate among high-income countries largely reflects lower unintended pregnancy rates in Europe and Northern America. Most high-income countries lie within this region. Within Europe and Northern America, certainly, the two greatest estimates were from upper middle-income countries—Russia and Romania. However, all other above-average estimates in this region came from high-income countries. Moreover, the two smallest estimates were also from upper middle-income countries—Albania and Montenegro. Within Latin America, likewise, we observed high-income countries both above and below the median. Only in Eastern and Southeastern Asia did all the below-average estimates come from high-income countries—South Korea, Japan and Singapore.
Abortion
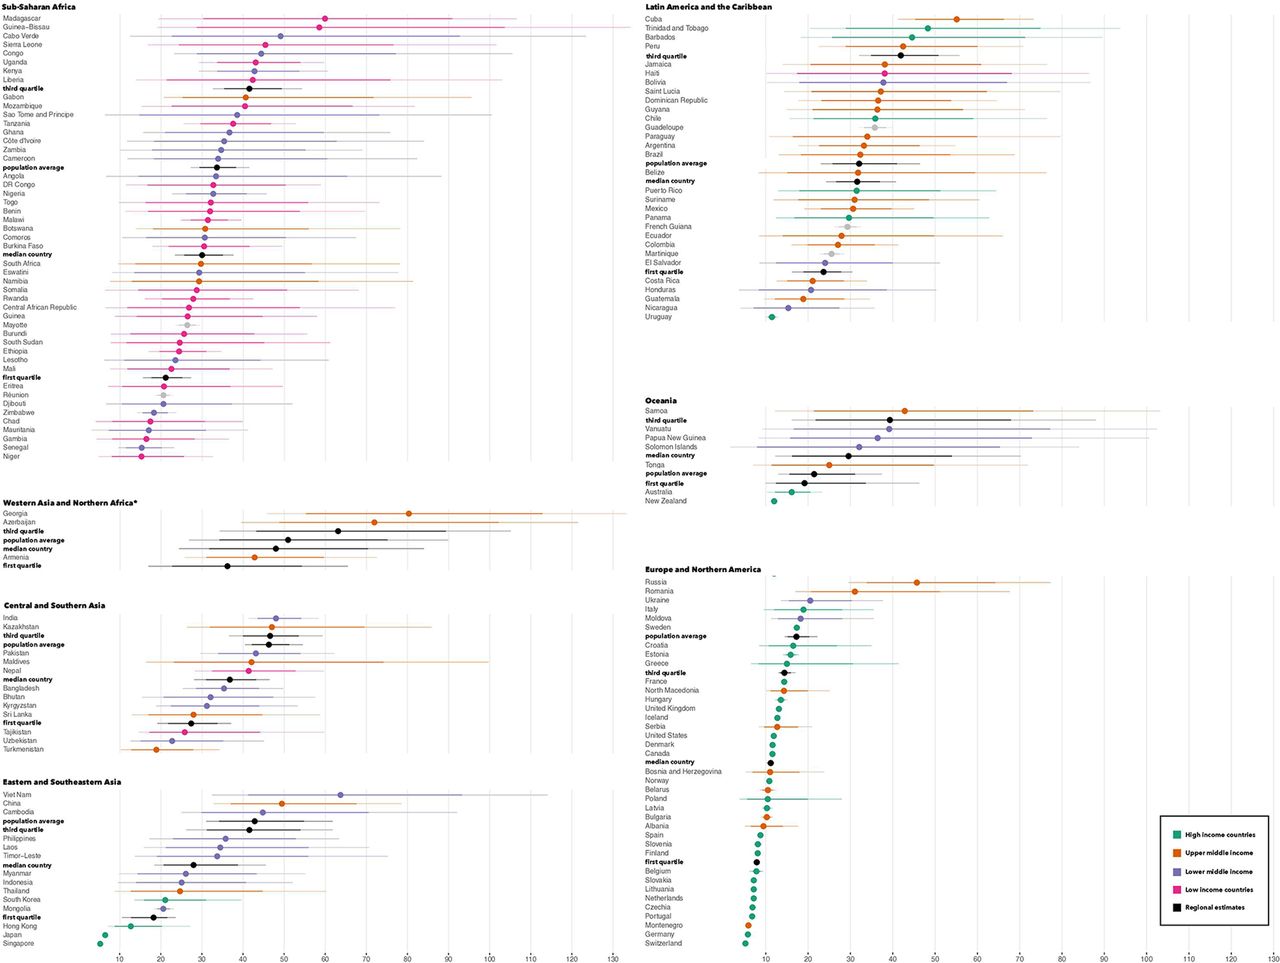
In general, whereas we found substantial differences within and between regions in their unintended pregnancy rates, heterogeneity in abortion rates was found more so within than between regions. As figure 3 shows, the distributions of estimates by region exhibit substantial overlap, with the exception of Europe and Northern America. This was because although unintended pregnancy rates were greater in Latin America and sub-Saharan Africa compared with other regions, the proportions of unintended pregnancies ending in abortion were generally lower in these regions and in Europe and Northern America compared with the regions of Asia (online supplemental table A4).

Model-estimated unintended abortion rates sorted within Sustainable Development Goal (SDG) regions, annually per 1000 women aged 15–49 years in 2015–2019. Thicker and thinner lines are 80% and 95% uncertainty intervals. Northern America is an SDG region and contrasts with North America, with Mexico in Latin America and the Caribbean. Countries shown in grey were not grouped by the World Bank. *Regional averages were computed from 195 countries and territories; countries in Western Asia and North Africa are shown only if clustered with Eastern Europe.
Regional average rates are lowest in Europe and Northern America—this being a region in which the unintended pregnancy and abortion rates were both lower than average—but this understates the degree to which Europe and Northern America contrast with other regions. On average, 17 (15 to 20) abortions occurred per 1000 reproductive-aged women in Europe and Northern America, in contrast to 32 (26 to 41) in Latin America, for example. However, whereas the unweighted median in Latin America was also 32 (27 to 37), it was 11 (11 to 12) in Europe and Northern America. Of the countries in this region, we found 22 which fell below the regional average with 99% or greater certainty, and only one, Russia, which fell above the regional average at this certainty threshold (online supplemental table A5).
In other regions, the median estimated rates ranged from 28 (21 to 39) in Eastern and Southeastern Asia to 37 (31 to 43) in Central and Southern Asia. This is excepting Western Asia and North Africa, where the evidence base was weaker than all other regions (table 1 and online supplemental table A1).
Among the greatest average abortion rates were those found in Eastern and Southeastern Asia, with 43 (34 to 55) abortions per 1000 reproductive-aged women per year. However, the unweighted median for this region was no greater than any except for Europe and Northern America. This reflected above-average estimates found in Vietnam (64 (41 to 93)), China (49 (37 to 68)) and Cambodia (45 (30 to 71))—all estimated to be above average with 96%–98% certainty—which comprised most of the region’s population.
Considering that we found more heterogeneity among countries than when comparing regional averages in most regions, strengthening the evidence base is particularly important for understanding differences between countries in abortion incidence. Despite the general lack of reliable official statistics in most regions, however, our model estimated countries with rates above or below the average for their region with 90% or greater certainty in all regions—including 11 countries in sub-Saharan Africa, 7 in Latin America and the Caribbean, and 6 in Central and Southern Asia.
Discussion
We found substantial differences in the unintended pregnancy rates estimated across countries, which suggests inequality between countries in the extent to which individuals have been able to achieve their reproductive goals. Whereas earlier research has suggested that substantial regional disparities exist in individuals’ ability to exercise reproductive autonomy,4 6 8 29 our findings further elucidate variation across countries in all regions.
Although unintended pregnancy is more common in lower-resource settings, we found high-income countries whose rates were above average for their regions. Complementing the comparisons found in earlier studies,4 6–9 29 which have highlighted average differences by region or by income group, this suggests that barriers to accessing and using effective sexual and reproductive healthcare exist in settings with greater as well as fewer resources.
Among the reasons that this is important is that estimates can help target investment to where it is most needed. That in-country studies have been conducted in sub-Saharan Africa in the 2000s and 2010s, but recent evidence in Latin America is lacking, for example, could relate in part to inference from regional studies about where investment is most needed. Although unintended pregnancy rates were generally greater in sub-Saharan Africa, we found that all regions except Europe and Northern America had countries whose rates fell within sub-Saharan Africa’s IQR.
Moreover, when examining abortion rates, all regions except for Europe and Northern America had similar distributions of country estimates. This emphasises the importance of investment in quality abortion and post-abortion care including in countries whose regions may have lower rates of abortion as countries may differ substantially from regional averages.
Limitations
A dichotomous measure of pregnancy intentions may not fully capture individuals’ feelings about their pregnancies. However, questions designed to measure this construct have been asked in hundreds of nationally representative surveys fielded regularly for decades in dozens of countries, and our use of this measure enables international comparison. To address the potential for response bias, we used a 1-year recall period, modelled bias terms when this was not possible and refrained from subcategorising unintended births into those which were conceived when no more children were desired and those which were conceived sooner than desired. Our estimates may still be conservative, and to address the potential for this to vary by country, we modelled non-sampling error for these data. Additionally, we note that while unintended pregnancies are useful for contextualising abortions, these may also occur following intended pregnancies.
Limited data resulted in sizeable UIs around the unintended pregnancy and abortion incidence estimates for several countries and it is important to consider these, and the posterior probabilities of differences, when interpreting the estimates. We also note that while the variation we found suggests inequality in the ability to determine whether and when to have children, the ability to have children when one desires is one among several aspects of reproductive autonomy.
Conclusion
Estimates can help inform global and national health priorities such as by helping to target investment. For unintended pregnancy and abortion, country estimates have been needed to better inform resource allocations for policy and programming in supporting access to sexual and reproductive health services. Addressing this, our model-based estimates make it possible to examine disparities between countries. Our findings illustrate inequality in reproductive autonomy far more thoroughly and with greater nuance than has been possible with the extant literature, which has tended to analyse a single country, or to compare averages among large groups of countries. With additional investments in in-country data collection, it would be possible to make estimates with greater certainty, monitor trends and possibly assess the impact of large-scale programmes in the future.
Data availability statement
Data are available in a public, open access repository. All data relevant to the study are included in the article or uploaded as supplemental information.
Ethics statements
Patient consent for publication
Ethics approval
This study does not involve human participants.
References
Footnotes
Handling editor Seye Abimbola
Twitter @jonathanbearak, @annapopinchalk, @CynthiaBeavin, @bganatra, @otuncalp, @LeontineAlkema
Contributors JMB and LA contributed to the conceptualisation of the estimation approach. JMB developed the statistical model and conducted the data analysis with input from LA and AP. AP led data compilation and data management, with significant contributions from CB. BG, OT and A-BM led the country consultation. JMB drafted the manuscript. All coauthors convened periodically for technical exchanges about the estimation approach. The authors alone are responsible for the views expressed in this article, and they do not necessarily represent the views, decisions, or policies of the institutions with which they are affiliated. The country consultation conducted as part of the methodology does not imply country endorsement and countries may choose to use their own data to inform national programmes and policies. JMB had full access to all the data in the study, and had final responsibility for the decision to submit for publication.
Funding UK Aid from the UK Government; Dutch Ministry of Foreign Affairs; UNDP/UNFPA/UNICEF/WHO/World Bank Special Programme of Research, Development and Research Training in Human Reproduction (HRP); the Bill & Melinda Gates Foundation INV-00844.
Disclaimer The funders of the study had no role in study design, data collection, data interpretation, analysis or the writing of the article. The corresponding author had full access to all the data in the study, and had final responsibility for the decision to submit for publication.
Competing interests None declared.
Provenance and peer review Not commissioned; externally peer reviewed.
Supplemental material This content has been supplied by the author(s). It has not been vetted by BMJ Publishing Group Limited (BMJ) and may not have been peer-reviewed. Any opinions or recommendations discussed are solely those of the author(s) and are not endorsed by BMJ. BMJ disclaims all liability and responsibility arising from any reliance placed on the content. Where the content includes any translated material, BMJ does not warrant the accuracy and reliability of the translations (including but not limited to local regulations, clinical guidelines, terminology, drug names and drug dosages), and is not responsible for any error and/or omissions arising from translation and adaptation or otherwise.