Article Text

Abstract
Background When randomisation is not possible, interrupted time series (ITS) design has increasingly been advocated as a more robust design to evaluating health system quality improvement (QI) interventions given its ability to control for common biases in healthcare QI. However, there is a potential risk of producing misleading results when this rather robust design is not used appropriately. We performed a methodological systematic review of the literature to investigate the extent to which the use of ITS has followed best practice standards and recommendations in the evaluation of QI interventions.
Methods We searched multiple databases from inception to June 2018 to identify QI intervention studies that were evaluated using ITS. There was no restriction on date, language and participants. Data were synthesised narratively using appropriate descriptive statistics. The risk of bias for ITS studies was assessed using the Cochrane Effective Practice and Organisation of Care standard criteria. The systematic review protocol was registered in PROSPERO (registration number: CRD42018094427).
Results Of 4061 potential studies and 2028 unique records screened for inclusion, 120 eligible studies assessed eight QI strategies and were from 25 countries. Most studies were published since 2010 (86.7%), reported data using monthly interval (71.4%), used ITS without a control (81%) and modelled data using segmented regression (62.5%). Autocorrelation was considered in 55% of studies, seasonality in 20.8% and non-stationarity in 8.3%. Only 49.2% of studies specified the ITS impact model. The risk of bias was high or very high in 72.5% of included studies and did not change significantly over time.
Conclusions The use of ITS in the evaluation of health system QI interventions has increased considerably over the past decade. However, variations in methodological considerations and reporting of ITS in QI remain a concern, warranting a need to develop and reinforce formal reporting guidelines to improve its application in the evaluation of health system QI interventions.
- health systems
- systematic review
This is an open access article distributed in accordance with the Creative Commons Attribution Non Commercial (CC BY-NC 4.0) license, which permits others to distribute, remix, adapt, build upon this work non-commercially, and license their derivative works on different terms, provided the original work is properly cited, appropriate credit is given, any changes made indicated, and the use is non-commercial. See: http://creativecommons.org/licenses/by-nc/4.0/.
Statistics from Altmetric.com
Key questions
What is already known?
Interrupted time series (ITS) is one of the strongest quasi-experimental designs.
ITS has increasingly been advocated for use in the evaluation of health system quality improvement (QI) interventions when randomisation is not possible.
What are the new findings?
Our findings showed variations in methodological considerations and reporting of ITS in QI—for example, only about half of studies specified the ITS impact model and considered autocorrelation in the ITS analyses.
The risk of bias was high or very high in about three-quarters of included studies and did not appear to have changed significantly over time.
What do the new findings imply?
While use of ITS in the evaluation of health system QI interventions has increased considerably over the past decade, the quality of ITS studies still shows room for improvement.
Developing and/or reinforcing formal reporting guidelines could improve application of ITS in the evaluation of health system QI interventions.
Introduction
Improving health system quality is vital to ensure that utilisation of healthcare maximises population health outcomes, economic benefit and people’s confidence in health systems.1–3 A key strategy to improving the quality of care is the use of context-appropriate health system quality improvement (QI) interventions. QI interventions employ different approaches targeting patients or users (eg, education of patients and promotion of self-management), healthcare providers (eg, clinical education and reminders) and health systems (eg, organisational change and electronic patient registry) to bolster quality of care.4 5 While evaluating these interventions is key to understanding their impact, many are designed and implemented without predetermined evaluation plans.6–9 In such cases, rigorous quasi-experimental designs can be employed.10–13
Concerns persist, however, about the potential biases in some weaker observational study designs.10 11 As a result, interrupted time series (ITS) analysis has increasingly been advocated as one of the more robust observational designs as it can control for the secular trends present in many health system outcomes.7 8 14 Additionally, ITS can easily be interpreted by lay audiences, especially when graphical displays of the results are employed. Similarly, the Cochrane Effective Practice and Organisation of Care (EPOC) recommends ITS along with experiments and controlled before and after designs for inclusion in EPOC reviews.15 There remains a risk, however, of producing misleading or incorrect results when this rather robust design is not used appropriately.16–18
While use of ITS in health research has increased substantially over the last few decades (online supplemental appendix figure 1), previous systematic reviews have shown heterogeneity in the reporting and methodological concerns in the application of ITS.17 19–21 However, none of these reviews have focused on use of ITS in the evaluation of health system QI interventions.17 19 20 Another review examined characteristics and reporting of ITS in healthcare more broadly.21 However, this review was restricted to just 1 year (ie, 2015) and one database and excluded controlled ITS studies.21 Similarly, they did not assess the risk of bias of included studies. Therefore, the extent to which the use of ITS has followed best practice standards and recommendations in the evaluation of health system QI interventions remains unclear.
Supplemental material
Methodological considerations with interrupted time series
The ITS design relies on data collected at multiple intervals over time (ie, time series data) before and after an intervention to establish a causal relationship between an intervention (eg, QI) and an outcome of interest (eg, health outcomes).22 The Cochrane EPOC recommends ITS studies with at least three data points before and after an intervention for inclusion in its reviews.15 ITS can be either retrospective or prospective, and can further be classified into two types based on whether one group was used (single ITS) or a control group was added (controlled ITS).10 22 Single ITS (SITS) compares longitudinal changes before and after the intervention in the exposed group, whereas controlled ITS (CITS) compares longitudinal changes before and after the intervention between an exposed group and a control group (figures 1 and 2).7 18 22–25

Diagrammatic representation of single interrupted time series.

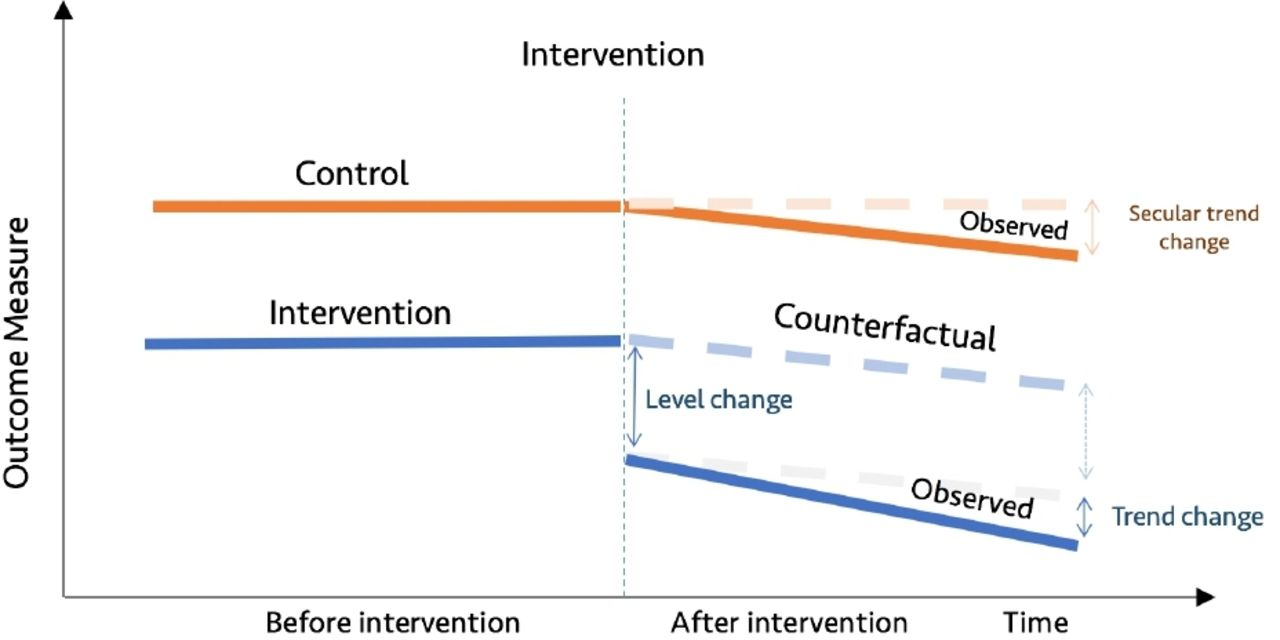
Diagrammatic representation of controlled interrupted time series.
Single ITS assumes that level and trend in a given outcome measure in the group exposed to the intervention would have remained the same absent the intervention (figure 1). In contrast, the counterfactual assumption for controlled ITS is that the level and trend in the group exposed to the intervention would have changed in the same way as was observed in the control group (figure 2).7 18 22–25 It is recommended to specify anticipated changes in the level or trend in outcome measures a priori, for example, based on expert knowledge.17 26 27 Graphical figures of results of ITS studies are vital as they allow readers to see pre-existing levels and trends, the implementation of the intervention and the impact of the intervention.18 20 28
CITS is arguably a stronger quasi-experimental design as it has two controls (baseline trend in the intervention group and control group), allowing both within-group and between-group comparisons.10 This enhances its capacity to control for potential threats to internal validity such as history (co-intervention), maturation, instrumentation, regression to the mean and attrition.10 18 22 24 29 However, SITS may be more vulnerable to these threats to internal validity. For example, Baicker and Svoronos recently reanalysed data from the Oregon Health Insurance experiment using SITS and found results that were not consistent with the randomised trial findings.30 Therefore, it is generally recommended to add a control group to ITS wherever possible.10 22 Bernal and colleagues’ study reviewed various types of controls that can be added to strengthen ITS design, including location and characteristic-based controls and control outcome.24 When QI interventions are multisite and implemented at different times, this needs to be taken into account when assigning index time to a control group using techniques such as matching and random assignment of index time to controls.
Statistical analysis of interrupted time series
While there are many statistical approaches used for estimating effects of interventions in ITS studies, segmented regression analysis of ITS is the most commonly used, followed by autoregressive integrated moving average (ARIMA) models.16 20 21 Details on segmented regression analysis can be found in the seminal paper of Wagner and colleagues.18 While most ITS studies use segmented regression analysis on time series data aggregated within periods of time, analysis on individual-level data is feasible using mixed effects models. Saeed and colleagues discuss how to combine generalised mixed effects models with segmented regression to evaluate the effectiveness of healthcare interventions.31 Similarly, Ewusie suggests incorporating patient variability and sample size as weights in a weighted segmented regression model of ITS to account for potential heterogeneity introduced by population variability within and/or between sites.16 Power in ITS depends on several factors, including the number and distribution of data points before and after the intervention, the stability of data points, strength of effect, autocorrelation and seasonality.26 32 Missing observations are common in time series data of health service utilisation and quality of care and should be dealt with using appropriate techniques such as multiple imputation and maximum likelihood estimation.25 33–35
As successive time series observations may be correlated, it is recommended to assess for autocorrelation using appropriate modelling techniques.18 There are several tests for assessing autocorrelation including Durbin-Watson tests and visual plots of the autocorrelation function and partial autocorrelation function.18 36 Moreover, seasonality is common in time series data and should be adjusted for as appropriate. There are several techniques for adjusting for seasonality in time series analyses, including deseasonalising time series data prior to fitting statistical models, adding dummy calendar variable (eg, calendar month), using Fourier terms (pairs of sine and cosine functions) and splines.26 37 When using monthly time series data, at least 12 data points before and after the intervention are recommended to be able to adjust for seasonality meaningfully.18 Additionally, non-stationarity—a time series exhibits an underlying trend that is not related to the intervention—should be assessed and, where significant, stationarised as appropriate. Non-stationarity can be assessed using the Augmented Dickey-Fuller test.38 When autocorrelation, seasonality and/or non-stationarity are present in time series data and are not adjusted for, this can result in biased results.
Despite the rich literature on how to approach ITS studies from a methodological and statistical standpoint, we do not have good information on the degree to which evaluations of healthcare QI interventions meet these criteria. Thus, we systematically reviewed the literature to investigate the extent to which these evaluations have followed best practice standards.
Methods
This methodological systematic review was conducted according to a prespecified study protocol registered in PROSPERO (registration number: CRD42018094427) on 11 June 2018.39
Search strategy
Following the Preferred Reporting Items for Systematic Reviews and Meta-Analyses (PRISMA) checklist (online supplemental appendix table 1),40 we searched for healthcare QI intervention studies that were evaluated using ITS and were published in peer-reviewed journals from inception to June 2018. We also searched the grey literature to capture any relevant studies. The search strategy is summarised in table 1 and full details are provided in online supplemental appendix table 2.
Summary of the search strategy
Inclusion and exclusion criteria
The population, interventions, comparisons, outcomes and study designs considered for review are listed in table 2. Guided by the Shojania et al’s taxonomy for QI strategies, we identified interventions targeting health systems, health providers and/or patients for inclusion.4 5 Studies that did not have at least three preintervention and postintervention data points were excluded, consistent with the Cochrane EPOC recommendation.15 Similarly, given that this review focused on empirical applications of ITS, systematic reviews/meta-analyses, letters, commentaries, methodological contributions, study protocols and conference abstracts were excluded.
Population, interventions, comparisons, outcomes and study designs for study inclusion
Data extraction and analysis
The titles and abstracts of unique results from all databases and grey literature were reviewed independently by two researchers (CH and HR) for potential inclusion. The full texts of studies retained at the title and abstract screening stage were retrieved and independently assessed for inclusion by two researchers (CH and HR). Any discrepancies were resolved through discussion and consensus, with a third researcher (MRL) consulted wherever necessary. Data extraction on each included study was conducted using a data extraction tool, developed and piloted a priori drawing on a checklist on the methodological and reporting recommendations for ITS studies adapted from the Strengthening the Reporting of Observational Studies in Epidemiology (STROBE) statement (online supplemental appendix table 3).20 Data elements included study characteristics (eg, publication year, country), intervention characteristics (eg, QI strategies, single/multiple interventions), methodological considerations (eg, ITS model, autocorrelation, use of control). We synthesised extracted data narratively using descriptive statistics and following the review protocol registered in PROSPERO. Data extraction was done by one researcher (CH); however, a validation was done by a second researcher (HR) who verified a random subsample consisting of 10% of eligible studies. The agreement between the two researchers (CH and HR) was very high (>95%). Additionally, where necessary, CH consulted with the researcher team members during data extraction. Lastly, assessment of the risk of bias of included studies was performed by two researchers (CH and HR).
Assessment of risk of bias
The risk of bias assessment was guided by the Cochrane Effective Practice and Organisation of Care (EPOC) standard criteria for assessing risk of bias for ITS studies.17 27 41 Specifically, we assessed the following EPOC standard criteria:
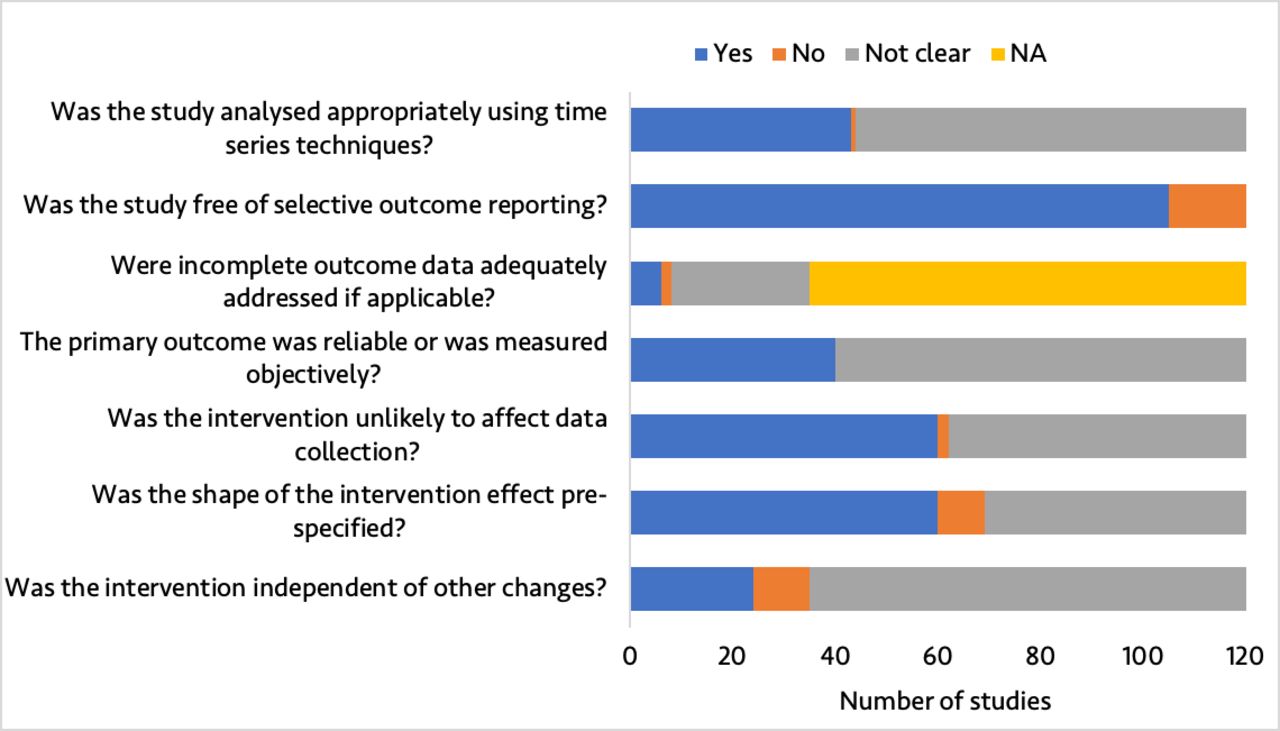
Was the intervention independent of other changes?
Was the shape of the intervention effect prespecified?
Was the intervention unlikely to affect data collection?
Was the primary outcome measured objectively?
Were incomplete outcome data adequately addressed?
Was the study free of selective outcome reporting?
Was the study analysed appropriately using interrupted time series techniques?
Criteria 1, 3 and 4 assess the threat of history, instrumentation and testing, respectively. Criterion 2 assesses whether the ITS impact model was specified a priori, while criterion 5 assesses whether missing data were dealt with appropriately. Criterion 6 assesses whether all relevant outcomes that were part of the study objectives were reported. Lastly, criterion 7 assesses whether data were analysed appropriately such as using appropriate models (eg, segmented regression and ARIMA) and considering key methodological recommendations (eg, autocorrelation and seasonality).
Online supplemental appendix table 4 describes how we performed risk of bias scoring among included studies. Each criterion scored ‘0’ if low risk and ‘1’ otherwise. For each study, we created an aggregate score by combining scores across the seven criteria. Subsequently, the study-level risk of bias aggregate score was categorised as low (score=0), moderate (score=1 or 2), high (score=3 or 4) and very high (score >4). Trends in risk of bias over time were also assessed. The time for each included study was defined as the year of the publication. Time trend for risk of bias was assessed by fitting a logistic regression model comparing the proportion of studies with a low or moderate risk of bias to the studies with high or very high risk of bias as has previously been done.42 As the literature search end date was June 2018, studies published in 2018 that were captured by our search strategy may not have been representative of all studies published in 2018. As such, for time trend analyses, studies published in 2018 were excluded. All statistical analyses were conducted using R version 4.0.2
Patient and public involvement
This research was done without patient involvement. Patients were not invited to comment on the study design and were not consulted to develop patient relevant outcomes or interpret the results. Patients were not invited to contribute to the writing or editing of this document for readability or accuracy.
Results
The search strategy identified 4061 results, of which 2028 unique eligible records were screened for inclusion. Abstract and full-text screening identified 120 studies that met the inclusion criteria.43–162 A summary of this process is presented in the PRISMA flow diagram in figure 3.
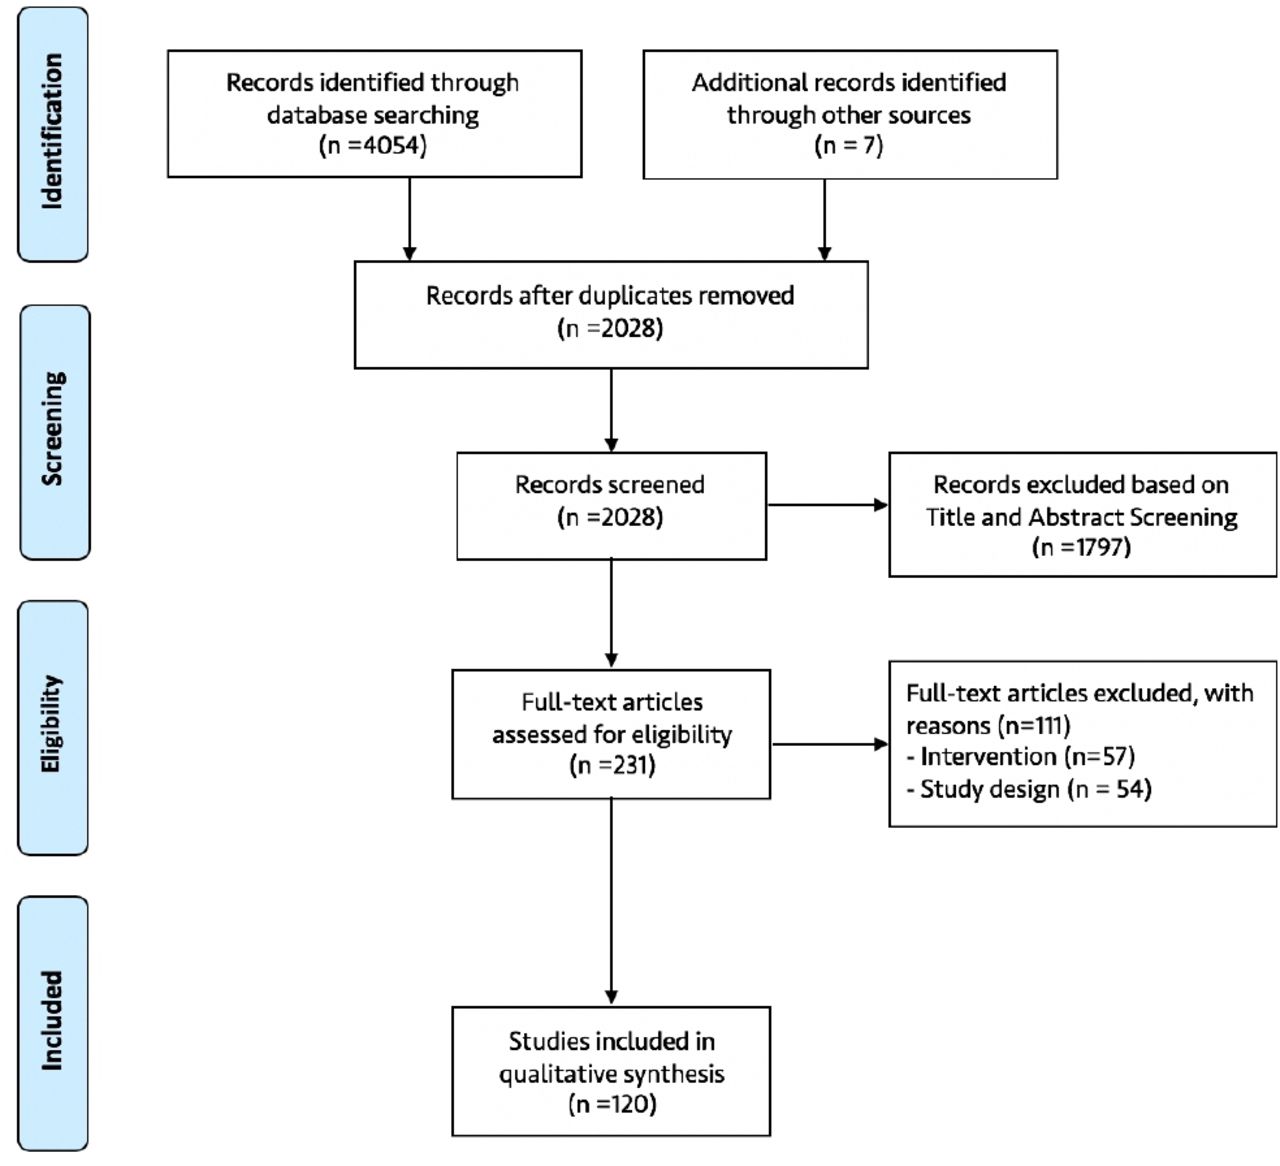
Flow diagram of the selection of included studies.
Characteristics of included studies
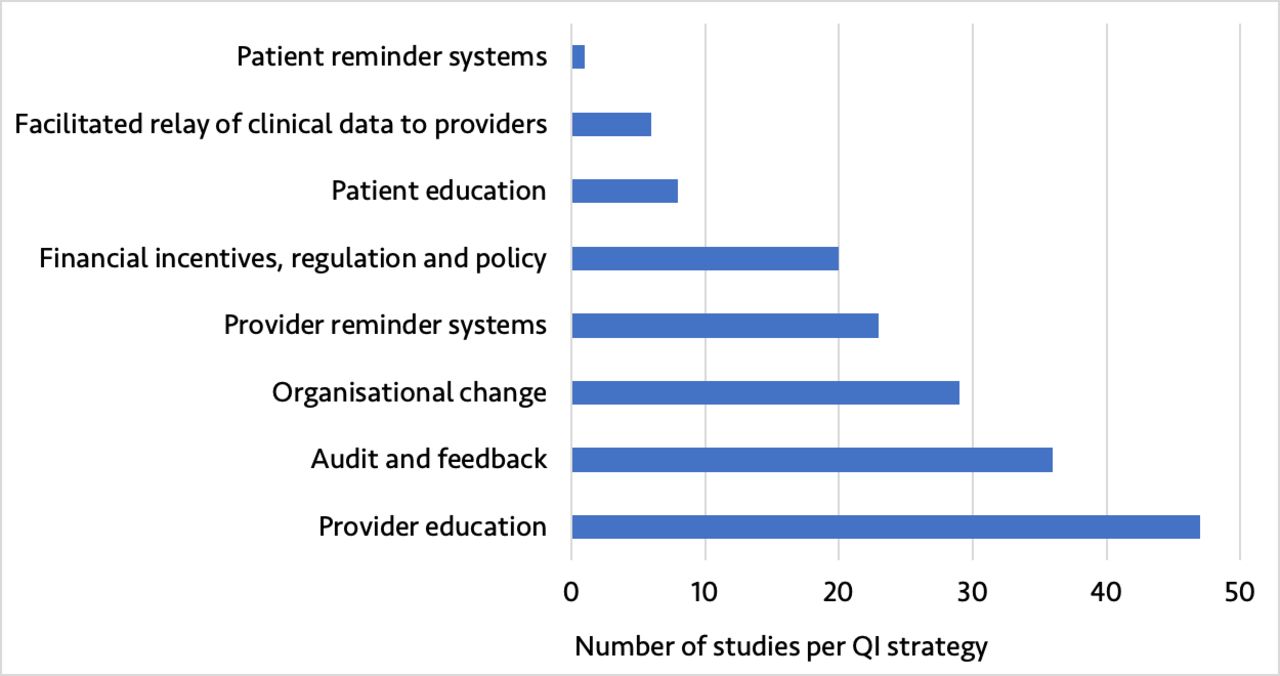
The 120 studies represented a diversity of QI strategies from different geographical settings. Included studies were from 25 countries, with 106 (88.3%) from high-income countries and 14 (11.7%) from low- and middle - income countries (LMICs) as defined by the 2019 World Bank Classification (online supplemental appendix figure 2). The number of studies published over time increased considerably, with 104 (86.7%) studies published in 2010 or later (online supplemental appendix figure 3). The included studies assessed eight QI strategies, with provider education (39.2%), audit and feedback (30.0%), organisational change (24.2%) and provider reminder systems (19.2%) being the most reported QI strategies (figure 4). Nearly half of studies were multisite (44.2%).

Type of quality improvement (QI) strategy reported in the included studies.
Reporting and methodological considerations
Interrupted time series methodological consideration of included studies
All included studies reported the use of an ITS design in their titles and/or abstracts and provided clear timing related to the QI implementation (table 3). Nearly all studies provided a background/rationale for using ITS (98.3%) and provided a description of the intervention (96.7%). A fifth of studies reported on evaluation of multiple phases of QI interventions, of which 76.0% adjusted for multiple phase of QI interventions in their analyses. All included studies reported on the study population, inclusion criteria and outcomes. Nearly all studies (99.2%) used data collected at regular intervals and reported data sources, of which 57% were administrative data including Health Management Information System data, 35% were patient records and 8% were survey data.
ITS methodological considerations of included studies
Most studies (71.4%) used monthly data points, with a median preintervention and postintervention period of 18 months (range, 3–120) and 20 months (range 4–90), respectively (table 3). Less than half (42.5%) of studies provided a rationale for the number and spacing of data points described. Just over half reported the unit of analysis clearly (42.5% used data aggregated at the study site level and 9.2% used disaggregated data). Most studies used ITS without a control (81%) and modelled data using segmented regression (62.5%), while 1 in 10 (11.6%) did not report what model was used. For studies that included a control group, 59.1% of studies used a location-based control and about half (54.5%) modelled intervention and control group in a separate ITS model.
About half (55%) of studies reported checking/adjusting for autocorrelation in their ITS models, with the Durbin-Watson test statistic being the test frequently used to check for autocorrelation (36.4%). A fifth (20.8%) of studies reported checking and adjusting for seasonality. Similarly, only 10 (8.3%) studies reported checking/adjusting for non-stationarity in their ITS models, with the augmented Dickey-Fuller test being the most frequently used (70%). Stratified analysis showed that these items were more likely to be reported with ARIMA models compared with segmented regression (online supplemental appendix table 5). Only about half (49.2%) of studies specified the ITS impact model. Over a tenth (12.5%) of studies considered sensitivity analyses.
Reporting of interrupted time series study results and interpretation
Most studies reported characteristics of study sample (70%) and reported all outcomes examined over the study period (87.5%) (table 4). Similarly, most studies reported the impact of QI using level and trend changes (89.2%), reported CI or SE (81.7%), and reported graphical figures displaying results (92.5%). Of the studies that included graphical figures, 57.6% showed observed trends and 12.6% showed the counterfactual. Further, 29.2% of studies reported absolute and/or relative changes and their significance, for example, clinical and policy. Most studies reported key results and discussed potential limitations of the study. Less than half of studies explicitly discussed potential history threats such as co-interventions. Similarly, 42.1% of studies that mentioned potential limitations also discussed the direction or magnitude of these potential bias(es). About a quarter of studies discussed the stability of outcome data over time.
Reporting of ITS study results and interpretation
Risk of biases of included studies
Risk of bias was low for 3 (2.5%) studies, moderate for 30 (25.0%), high for 64 (53.3%) and very high for 23 (19.2%). The proportion of studies with a low or moderate risk of bias did not significantly change over time (OR 1.15, 95% CI 0.96 to 1.40, p=0.14) (figure 5). Figure 6 shows the risk of bias across the seven EPOC standard criteria for assessing bias in ITS studies. Details on risk of bias assessment for each included study are provided elsewhere.6
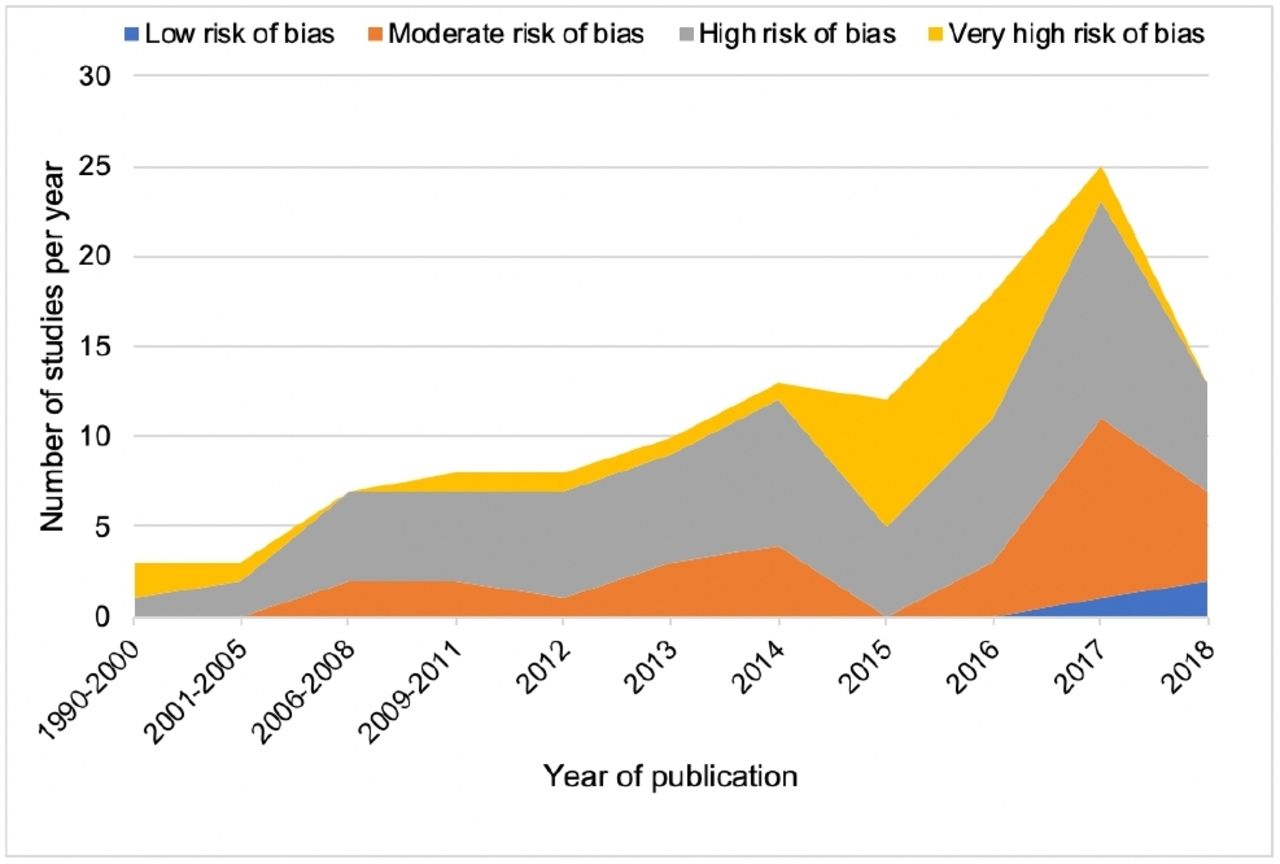
Number and risk of bias of included studies over time. Our literature search end date was June 2018, and as such, studies published in 2018 that were captured by our search strategy may not have been representative of all studies published in 2018.

Summary of quality assessment of included studies. NA, not applicable. In this study, NA refers to studies with complete data.
Discussion
Over the past few decades, ITS has been an increasingly popular method to evaluate QI interventions in healthcare. We investigated whether the use of ITS in such evaluations has followed best practice standards and recommendations. Our findings showed variations in methodological considerations and reporting of ITS in QI. In particular, we found that most studies identified used ITS without a control and only about half of studies specified the ITS impact model and considered autocorrelation in the ITS analyses. Of concern, the risk of bias was high or very high in about three-quarters of included studies and did not appear to have changed significantly over time.
While ITS is arguably one of the strongest quasi-experimental designs available, ITS studies may be subjected to several threats to internal validity.10 18 22 These internal validity threats can often be minimised by adding a control time series group to ITS where feasible.10 18 22 24 However, this review found that a control group was used in less than 20% of included studies, with a location-based control being the most commonly used. When QI interventions were multisite and implemented at different times, approaches used to assign control were not often discussed clearly. Most of studies included in this review were from high-income countries; however, with expanding routine health information systems in LMICs, there is opportunity to conduct well-designed ITS studies for evaluating healthcare interventions including QI in these settings.25 163
Consistent with previous systematic reviews, this review highlights variations in methodological considerations (or application) and reporting of ITS.19–21 For example, Jandoc et al’s (2015) systematic review of application of ITS in drug utilisation research found that about three-quarters of studies examined drug utilisation over monthly intervals, and two-thirds used segmented regression techniques.20 They also found that key methodological considerations in ITS including seasonality and non-stationarity were considered in less than half of studies.20 However, autocorrelation was considered in two-thirds of studies included in Jandoc et al’s review unlike in our review where it was considered in only about half of studies.20
Our findings showed that considerations of autocorrelation, seasonality and non-stationarity were more likely to be reported when ARIMA was used compared with segmented regression, which mirrors prior reviews in other subject areas.20 Similar to this review, a more recent review by Huddson et al (2019) examined characteristics and reporting of single ITS in healthcare in studies published in 2015 and found that only about half of studies considered autocorrelation, 28% considered seasonality and 10% considered non-stationarity.21 Consistent with previous reviews, this review showed that studies used various statistical approaches that may have different effect on study results, highlighting a need for further research on how various statistical analyses used in ITS can affect intervention estimates.20 21
While the number of ITS studies has increased over time, the conduct and reporting of ITS studies still leaves room for improvement. Consistent with previous reviews, variations in methodological considerations and reporting of ITS remain a concern, warranting a need to develop and reinforce formal reporting guidelines to improve the application of ITS in the evaluation of effectiveness of healthcare interventions. Jandoc et al (2015) proposed methodological and reporting recommendations for ITS studies that built on STROBE, and Bernal (2018) proposed a framework for enhanced reporting of ITS framework that can be adapted to help improve design and reporting of ITS in the evaluation of QI.20 23 Additionally, the Cochrane EPOC standard criteria for assessing risk of bias for ITS should be used to improve the design of ITS in the evaluation of QI to reduce risk of bias.17 27 Although these EPOC standard criteria do not provide guidance on how to account for key methodological considerations such as autocorrelation, non-stationarity, seasonality and multiple interventions, there are other resources that are accessible to QI evaluators to help conduct ITS analyses appropriately, such as Wagner et al’s seminal paper on segmented regression analysis of ITS, Bernal et al’s tutorial on use of ITS in the evaluation of public health interventions and Saeed et al’s work on use of segmented generalised mixed effects models to evaluate health outcomes.18 26 31
This methodological systematic review has a number of limitations that need to be highlighted. First, our results are based on what were reported (or not) as performed in eligible studies; we did not reanalyse reported time series data to check whether the statistical analyses undertaken in these studies were performed appropriately. As such, it is possible that we underestimated the risk of bias, especially as related to whether the study data were analysed appropriately using time series techniques—one of the seven EPOC standard criteria for assessing risk of bias for ITS studies. Ramsay and colleagues reanalysed ITS studies data from two systematic reviews and found that approximately 50% of studies that had reported a significant difference were not actually significant when ITS methods were applied appropriately.17 Second, although we did not apply any restrictions to our search strategy, we could still have missed some relevant studies. Lastly, while the recommended conventional double screening was employed in this study, data extraction was done by a single researcher.164 However, a validation on a random subsample consisting of 10% of eligible studies found a very high agreement, making the data extraction less of a concern.
In conclusion, while use of ITS in the evaluation of health system QI interventions has increased considerably over the past decade, the quality of ITS studies still shows room for improvement. Moreover, variations in methodological considerations and reporting of ITS in QI research remain a concern, warranting a need to develop and reinforce formal reporting guidelines to improve application of ITS.
Acknowledgments
Dr Hategeka received support through a Vanier Canada Graduate Scholarship and a Banting Postdoctoral Fellowship from the Canadian Institutes of Health Research. Dr Karamouzian is supported by a Vanier Canada Graduate Scholarship and a Pierre Elliott Trudeau Foundation Doctoral Scholarship. Dr Law received salary support through a Canada Research Chair in Access to Medicines and a Michael Smith Foundation for Health Research Scholar Award.
References
Supplementary materials
Supplementary Data
This web only file has been produced by the BMJ Publishing Group from an electronic file supplied by the author(s) and has not been edited for content.
Footnotes
Handling editor Valery Ridde
Twitter @DrHategeka, @myclaw
Contributors CH conceived the idea and designed the study. MRL provided guidance throughout the research process. CH, MK and MRL contributed to the search strategy. CH and HR performed screening of titles, abstracts and full texts. CH and HR extracted data from eligible studies and performed risk of bias assessment. CH analysed the data and drafted the manuscript. All authors reviewed the manuscript and contributed to the revision of the manuscript and approved its final version.
Funding The authors have not declared a specific grant for this research from any funding agency in the public, commercial or not-for-profit sectors.
Competing interests None declared.
Patient consent for publication Not required.
Provenance and peer review Not commissioned; externally peer reviewed.
Data availability statement All data relevant to the study are included in the article or uploaded as supplementary information.
Supplemental material This content has been supplied by the author(s). It has not been vetted by BMJ Publishing Group Limited (BMJ) and may not have been peer-reviewed. Any opinions or recommendations discussed are solely those of the author(s) and are not endorsed by BMJ. BMJ disclaims all liability and responsibility arising from any reliance placed on the content. Where the content includes any translated material, BMJ does not warrant the accuracy and reliability of the translations (including but not limited to local regulations, clinical guidelines, terminology, drug names and drug dosages), and is not responsible for any error and/or omissions arising from translation and adaptation or otherwise.