Article Text

Abstract
Introduction An international city, Hong Kong, in proximity to the first epicentre of COVID- 19, experienced two epidemic waves with different importation pressure. We compared the epidemiological features of patients with COVID-19 in the context of containment policies between the first and second waves.
Methods We retrieved information on the first 1038 cases detected in Hong Kong (23 January to 25 April 2020) to analyse the epidemiological characteristics including age/gender-specific incidence, clustering, reproduction number (Rt) and containment delay; in relation to the containment measures implemented. Factors associated with containment delay were evaluated by multiple linear regression analysis with age, gender, epidemic wave and infection source as covariates. A time series of 5-day moving average was plotted to examine the changes across the two epidemic waves.
Results The incidence and mortality (135.5 and 0.5 per 1 000 000 population) was among the lowest in the world. Aggressive escalation of border control correlated with reductions in Rt from 1.35 to 0.57 and 0.92 to 0.18, and aversions of 450 and 1650 local infections during the first and second waves, respectively. Implementing COVID-19 tests for overseas returners correlated with an upsurge of asymptomatic case detection, and shortened containment delay in the second wave. Medium-sized cluster events in the first wave were family gatherings, whereas those in the second wave were leisure activities among youngsters. Containment delay was associated with older age (adjusted OR (AOR)=1.01, 95% CI 1.00 to 1.02, p=0.040), male gender (AOR=1.41, 95% CI 1.02 to 1.96, p=0.039) and local cases (AOR=11.18, 95% CI 7.43 to 16.83, p<0.001), and with significant improvement in the second wave compared with the first wave (average: 6.8 vs 3.7 days). A higher incidence rate was observed for males, raising possibility of gender predilection in susceptibility of developing symptoms.
Conclusion Prompt and stringent all-round containment strategies represent successful measures in pandemic control. These findings could inform formulation and implementation of pandemic mitigation strategies.
- epidemiology
- public health
- respiratory infections
- SARS
This is an open access article distributed in accordance with the Creative Commons Attribution Non Commercial (CC BY-NC 4.0) license, which permits others to distribute, remix, adapt, build upon this work non-commercially, and license their derivative works on different terms, provided the original work is properly cited, appropriate credit is given, any changes made indicated, and the use is non-commercial. See: http://creativecommons.org/licenses/by-nc/4.0/.
Statistics from Altmetric.com
Key questions
What is already known?
The spread of the COVID-19 has induced a substantial burden to global health.
Identification of effective containment strategies will be important to combat resurgence of epidemic waves.
We performed a study to compare the epidemiological features of patients with COVID-19 in the context of containment policies between the first and second waves in an international city, Hong Kong, which is in close proximity to the epicentre of COVID-19.
What are the new findings?
We found that the incidence and mortality (135.5 and 0.5 per 1 000 000 population) of COVID-19 in Hong Kong was among the lowest in the world; aggressive escalation of border control was correlated with reductions in Rt from 1.35 to 0.57 and 0.92 to 0.18, and aversions of 450 and 1650 local infections during the first and second waves, respectively.
Implementing testing for overseas returners correlated with an upsurge of asymptomatic case detection, and shortened containment delay in the second wave.
Containment delay was associated with older age, male gender and local cases, and with significant improvement in the second wave compared with the first wave; and a higher incidence rate was observed for males, raising possibility of gender predilection in susceptibility of developing symptoms.
What do the new findings imply?
Prompt and stringent all-round containment strategies represent successful measures in pandemic control.
These findings will contribute to a more in-depth understanding of the disease, and inform physicians and policymakers in formulation and implementation of pandemic mitigation strategies.
Introduction
Since the identification of a novel coronavirus disease (COVID-19) in December 2019, its spread in many parts of the world has induced a substantial global health burden.1 2 As of 28 August 2020, the virus has affected 216 countries and regions, involving a total of more than 24.2 million confirmed cases and 827 000 deaths.3 While a decline in new cases was observed in a number of countries in June 2020, the WHO has warned that a second wave or second peak may occur.4
Hong Kong is a metropolitan city with a population of 7.49 million living in an area of 427 square miles. It is one of the most densely populated cities (6940 people/km2),5 and ranks one of the top five territories for population density in the world. The high population density together with its location in close proximity to the first epicentre of COVID-19 and the highly developed international transportation networks make it vulnerable to importation as well as local spread of this novel human infection, SARS-CoV-2. Hong Kong has learnt from the experience of SARS in 2003. The government and the public are prepared and willing to respond to emerging infections like COVID-19.6 While there were all-round containment measures including border control, social distancing and active case finding, Hong Kong did not implement complete lockdown as in many other cities. Yet, the cumulative incidence and mortality associated with COVID-19 remained low across the two waves that presented with different importation threats and other epidemiological features.7 This report describes and compare the epidemiological features in the context of the containment policies between the first and second waves of the epidemic, and examined the projected increase in number of cases if control measures were not implemented in a timely manner. The findings of this study will enlighten formulation and implementation of pandemic control policy in the future.
Methods
Data source
We used the data source employed in our previous study that examined the first 100 confirmed COVID-19 cases in Hong Kong.8 COVID-19 cases in Hong Kong were confirmed by two reverse transcription PCR tests targeting different regions of the RdRp gene performed respectively by the local hospitals and its Public Health Laboratory Centre. The Centre for Health Protection of the Hong Kong government has established a database of patients with COVID-19,9 which provides real-time updates on all new cases. We extracted the information of each confirmed case, including age, gender, infection source (locally acquired vs imported), how the case was identified, and dates of symptom onset, diagnosis, isolation and hospital admission. We analysed all information available for the first 1038 cases, which marked the end of the second wave of COVID-19 in Hong Kong. The epidemic curve and the time-varying reproduction numbers (Rt) were examined to identify a cut-off date to classify patients into the first wave or second wave. As the study involves retrieval of information from a publicly available database only, a full review by the Survey and Behavioural Research Ethics Committee is not required, and patient or public involvement is not applicable. This study conformed to the principles embodied in the Declaration of Helsinki.
Data analysis
Epidemic curve and reproduction number
We composed an epidemic curve based on the illness-onset dates of symptomatic cases in relation to the source of infection (local vs imported). We estimated Rt which is defined as the average number of secondary infections generated by a single case in a population at time t. Rt is a commonly used parameter for monitoring local disease transmission.10–12 If Rt is less than 1, an epidemic is likely to die out. As there was a proportion of imported cases, we employed the approach of Thompson and his colleagues10 using the daily number of cases with their illness onset. This method also accounted for the transmissions from the imported cases as previously described.11 We assumed the serial interval follows a gamma distribution with a mean of 6.5 days and a coefficient of variation of 0.62.12 The peak and median Rt in each phase of the epidemic were determined. In addition, we tested the robustness of the assumption using a longer (mean=7.5 and SD=3.4 days)13 and a shorter (mean=4.4 and SD=3.0 days) serial interval.14 Based on the estimated median Rt in each phase, we generated the expected epidemic curves by using the same equation of Thompson and his colleagues10 to estimate the number of local infections averted within the next 30 days after the implementation of control measures, while assuming the number of imported infections remained unchanged.
Age, gender, incidence and mortality
Confirmed cases who were local residents were included in the age/gender-specific incidence analyses based on the mid-2019 population census data.15 In addition, we examined age and gender distribution with respect to importing countries. We performed descriptive analyses focusing on differences between the two waves. For all categorical and continuous variables, we compared subgroups using the χ2 tests of heterogeneity and Student’s t-tests, respectively. A multiple regression analysis was employed to examine the factors associated with containment delay.
Cluster events
We defined clusters as two or more patients with an epidemiological link. Medium-spreading and superspreading events were arbitrarily defined as those clusters affected more than 5 and 50 patients, respectively.16
Containment delay
In this study, containment delay was defined as the interval in days between symptom onset and isolation of the patient at home, quarantine camp or hospital. Asymptomatic patients were excluded from this analysis. To assess factors associated with containment delay, a multiple linear regression model was constructed with age, gender, epidemic wave and infection source as covariates. In addition, a time series of 5-day moving average was plotted to examine the changes across the two epidemic waves.
Results
Epidemic curve and reproduction number
This analysis covered the first 1038 cases detected in Hong Kong from 23 January to 25 April 2020 (online supplemental table 1). The epidemic curve based on the illness-onset dates of symptomatic cases exhibited two waves with a trough Rt observed on 22 February, which was taken as a cut-off to define the first and second waves throughout this report (figure 1). There were major differences in containment measures between the first and the second waves, including quarantine measures, border control, closure of premises and social distancing (figure 1). Also, the Hong Kong government has started collecting deep throat saliva in high-risk individuals at the airport within the second wave.17
Supplemental material

Number of confirmed cases by illness-onset date, time-varying reproduction number and arrival statistics at border points of entry. The epidemic curve in the upper panel includes 844 symptomatic cases. One symptomatic case with uncertain illness-onset date and 193 asymptomatic cases were excluded. The middle panel shows the estimated Rt of each day with a black line, and their 95% CIs with shaded area. The lower panel shows the number of persons arriving in Hong Kong via land and sea borders, and airport.
During the first wave, the highest Rt of 1.74 (95% CI 1.08 to 2.62) was observed on 30 January when the number of persons arriving in Hong Kong was approximately 161 000 per day. Three consecutive sea and land border control policies were implemented since late January to minimise people entering from mainland China, the epicentre of COVID-19 at that time.18 On 8 February, a more drastic order of a compulsory 14-day quarantine at designated camps or at home for people arriving from mainland was implemented, which resulted in a sudden drop in arrivals, and coincided with a drop in Rt from a median of 1.35 (95% CI 0.47 to 2.98) to 0.57 (95% CI 0.33 to 0.91) (figure 1).
During the second wave of epidemic, despite implementing the consecutive compulsory 14-day home quarantine policies for people arriving from different affected areas in Europe, the epicentre of COVID-19 at that time, the number of imported cases kept increasing since 22 February. On 19 March, the home quarantine policy was extended to all overseas countries. Then, a damping down of the rising trend of imported cases was observed. This policy was also correlated in time with a decrease in median Rt from 0.92 (95% CI 0.72 to 1.16) before 20 March to 0.18 (95% CI 0.13 to 1.24) afterwards (figure 1). While the trend of the Rt estimation was robust to the length of serial interval, there was a more apparent decrease in median Rt from 1.39 (95% CI 1.01 to 1.87) before 20 March to 0.16 (95% CI 0.12 to 1.21) afterwards when the estimation was based on a longer serial interval assumption (figure 1).
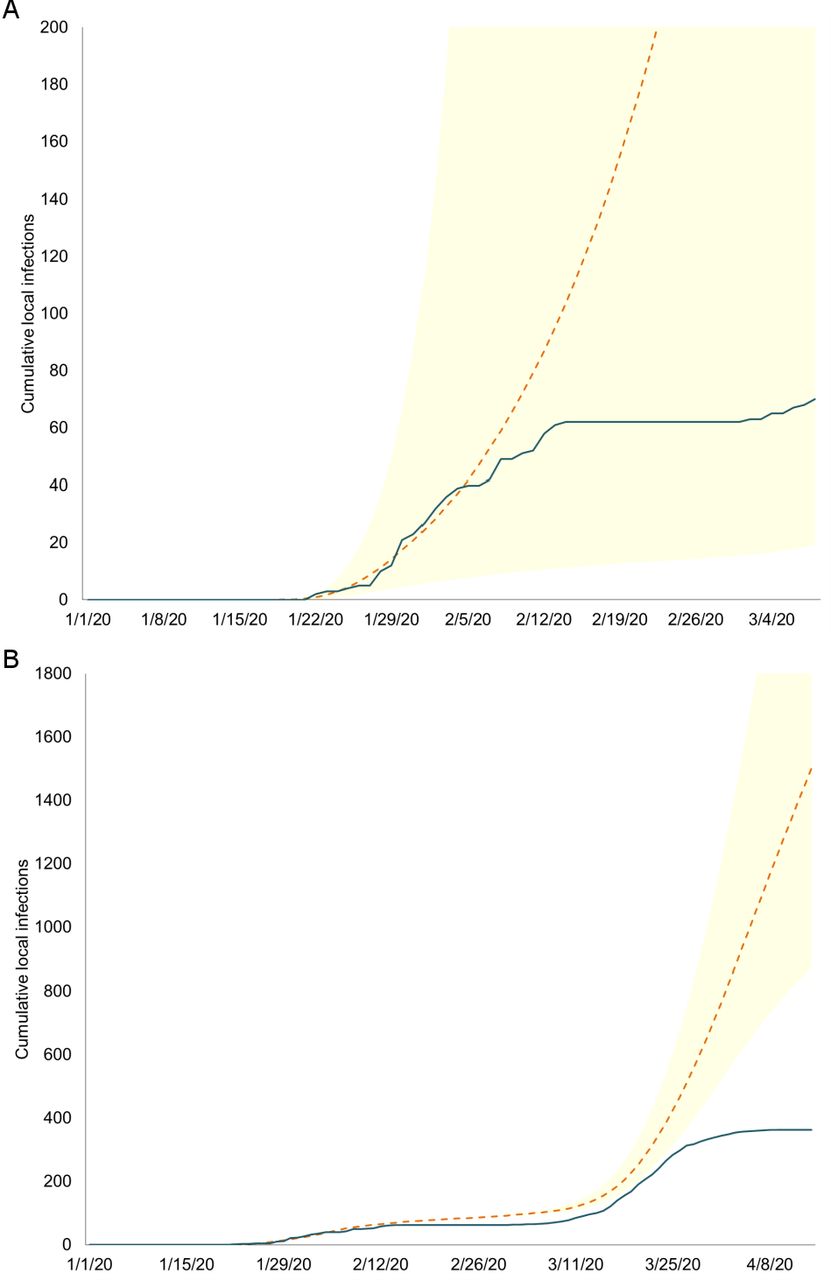
We generated the epidemic curves for scenarios that the median Rt remained as with that before the implementation of border control measures, and estimated that these border control measures together with other existing containment policies, especially the intense contact tracing, had averted around 450 and 1650 cumulative local cases within a 30-day period in the first and second waves, respectively (figure 2).

Estimated number of local cases averted by control measures implemented during the two waves of COVID-19 outbreak. Simulated (dash lines) versus observed (solid line) cumulative number of local cases before and after border controls and quarantine policies for entrants in the (A) first wave and (B) second wave of epidemic using the infection generation equation from Thompson and his colleagues.10 In the first wave (A), the initial median reproduction number of the simulated curve was 1.35, whereas in the second wave (B), the initial median reproduction number of the simulated curve was 0.92. A 30-day projection of cumulative local infections was simulated in the periods before and after the border controls and quarantine policies in the first (before and after 8 February) and second (before and after 20 March) waves. Shaded regions indicate the 95% confidence bands of the simulated curves.
Age/gender-specific incidence
Patients in the two epidemic waves exhibited a contrast in age distribution (online supplemental table 1, figure 3A). In the first wave, majority were older adults aged 45–64 years (40.4%) and elderly >65 years (33.7%); whereas in the second wave, most were young adults and adolescents, 25–44 years (37.8%) and <24 years (32.2%).

The number and incidence of patients with COVID-19 by epidemic waves. Panel (A) shows the number of cases with respect to the first wave (left) and second wave (right) for each age and sex group, and overall (in thick borders). Panel (B) shows the incidence rates. The number of locally acquired infections was 70 and 397 in the first and second waves, respectively; while there were 82 and 935 local residents in the two waves, respectively. Local residents refer to individuals with Hong Kong identity cards.
Up to 25 April 2020, a total of 1017 Hong Kong local residents were confirmed to have COVID-19, and four patients died. The overall cumulative incidence and mortality rates were 135.5 and 0.5 per 1 000 000 population, respectively. The incidence rate of the second wave was 10.6 times higher than that of the first wave (126.4 vs 11.9 per 1 000 000 population). When the age distribution of the patients was compared between the first and second waves, a significant trend of increase in incidence with age was observed for the first wave, whereas a significant trend of decrease was observed for the second wave (p<0.001) (figure 3B).
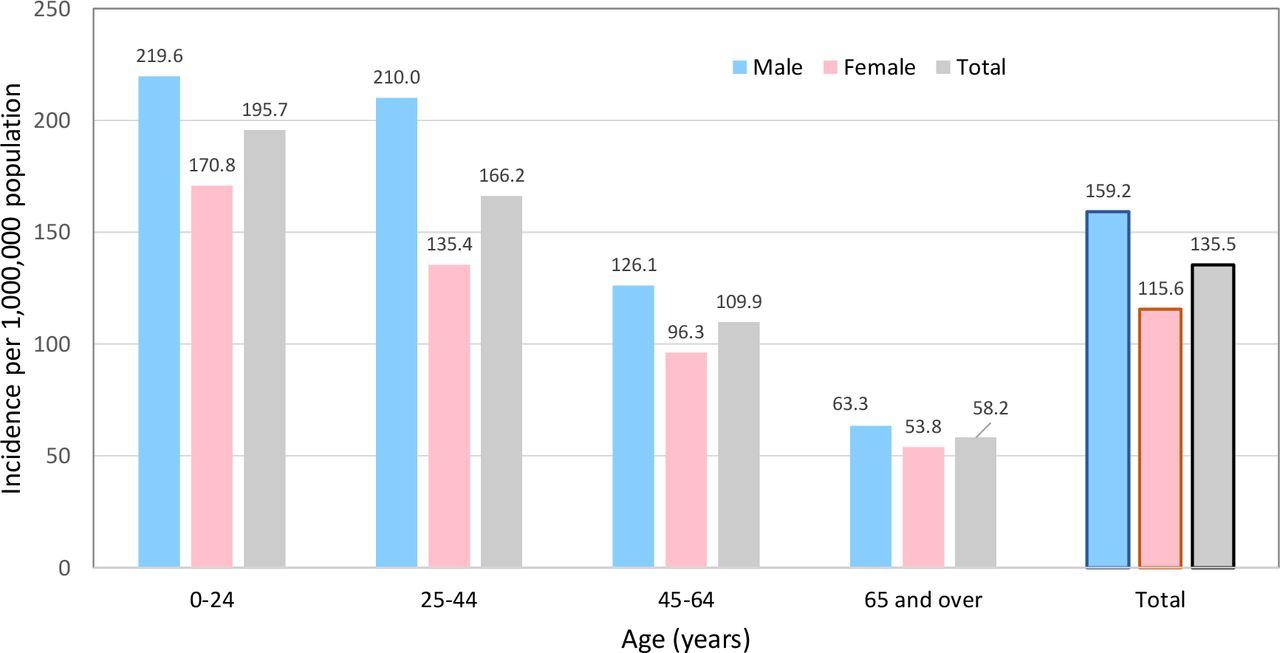
The overall cumulative incidence rate for all age groups combined was significantly higher than that of females (159.2 vs 115.6 per 1 000 000 population, p<0.001) (figure 4). Further analyses also revealed higher overall incidence rates for males (p<0.001), and the difference achieved statistical significance for each age group except among those aged ≥65 years.

Cumulative age/sex-specific incidence rates. All COVID-19 cases confirmed on or before 25 April 2020 who are Hong Kong residents were included. The mid-2019 population census data were used as denominators.
Testing policy and symptoms at diagnosis
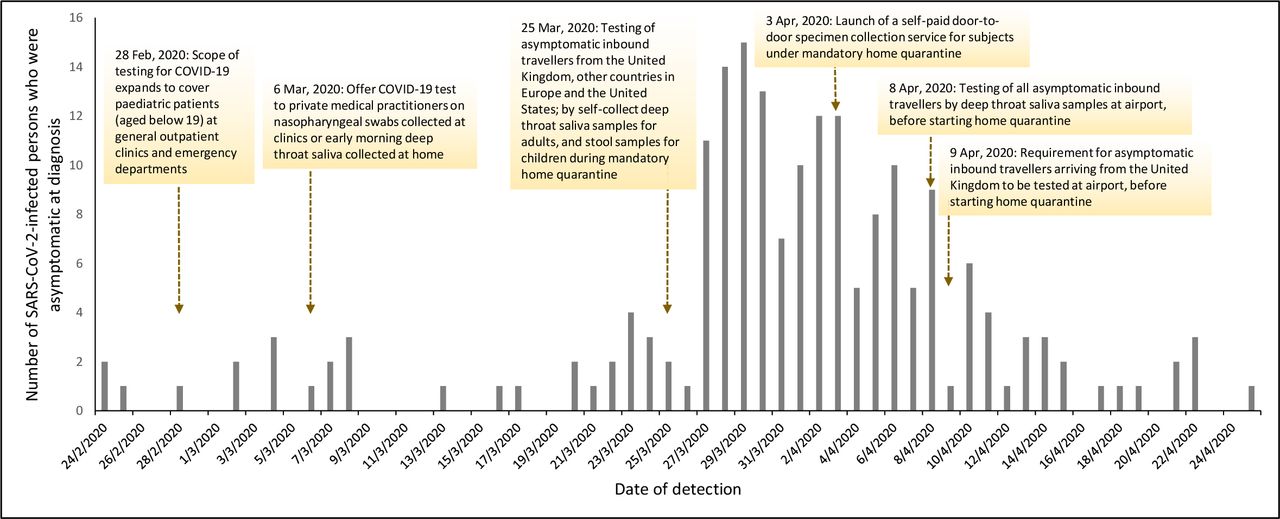
As part of the border control policies, persons arriving in Hong Kong with symptoms were transferred to hospital for further investigation. Since 25 March, additional testing policy on all asymptomatic persons coming from the UK, other countries in Europe and the USA was implemented. This policy resulted in a sharp increase in the detection of new cases who were asymptomatic at the time of diagnosis (figure 5).

Number of asymptomatic SARS-CoV-2 infections detected and implementation of testing policies. All COVID-19 testing services provided by the Department of Health as part of the outbreak response measures were free of charge. Symptomatic persons were admitted to hospital where nasopharyngeal swab samples were taken. Self-collected deep throat saliva samples were used for asymptomatic adults. Self-collected stool samples were used for asymptomatic children arriving in Hong Kong.
Imported cases
Overall, majority of the cases were imported (59.3%, 422 of 1038), and the proportion of imported cases was significantly higher in the second wave as compared with the first wave (62.9% vs 21.4%, p<0.001) (online supplemental table 1). A sharp contrast in the source of imported cases between the first and second waves was observed (online supplemental figure 1). While all cases imported during the first wave were from mainland China, no further import was detected since the sea and land borders were closed; with the exception of one asymptomatic case who was escorted back from Wuhan by chartered flight. The UK ranked the top among importing countries and accounted for 84.4% (356) of all imported cases, followed by the USA (74, 17.5%) and France (41, 9.7%). A sharp contrast in age distribution of imported cases between the two waves was observed. The majority (66.7%) of the cases imported from mainland China during the first wave were older adults aged 55 years or above. Imported cases from the UK and the USA during the second wave were mainly adolescent and young adults, where the age group 15–24 years accounted for 59.0% and 37.8%, respectively (online supplemental figure 1).
Supplemental material
Cluster events
In the first wave, there were 14 clusters affecting a total of 77 patients. The median number of patients affected in each cluster was 3 (IQR: 2–9). There were four medium-sized clusters, including the Buddhist worship hall (n=19); the Lunar New Year hot pot party (n=13); the Princess Diamond Cruise (n=11); and the Lunar New Year family dinner party (n=8) (online supplemental figure 2). The remaining clusters consisted of nine families that affected two to three patients each, and one cluster of family and colleagues that affected five patients.
Supplemental material
In the second wave, there were a total of 112 clusters that affected 431 patients. The median number of patients affected in each cluster was 2 (IQR: 2–3). There were eight medium-spreading events: three clusters involving tour groups returning from Egypt (n=10), India (n=8) and Bolivia (n=8); two clusters in different karaoke lounges that affected nine and eight patients, respectively; a wedding banquet at Lantau Island (n=15); a cluster involving people who visited a drinking and clubbing spot, Lan Kwai Fong, (n=9); and a meal gathering in an international school (n=7) (online supplemental figure 2). There was a superspreading event that affected 103 patients. This bar and band cluster involved musicians and performers, and the customers in multiple bars where they performed. For the remaining 103 clusters, there were 17 families involving 44 patients (cluster size 2–5); 20 patients from 12 work-related clusters (cluster size 2–5); 28 patients who were travel collaterals returning from 11 travel groups from different countries; and 2 clusters resulted from wedding banquet and party that affected 5 patients each.
Containment delay
For the purpose of analysis in this study, containment delay was defined as the duration in days from the onset of symptom to isolation of the patient. Among 193 patients without symptoms at diagnosis, one with uncertain date of symptom onset and one with uncertain isolation date were excluded. Of the 843 patients included, 556 (66.0%) were regarded as having containment delay with an average delay of 4.0 days (SD 4.7). The containment delay was longer among local compared with imported cases (5.3±4.2 days vs 2.9±4.8 days, p<0.001); among older (≥65 years, 6.1±5.4 days, p<0.001), young adults (25–44 years, 4.6±4.8 days, p<0.001) and middle (45–64 years, 4.0±4.3 days, p<0.001) aged groups when compared with the youngest patients (0–25 years, 2.4±4.2 days). Containment delay was similar between male patients (4.2±5.0 days) and female patients (3.8±4.3 days), but was longer in local sporadic (6.1±4.2 days, p<0.001) and local cluster cases (5.1±4.1 days, p<0.001) than imported (2.9±4.8 days) cases. However, there was no significant difference in the containment delay between close contacts of imported cases (2.5±2.1 days, p=0.343) and imported cases. Older patients (adjusted OR (AOR): 1.01, 95% CI 1.00 to 1.02, p=0.040), male subjects (AOR: 1.41, 95% CI 1.02 to 1.96, p=0.039) and local cases (AOR: 11.18, 95% CI 7.43 to 16.83, p<0.001) were significantly more likely to have longer containment delay by multivariate regression analysis.
Online supplemental figure 3 shows the 5-day moving average of containment delay over the two epidemic waves. The mean duration of containment delay in the first wave was significantly longer than that of the second wave (mean (SD): 6.8 days (4.6) vs 3.7 days (4.6), p<0.001).
Supplemental material
Discussion
Since the first detection of SARS-CoV-2 in Wuhan, China, the virus has gained efficient human-to-human transmission resulting in a pandemic involving virtually all parts of the world.19 While stringent containment measures were implemented in most nations, its effect on minimising the spread of infection and the associated mortality varies substantially.20 Despite having experience in controlling the initial wave, many cities had resurgence with larger epidemics.4 21 Hong Kong was among the earliest cities to detect COVID-19 cases, and had experienced two waves of epidemic in facing different epicentres. The cumulative incidence and mortality (135.5 and 0.5 per 1 000 000 population) observed during our study period was one of the lowest in the world. Many well-developed nations encountered significantly higher incidence and mortality rates, including the USA (6090 and 350 per 1 000 000 population), Canada (2560 and 210), the UK (4320 and 610), Spain (5180 and 580), Italy (3920 and 570), Singapore (6990 and 4) and Korea (230, 5), as of 13 June 2020.3 6 22 The success of Hong Kong in maintaining a low incidence and mortality would serve as a model for other cities with high population density and international travel volume.
A recent study performed on the first 715 confirmed cases in Hong Kong found that public health interventions including border entry restrictions; quarantine and isolation of cases and contacts; and behaviour changes at personal and population levels were associated with COVID-19 control.23 Our findings on the successful decline of transmissibility in the second wave could be attributed to these containment measures. When compared with this previous study,23 the present study included the evaluation and comparison of SARS-CoV-2 RNA transmissibility and additional epidemiological investigation between the two waves extended to the end of the second wave (up to 25 April 2020). Hence, the estimated Rt covered the time period of both waves, allowing a direct comparison to be made between the two waves. In addition, we have also examined the more detailed age/gender-specific incidence of COVID-19, analysed the different clusters of the outbreak and examined the factors independently associated with containment delay.
In addition, our study found that the sea and land border control measures in the first wave and the compulsory home quarantine policies in the second wave for travel returnees were associated with a marked reduction in reproduction numbers. In order to achieve a timely effect, these border control measures, on one hand, have to aggressively step up to a very high level; and on the other hand, have to be implemented in conjunction with other policies especially intense contact tracing and case finding. A decision based on a fine balance among economic loss, freedom of travel and public health impact needs to be made in a timely manner. These findings are in line with a recent review,24 which summarised all the modelling studies that examined whether quarantine measures affected the COVID-19 pandemic control. The review identified that a combination of quarantine with other preventive strategies such as school closure, travel restrictions and social distancing exerted a great effect on reduction of viral transmission.
Our analysis on demographic characteristics of patients revealed remarkable differences between the two waves. The second wave was dominated by adolescents and young adults representing a mass return of overseas students who attempted to avoid disease exposure occurring in their studying cities. The context of large-sized and medium-sized cluster events, such as bars and karaoke lounges occurring in the second wave, also reflects the social networks of this young generation. In contrast, the cluster events of the first wave were family dinner gatherings during the special festival, namely the Lunar New Year. Social distancing advice and policies should therefore be tailored according to the characteristics of social network of the potential core of infectious source.
SARS-CoV-2 carries a transmission feature that is distinct from its close relative SARS-CoV-1. While the virus shedding, and hence infectivity, of SARS-CoV-1 peaks in the second week after illness onset,25 SARS-CoV-2 spread early and even before symptom onset.26 This difference in their characteristics, together with reports of transmission from asymptomatic persons,27 though with uncertain efficiency, detecting and isolating asymptomatic cases as well as cases at their presymptomatic stage, could help contain community transmission. In this regard, Hong Kong has implemented COVID-19 testing of asymptomatic persons arriving at the airport using self-collected deep throat saliva samples for adults and stool samples for children. Since this testing policy was implemented during the second wave in late March, a large number of asymptomatic cases were detected in the following 2 weeks. This also resulted in a substantial shortening of containment delay in the second wave.
Gender predilection in susceptibility and severity of SARS-CoV-2 infection remains controversial. Our observation that the incidence rates were consistently higher in males across all age groups is in line with a higher susceptibility or a higher chance of developing symptoms in males, as have been observed in other common respiratory viruses.28
We found that the small cluster events in both the first and second waves were similar in composition, and mainly involved households of two to three family members. This coincides with the small average domestic household size of 2.8 in Hong Kong.29 Our observation confirms that household exposure poses a high risk of infection, which should be considered when practising home quarantine policies. In the first wave, there were two medium-sized clusters related to dinner gathering, which echoes with the suspicion of chopsticks being a vehicle of transmission when dishes are shared among family or friends.30 There was only one superspreading event, which occurred in the second wave, involving a bar and band cluster affecting 103 patients. Singing could generate aerosols, and is related to loudness.31 There were reports of high attack rate of SARS-CoV-2 after choir practice.32 Considering one of the highlights of performance of bands in bars is their close proximity with audiences and this could account for the large number of subjects affected.
Despite intense contact tracing and surveillance testing, a proportion of cases still had containment delay. Nevertheless, majority of cases had containment delay of less than 1 week, and a substantial improvement was achieved in the second wave. This could be due to a heightened population awareness of the COVID-19 pandemic, behavioural modification of citizens in response to government measures and earlier attendance to healthcare providers during the second wave—given a potential learning effect due to previous community exposure to COVID-19.33 Another important contributor to the shortening in containment delay could be the increased testing capacity to cover COVID-19 testing in public primary care clinics and at the port of entry. Also, we observed that local cases were significantly more likely to have containment delay by multivariate regression analysis. This finding is compatible with the results of a previous study conducted in Hong Kong.10 Unlike imported cases who are more likely to be tested on arrival irrespective of symptomatology, local cases, especially those who were asymptomatic, might be less likely to receive testing.
There are several limitations of this study that should be addressed. First, this is an observational study including a consecutive sample of patients with COVID-19, and the associations identified might not be used to deduce cause-and-effect relationships. In addition, there are other governmental, community and individual-level factors that could influence the chance of acquiring and transmitting infection,34 including changes in the number of imported cases in other countries and variation of their infection control policy over time. These include the proportion of populations practising personal hygienic measures such as face masking,35 where data were not available; the vulnerability and lack of coping capacity of the city in mitigation of the pandemic; and COVID-19 testing policies as well as the willingness of suspected patients to receive those tests.36–38 Also, the baseline characteristics of patients in the two waves and hence their testing efforts may be different. Lastly, ethnicity data were not available in the source of data used in this study. A recent evaluation performed in England showed that people of the Black, Asian, Mixed-race and Ethnic minorities were at an increased risk of COVID-19 infection, implying that ethnicity could be regarded as an individual’s COVID-19 risk.39
Conclusion
In summary, we have provided evidence on the effectiveness of public health measures on the control of the epidemic; compared the characteristics of patients and clusters in the two epidemic waves; and the factors associated with containment delay. These findings will contribute to a more in-depth understanding of the disease, and inform physicians and policymakers in formulation and implementation of pandemic mitigation strategies.
Acknowledgments
We would like to thank the Centre for Health Protection, Department of Health, Hong Kong SAR that made information of confirmed COVID-19 cases publicly available, which enabled our detailed analysis. We thank Sylvia LY Tong for her assistance in infographic design.
References
Supplementary materials
Supplementary Data
This web only file has been produced by the BMJ Publishing Group from an electronic file supplied by the author(s) and has not been edited for content.
Footnotes
MCSW and RWYN are joint first authors.
Handling editor Seye Abimbola
Contributors PKSC and MCSW participated in the conception of the research ideas, study design, interpretation of the findings, writing of the first draft of the manuscript, and provided intellectual input to the translational aspects of the study. RWYN, KCC, CKCL, JH, ZC and SSB retrieved information from the relevant databases and performed statistical analysis. All authors made critical revisions on the manuscripts and provided expert opinions on implications of the study findings.
Funding The authors have not declared a specific grant for this research from any funding agency in the public, commercial or not-for-profit sectors.
Competing interests None declared.
Patient and public involvement Patients and/or the public were not involved in the design, or conduct, or reporting, or dissemination plans of this research.
Patient consent for publication Not required.
Ethics approval The Survey and Behavioural Research Ethics Committee of the Chinese University of Hong Kong has granted approval for this study (Reference No SBRE-20-006)
Provenance and peer review Not commissioned; externally peer reviewed.
Data availability statement Data are available in a public, open access repository. The data underlying this article are available in the Centre for Health Protection of the Department of Health of the Hong Kong government at https://chp-dashboard.geodata.gov.hk/covid-19/en.html. The data sets were derived from sources in the public domain: https://chp-dashboard.geodata.gov.hk/covid-19/en.html.