Article Text

Abstract
Objective To estimate the prevalence of non-communicable disease (NCD) risk factors in Kerala.
Design A community-based, cross-sectional survey.
Participants In 2016–2017 a multistage, cluster sample of 12 012 (aged 18–69 years) participants from all 14 districts of Kerala were studied.
Main outcome measures NCD risk factors as stipulated in the WHO’s approach to NCD risk factors surveillance were studied. Parameters that were studied included physical activity score, anthropometry, blood pressure (BP), and fasting blood glucose (FBG) and morning urine sample to estimate dietary intake of salt.
Results The mean age was 42.5 years (SD=14.8). Abdominal obesity was higher in women (72.6%; 95% CI 70.7 to 74.5) compared with men (39.1%; 95% CI 36.6 to 41.7), and also higher among urban (67.4%; 95% CI 65.0 to 69.7) compared with rural (58.6%; 95% CI 56.6 to 60.5) residents. Current use of tobacco and alcohol in men was 20.3% (95% CI 18.6 to 22.1) and 28.9% (95% CI 26.5 to 31.4), respectively. The estimated daily salt intake was 6.7 g/day. The overall prevalence of raised BP was 30.4% (95% CI 29.1 to 31.7) and raised FBG was 19.2% (95% CI 18.1 to 20.3). Raised BP was higher in men (34.6%; 95% CI 32.6 to 36.7) compared with women (28%; 95% CI 26.4 to 29.4), but was not different between urban (33.1%; 95% CI 31.3 to 34.9) and rural (29.8%; 95% CI 28.3 to 31.3) residents. Only 12.4% of individuals with hypertension and 15.3% of individuals with diabetes were found to have these conditions under control. Only 13.8% of urban and 18.4% of rural residents did not have any of the seven NCD risk factors studied.
Conclusion Majority of the participants had more than one NCD risk factor. There was no rural–urban difference in terms of raised BP or raised FBG prevalence in Kerala. The higher rates of NCD risk factors and lower rates of hypertension and diabetes control call for concerted primary and secondary prevention strategies to address the future burden of NCDs.
- prevalence
- NCD risk factors
- Kerala
- diabetes
- hypertension
This is an open access article distributed in accordance with the Creative Commons Attribution Non Commercial (CC BY-NC 4.0) license, which permits others to distribute, remix, adapt, build upon this work non-commercially, and license their derivative works on different terms, provided the original work is properly cited, appropriate credit is given, any changes made indicated, and the use is non-commercial. See: http://creativecommons.org/licenses/by-nc/4.0/.
Statistics from Altmetric.com
Strengths and limitations of this study
We provide reliable estimates of prevalence of non-communicable disease (NCD) risk factors in Kerala that can be compared with other studies in India and abroad, as we had used the widely validated WHO STEPS Strategy to NCD Risk Factors Surveillance (STEPS) questionnaire, standard equipment and methods to study a representative sample of adults.
We took the third reading for blood pressure (BP) only when the difference in systolic BP of the previous two readings was >10 mm Hg and that of diastolic BP was >6 mm Hg, a deviation from the WHO STEPS guidelines, which recommend taking three readings for everyone.
The biochemical measurements for serum cholesterol and measurements of hip circumference were not done in this study due to logistic limitations, but they were not the core features of WHO STEPS 1 and 2.
To the authors’ knowledge, no other study on NCD risk factors in Kerala has been done on a state-wide, representative cross-sectional sample.
Introduction
Over two-thirds (67%) of disease burden in India, measured by disability-adjusted life years (DALYs), is attributable to non-communicable diseases (NCDs) and injuries.1 The Indian state-level disease burden estimates suggest significant differences among states in the composition of disease burden.1 Compared with other states in India, the state of Kerala is relatively in an advanced stage of epidemiological transition.2 For example over 90% of premature mortality in Kerala (mortality in the 15–69 years age group) could be attributed to NCDs.2 Nearly a quarter of the total disease burden in DALYs is due to four major NCDs (ischaemic heart disease, stroke, chronic obstructive pulmonary disease and diabetes).1 The increasing proportion of elders (12.6%3) and the adoption of sedentary lifestyles in Kerala might have contributed to the increase in NCDs.3 Considering the gravity of the challenge, the state government has taken up community-based interventions to reduce NCD risk factors (GO(Rt) No 609/2016/H&FWD, dated 24 February 2016 by the Government of Kerala).
While the estimates of disease burden based on modelling of routine health data are useful in planning resource allocation, strategic investments in prevention and management of NCDs require accurate assessment of their prevalence and risk factors. Hence, we conducted a state-wide, cross-sectional survey to estimate the current prevalence of NCD risk factors in Kerala.
Methods
Study settings
The state of Kerala, in South India, has a population of 33.4 million4 and an area of 38 863 square kilometres. Nearly half the population is urban. A cross-sectional survey was conducted in all the 14 districts of Kerala, in both rural and urban areas, from October 2016 to March 2017.
Sampling
To provide separate prevalence estimates for different strata (eg, among male/female and urban/rural residence) of various NCD risk factors with an expected prevalence of 5% (based on the physical inactivity rate of 4.7% among men in rural area in our previous study5) and relative precision of 20%, a sample size of 12 000 adults was arrived at. We also considered a design effect of 1.5 and a response rate of 90% in the sample size estimation.
A multistage, cluster sampling strategy was adopted to identify a representative sample of eligible participants for the cross-sectional survey (figure 1). The primary sampling strata were a defined geographical area administered by one of the local government institutions, that is, municipal corporations and municipalities in urban areas and Grama Panchayats (GPs) in rural areas, which are the lowest tier of administrative units. The population of GPs in Kerala ranges from 20 000 to 40 000. Data were collected from two urban and three rural sites in 12 out of the 14 districts; the single urban site (the districts only have one urban site each) and three rural sites were selected from the other two districts. We surveyed all the municipal corporations (n=6) and a random sample of 20 of 87 municipalities in the urban region. We randomly selected three GPs from each district (the number of GPs per district ranges from 23 to 94, and the total number of GPs is 941).

Study sample selection flow chart.
Each of the primary sampling strata is further divided into wards. We selected 200 out of 390 wards in the municipal corporations and 499 out of 697 wards of the selected municipalities for the survey. All the 724 wards of selected GPs were also selected (figure 1). In the final stage of sampling, we identified a cluster of nine households from each ward. For the selection of a cluster of households, one household was identified randomly from the available list of all the households in the selected ward, followed by the selection of eight more households with consecutive house numbers.
Study participants
All individuals between 18 and 69 years old were eligible to be part of the survey. If there was more than one adult in this age group, the KISH method6 was used to identify one of them from the household. We excluded pregnant women from physical and biochemical measurements.
Patient and public involvement
No patients or public were directly involved in the study. We plan to disseminate the study results to policymakers and the public.
Study measurements
Interview schedule
We used a structured interview schedule based on the WHO STEPS Strategy to NCD Risk factors Surveillance (STEPS),7 and Thankappan et al 5 had already validated the tool in Malayalam. Awareness of diabetes and hypertension status was assessed by asking questions about diagnosis and history of those conditions. The Global Physical Activity Questionnaire (GPAQ) was used to assess physical activity levels.8
Anthropometric measurements
Physical and clinical measurements included height, weight, waist circumference, blood pressure (BP) and heart rate. Trained nurses took all the measurements at participants’ home, ensuring convenience and privacy of the participants. Height was measured in centimetres using a SECA 213 stand-alone stadiometer. Weight was measured in kilograms using a portable SECA 803 battery-operated electronic weighing scale. Participants were asked to remove their footwear and any heavy objects in their bodies, such as mobile phones, wallets and heavy belts, while taking the measurements.
SECA 201 ergonomic retractable tape was used to measure waist circumference, using the following protocol: first, the nurses identified and marked the lower palpable margin of the ribs and the upper margin of the iliac crest, and then they marked the midpoints between these margins along the midaxillary line on both sides. The measurement tape was then wrapped horizontally all around by connecting the marked points on both sides of the participant’s body. Similarly, the nurses documented the height to the nearest 0.5 cm, weight to the nearest 10 g and waist circumference to the nearest 0.1 cm at the end of the normal expiration.
Measurement of BP and pulse rate
BP and pulse rate were measured using standard battery-operated automatic BP monitors (Omron HEM-7120). Before measurement, the participants were seated comfortably in a relaxed upright position for at least 5 min. Appropriately sized cuff was used to take two readings of BP and pulse rate 3 min apart.9 The machine was switched off between the readings, after recording the systolic BP and diastolic BP in mm Hg and the heart rate in beats per minute. If systolic BP readings varied more than 10 mm Hg or diastolic BP readings varied more than 6 mm Hg between the two initial measurements, a third reading was taken. We estimated the final BP by taking the mean of the last two readings.
Biochemical measurements
The nurses gave sample bottles to the participants on the day of the survey, and the participants were instructed to collect 20 mL of the second voiding urine sample (after first voiding in the morning and before breakfast) on the day of the blood sample collection for glucose estimation. Urinary sodium was assessed using indirect ion-selective electrode method in an accredited central laboratory. Modified Kawasaki formula was used to estimate the 24-hour urinary intake of sodium,10 and it was multiplied by 2.54 to estimate daily salt (sodium chloride) intake as advocated by Johnson et al.11 12 Capillary blood glucose estimation was done using point-of-care glucometers (OneTouch UltraEasy, Johnson & Johnson) in the fasting stage. We ensured a minimum of 8 hours of fasting among participants before taking samples and recorded the glucose measurements in mg/dL.
Administration of questionnaire and recording of study measurements
Open Data Kit (ODK) software was used to develop custom-made data entry forms, with display both in English and Malayalam (local language), and handheld computer tablets were used for data collection. ODK is a freely available open source software, and we have integrated a data entry form for the STEPS survey in it with a utility to run KISH method6 for choosing one participant from each household. Thirty-four pairs of trained nurses did the field-level data collection. They carried the computer tablets, glucometer, weighing machine, stadiometer, measuring tape and BP monitors to the interviewee’s house. After obtaining signed informed consent from the participants on printed forms, the survey team (nurses) used computer tablets with internet facility to gather information and record measurements. They also did random blood glucose estimation of the study participants and gave sample bottles for urine collection, with instruction on how to collect the morning samples, and these were collected back in the next morning. The data get sent automatically to the institute server via the internet. The process was monitored daily by the district managers and subsequently by the state project management unit, once a week. We used ODK Briefcase to download the aggregated data.
Quality control
Two senior public health professionals, with vast experience in the conduct of state-level programmes, were entrusted with the field-level supervision and monitoring. They were assisted by 28 (2 per district) middle-level district programme managers. Residential training sessions with hands-on training on data collection (using computer tablets) and standard procedures for physical and biochemical measurements were conducted for the 34 pairs of nurses at four places (Thiruvananthapuram, Ernakulam, Thrissur and Kannur) by the same team of investigators to ensure quality and uniform standards. Data collected were checked by the district programme managers for completeness and consistency, and they gave daily feedback to the data collectors. The district programme managers made regular concurrent and consecutive visits to selected households to ensure quality. ODK helped with quality check, as we recorded the geolocation and time of data collection in each household. In addition to district-level monitoring, we monitored the data collection centrally and sent monthly updates to district programme managers and field staff on any incomplete records, missing data or any inconsistencies.
Definitions
Raised BP, raised FBG and daily salt intake
We defined raised BP as systolic BP ≥140 mm Hg or diastolic BP ≥90 mm Hg, or if the person is currently using antihypertensive medication (self-reported treatment).13 Similarly, we defined raised fasting blood glucose (FBG) as FBG ≥126 mg/dL or self-reported treatment for diabetes, pre-diabetes as FBG in the range of 100–125 mg/dL, and dysglycaemia as those with raised FBG values or pre-diabetes.
Current smoking and alcohol use
We defined current tobacco use as the use of any form of tobacco within the past 30 days,7 and current alcohol use as the intake of at least one standard drink of alcohol in the past 30 days.7
Fruits and vegetable intake
The mean servings of fruits and vegetables per day were as advocated by WHO.7
Daily salt intake
We used the Kawasaki formula to estimate urinary excretion of sodium from the morning urine sample and multiplied the estimate by 2.54 to get daily salt (sodium chloride) intake.
Physical inactivity
We used the GPAQ to estimate the total time spent in physical activity and the intensity of the physical activity during a typical week, to calculate physical inactivity. We defined physical inactivity as a combined score of <600 metabolic equivalent minutes of moderate-intensity and vigorous-intensity physical activity in a typical week.8
Obesity and overweight
We defined obesity14 if the body mass index was ≥30 kg/m2, overweight14 if the body mass index was in the range of 25–29.99 kg/m2, and abdominal obesity15 if the waist circumference was ≥90 cm and ≥80 cm in men and women, respectively.
Clustering of NCD risk factors in participants
Out of the prominent NCD risk factors identified from the previous studies,5 we studied only seven (tobacco use, alcohol use, obesity, abdominal obesity, raised BP, raised blood glucose and physical inactivity) in this survey due to logistic limitations. We analysed the pattern of multimorbidity by estimating the proportions of individuals with no risk factors, any one risk factor, two risk factors, three risk factors and more than three risk factors.
Statistical analyses
We derived sampling weights based on the probabilities of selection at various stages of sample selection and used the inverse of the product of probabilities of sample selection at different stages in sample weighting. Then we normalised the sampling weights to the total sample size.
We used weighted means with 95% CI to summarise quantitative variables and percentages with 95% CI to summarise categorical variables, and applied variance inflation for cluster correction while estimating 95% CI. We used IBM SPSS Statistics V.21 software for Windows and STATA Statistical Software V.14 for analysis.
Results
Sociodemographic characteristics
In total, 12 012 adults in the 18–69 years age group participated in the survey, with a response rate of 93.8%. Nearly half (49.3%) of the participants were urban residents and 63% were women (table 1). The mean age was 42.5 years (SD=14.8). The majority (75.7%) have studied up to primary school level or above, and only a third (36.9%) were designated as economically weak, belonging to the below poverty line category. Nearly three-fourths (73.5%) were married. One of 20 participants (4.8%) was unemployed.
General characteristics of the study population
Behavioural risk factors
The rates of use of tobacco and alcohol were low in women. However, the current use of tobacco and alcohol among men was 20.3% (95% CI 18.6 to 22.1) and 28.9% (95% CI 26.5 to 31.4), respectively (table 2). Physical inactivity was reported in 23.7% (95% CI 21.8 to 25.7) and 20.8% (95% CI 19.0 to 22.8) of men and women, respectively. The average consumption of fruits was only one serving per day among men, women, urban and rural residents, and the intake of vegetables was two servings per day across these subgroups (table 3). There were no significant differences in the rates of alcohol consumption, tobacco use, physical inactivity and consumption of fruits and vegetables between urban and rural residents (tables 2 and 3). The mean salt intake among the participants was 6.7 g/day (95% CI 6.6 to 6.8). Table 3 shows that there was no rural–urban difference, but women had significantly higher salt intake (7.5 g/day) compared with men (5.3 g/day).
Prevalence of NCD risk factors in the study population
Mean levels of risk factors (weighted means) in the study population
Prevalence of raised BP and raised FBG
The weighted mean systolic BP was 129.4 mm Hg (95% CI 128.6 to 130.1) in men and 125.0 mm Hg (95% CI 124.3 to 125.6) in women (table 3). Similarly, the average diastolic BP was 82.6 mm Hg (95% CI 82.1 to 83.1) in men and 79.7 mm Hg (95% CI 79.3 to 80.0) in women. The prevalence of raised BP was 34.6% (95% CI 32.6 to 36.7) in men and 27.9% (95% CI 26.4 to 29.4) in women (table 2). There was no rural–urban difference in terms of systolic or diastolic BP. The mean FBG was 108.6 mg/dL, and there were no men–women or rural–urban differences for this parameter (table 3). One-fifth, 19.8% (95% CI 18.2 to 21.6) of men and 18.8% (95% CI 17.4 to 20.2) of women had raised FBG values, and there was no rural–urban difference (table 2). Additionally, 36% of men and 35% of women were in the pre-diabetes stage. No rural–urban differences were present in the rates of raised BP and raised FBG, and two in five adults (40%; 95% CI 38.6% to 41.3%) had either raised BP or raised FBG.
Among those with a history of hypertension, only 12.3% (95% CI 10.9 to 14.0) had their BP values under control (systolic BP <140 mm Hg and diastolic BP <90 mm Hg). The control rate in men (7.9%; 95% CI 6.4 to 9.7) was less than the control rate in women (15.6%; 95% CI 13.5 to 18.0); similarly, the control rates among rural residents (11.5%; 95% CI 9.8 to 13.5) were less than their urban counterparts (15.9%; 95% CI 13.6 to 18.4).
Among those with hypertension who claimed to be under treatment, 34.1% had their BP under control (28.6% in men, 36.8% in women, 37.4% in urban residents and 33.2% in rural residents); the men–women or rural–urban differences were not statistically significant.
Among those with a history of diabetes, 15.3% (95% CI 13.1 to 17.8) had their blood sugar under control (fasting plasma glucose <126 mg/dL), and among those who claimed to be under treatment 31.1% (95% CI 27.1 to 35.4) had their blood sugar under control. There was no significant men–women difference, but the urban residents were found to have better control (17.0%; 95% CI 13.9 to 20.6) compared with rural residents (14.9%; 95% CI 12.3 to 17.9).
Body mass index, waist circumference and obesity
The mean body mass index was 24.2 kg/m2 (95% CI 24.1 to 24.4), with statistically significantly higher body mass index in women and urban residents, although the magnitude of the difference was negligible (table 3). The weighted mean waist circumference (table 3) was significantly higher for urban residents (88.2 cm; 95% CI 87.6 to 88.8) compared with rural residents (85.8 cm; 95% CI 85.3 to 86.3). Overweight was higher among urban residents (33.5%) and women (31.6%) compared with rural residents (29.7%) and men (28.2%), respectively (table 2). Similarly, abdominal obesity was higher in women (72.6%) and urban residents (67.4%) compared with men (39.1%) and rural residents (58.6%), respectively (table 2).
Clustering of NCD risk factors
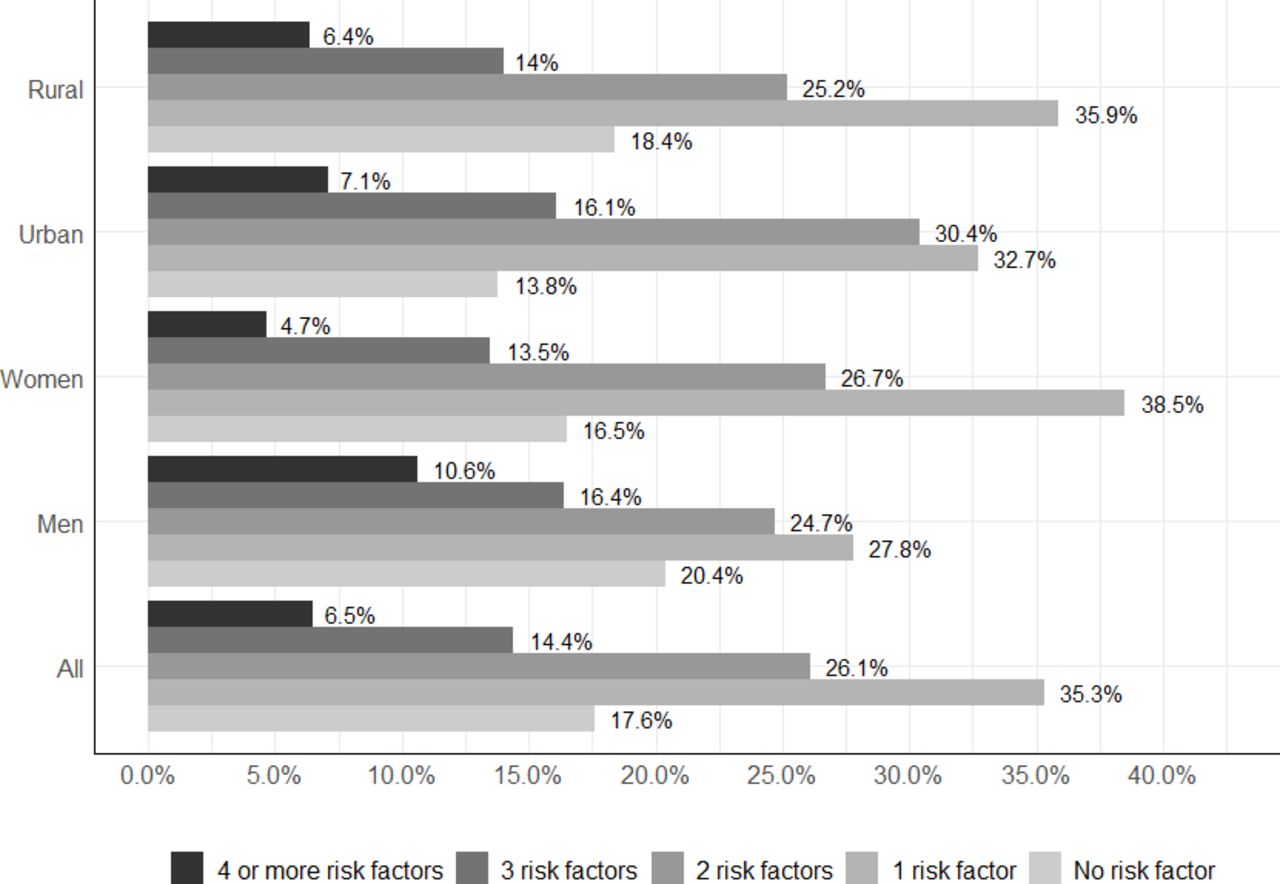
Only 20.4% (95% CI 18.5 to 22.3) of men and 16.5% (95%CI 14.9 to 18.1) of women were free of any of the seven NCD risk factors studied: tobacco use, alcohol use, obesity, abdominal obesity, raised BP, raised blood glucose or physical inactivity (figure 2). The proportion with an isolated risk factor (35.3%) was less frequent than those with multiple risk factors (47.1%), and this trend was the same for all categories: men (27.8% vs 41.8%), women (38.5% vs 45%), rural residents (35.9% vs 45.7%) and urban residents (32.7% vs 53.5%). Three or more risk factors were present in 20.9% and four or more NCD risk factors were present in 6.4% of the participants.

Clustering of non-communicable disease risk factors in the study population.
Discussion
This study found that most adults (82.4%) in the 18–64 years age group in our sample had at least one of the NCD risk factors, and multiple risk factors were present in 47.1%. Raised BP and raised FBG were present in 30.4% and 19.2% of adults in Kerala. The prevalence of overweight was as high as 30.4%, and 60.2% had abdominal obesity, which was significantly higher in women. Moreover, dysglycaemia (raised FBG and pre-diabetes together) was found to be present among 54.5% of the adult population.
The prevalence of hypertension was found to be comparable with the rate in Thiruvananthapuram in 2010 by Thankappan et al (28.8%),5 but less than the rate by Sathish et al (43.2%).16 The prevalence of hypertension in adults in Kerala aged 18–64 years was also similar to the rate of urban residents of the higher age group (30–64 years) in Tamil Nadu (28.5%).17 The prevalence of hypertension in Kerala was also similar to the estimates of the meta-analysis by Anchala et al 18 in urban South India (31.8%).
The prevalence of raised FBG in Kerala was higher than the prevalence of diabetes in urban Delhi (18.1%).19 The prevalence of dysglycaemia in more than half (54.5%) of the adult population poses a challenge to the existing healthcare system to maintain the diseases at the current level and to manage their complications. The increasing behavioural risk factors,16 even among the tribal communities,20 and the higher conversion rate of pre-diabetes to diabetes among Indians21 could be the reason for this much increase in raised FBG.
There could be under-reporting of some of the behavioural risk factors, especially alcohol intake as much public debate on curtailing the availability of liquor has been going on in the state since 2015.22 The weighted mean salt intake in this study (6.7 g/day) was lower compared with the estimate for Delhi, Haryana and Andhra Pradesh, reported by Johnson et al 11 in 2017. The low levels could be partially due to methodological differences, as we have not inflated the values for non-urinary losses of salt, as done by Johnson et al.11 Further the mean salt intake was found to be higher in women in Kerala (table 3) compared with studies elsewhere.11 23 24 There are methodological controversies regarding the use of spot urine to estimate 24-hour sodium excretion25 (using Kawasaki formula), and the apparently low intake of salt in Kerala (compared with other states) needs further research as this hard evidence for salt intake could be the first indication of the reversal of NCD risk factors in Kerala. However, more evidence is needed to substantiate such explanations.
Raised BP or raised FBG, present in over 40% of the adult population, are significant contributors to cardiovascular disease mortality. Clustering of multiple risk factors, a finding reported by other studies from India,26 increases the risk of developing a significant NCD condition/event shortly. NCD risk factors are identified to be associated with the social disparity in India27 and other Asian countries,28 as in the Western population.29 30 The proportion of known individuals with hypertension with normal BP found in this study (12.3%) was low compared with the rates from Iran (49.1%),31 USA (48%)32 and China (18%).33 Similarly, the proportion of individuals with diabetes with FBG values within normal limits was also low in this study (15.3%) compared with the improved rates of control found in Western countries; they could achieve 20% control among people with hypertension and diabetes.34
Mounting evidence on the reduction in NCD risk factors with concerted public health action in other countries35 36 gives a positive impetus to the current strategy for NCD risk reduction efforts in Kerala. Hence, the policy action to address the future NCD burden should focus on single risk factors, and also on several of them simultaneously at the population level. The cumulative effect of acting on multiple risk factors may reduce the total risk substantially and thus avert several future NCD events.
In addition to primary care, provision of drugs and lifestyle counselling for high-risk individuals is necessary to address the rising burden of cardiovascular events.37 However, we do not have enough evidence on the feasibility of such an approach in middle-income countries.38 Moreover, in Kerala, despite the high literacy rate and the success stories of implementation research in cardiovascular risk factors,3 39 40 we have the situation of higher prevalence and poor control of hypertension and diabetes. Further indepth research using qualitative methods might help us to understand these dilemmas.
Strengthening the primary care in Kerala, with a focus on addressing NCD risk factors and providing universal access to antihypertensive and antidiabetic medicines to all eligible patients, should be a high priority of the Government of Kerala to reduce future burden of NCDs. The study is timely as the results could be used for the Universal Health Coverage initiative in Kerala, where the government is upgrading many peripheral hospitals to family health centres, with additional inputs in staff and facilities. The high prevalence of NCD risk factors in Kerala calls for urgent policy action for primary and secondary prevention.
Strengths and limitations of the study
We did a state-wide study on NCD risk factors in Kerala, using trained nurses, standard equipment, validated research tools and modern utilities such as handheld computer tablets. The use of the WHO STEPS framework for the questionnaire enables the comparison of studies done within India and abroad.7 The use of mobile data entry platforms, as we did in this study, is proven to improve the quality and timeliness of STEPS surveys.7 41 We had taken the third reading of BP only when the difference in systolic BP of the earlier two readings9 was >10 mm Hg and that of diastolic BP was >6 mm Hg (we did third reading in only 18.2% of the participants), which is a deviation from the WHO STEPS guidelines,7 which recommend taking three readings for everyone. We state this as a limitation of the study. We could not do serum cholesterol and hip circumference measurements due to logistic limitations, but they are not the core features of the first two phases of the STEPS guidelines.42 To the authors’ knowledge, no other published study on NCD risk factors in Kerala in the recent past, including those by the same group of researchers, has been done on a state-wide scale.
Conclusion
About 40% of the adult population in Kerala had either raised BP or raised FBG, and the overall control rates for these conditions were as low as 12% and 15%, respectively. Majority of the adult population (83%) had at least one NCD risk factor, and clustering of risk factors was very common. The high prevalence of NCDs and their risk factors in Kerala calls for urgent policy action for prevention at all levels.
References
Footnotes
Contributors PSS, RPV and MRN contributed to the design, data analysis, data interpretation and review of the manuscript. RS contributed to the concept, data interpretation and review of the manuscript. JVT contributed to the design, data analysis, drafting and review of the manuscript. BS contributed to the design, data acquisition, data analysis, data interpretation, drafting and review of the manuscript. KS contributed to the design, data interpretation and review of the manuscript. ASP contributed to the design, data acquisition, data analysis, data interpretation and review of the manuscript. PJ contributed to the data analysis, data interpretation, drafting and review of the manuscript. KRT contributed to the concept, data acquisition, data interpretation and review of the manuscript. RVK contributed to the concept, data interpretation and review of the manuscript.
Funding Financial support for this survey was provided by a grant given by the Government of Kerala to Sree Chitra Tirunal Institute for Medical Sciences & Technology (GO (Rt) No 609/2016/H&FWD, dated 24 February 2016) for the prevention and control of non-communicable diseases in Kerala.
Competing interests None declared.
Patient consent for publication Not required.
Ethics approval All participants of the study have given written informed consent. The Institutional Ethics Committee of SCTIMST, Trivandrum formally approved the conduct of the study (SCT/IEC/902/MAY-2016 dated 11 May 2016).
Provenance and peer review Not commissioned; externally peer reviewed.
Data availability statement Data are available upon reasonable request.