Article Text

Abstract
Armed conflicts are widespread in sub-Saharan Africa and considered to be an important factor in slowing down national progress in reproductive, maternal, newborn and child health (RMNCH). The measurement of the impact of conflicts on national levels and trends in RMNCH is difficult. National surveys conducted before and sometimes during and after conflicts are a major source of information on the national and local effects of conflicts on RMNCH. We examined data from national surveys in 13 countries in sub-Saharan Africa with major conflicts during 1990–2016 to assess the levels and trends in RMNCH intervention coverage, nutritional status and mortality in children under 5 years in comparison with subregional trends. The surveys provide substantive evidence of a negative association between levels and trends in national indicators of RMNCH service coverage, child growth and under-5 mortality with armed conflict, with some notable exceptions. National surveys are an important source of data to assess the longer term national consequences of conflicts for RMNCH in most countries, despite limitations due to sampling and timing of the surveys.
- reproductive health
- maternal newborn and child health
- armed conflict
- household surveys
- Africa
- child mortality
- child growth
- coverage of interventions
This is an open access article distributed in accordance with the Creative Commons Attribution Non Commercial (CC BY-NC 4.0) license, which permits others to distribute, remix, adapt, build upon this work non-commercially, and license their derivative works on different terms, provided the original work is properly cited, appropriate credit is given, any changes made indicated, and the use is non-commercial. See: http://creativecommons.org/licenses/by-nc/4.0
Statistics from Altmetric.com
- reproductive health
- maternal newborn and child health
- armed conflict
- household surveys
- Africa
- child mortality
- child growth
- coverage of interventions
Summary box
Armed conflict can have negative consequences on reproductive, maternal, newborn and child health (RMNCH), but the effects on the levels and trends in national indicators are difficult to measure.
This analysis of the results of national health surveys conducted during and after conflicts in 13 countries in sub-Saharan Africa with major armed conflicts during 1990–2016 provides substantive evidence of a negative association between armed conflict and national indicators of RMNCH service coverage, child growth and under-5 mortality in most countries.
Surveys are a critical data source which, in combination with further analysis of the distinct features of each conflict as well as the RMNCH programme data collected to measure conflict impact, can provide a better assessment of the national impact of armed conflicts on RMNCH.
Introduction
Many countries in sub-Saharan Africa have been affected by civil or intrastate war and, to a lesser extent, interstate wars during the past decades. The Uppsala Conflict Data Program (UCDP) recorded nearly 1.1 million battle-related deaths in sub-Saharan Africa during 1989–2016, with more than half of the countries involved in a conflict at some point in time.1 Furthermore, almost all countries were affected by population displacement, which averaged 6.4 million refugees and internally displaced persons each year during 1989–2016, with a low at 3.0 million in 2004 and a peak at 14.3 million in 2016.2
Armed conflicts can affect reproductive, maternal, newborn and child health (RMNCH) through direct exposure to violence, as well as through indirect effects of social and economic disruption, such as reduced access to quality health services, food shortages, and lack of shelter, safe water and sanitary facilities.3 The capacity to deliver services may be undermined due to the loss or diversion of healthcare personnel and the disruption of supply chains, referral networks, communication and supervision, reducing access to and quality of RMNCH preventive and curative services. These effects are likely to be largest in areas most proximal to conflict but, depending on the conflict magnitude and duration, national progress in RMNCH may also be affected through societal disruption and an overall deterioration of the functioning of the country’s health system, as resources are shifted and governance of the social sector is affected by the conflict. The presence of political instability or violent conflict is one of the most important governance determinants of RMNCH intervention coverage.4
Evidence of the impact of conflicts on RMNCH is often biased as much of the data come from more stable, protected settings such as long-term refugee camps.5–8 Local survey and surveillance data have shown the negative impact of conflicts on child health as measured by mortality,9–12 morbidity13–15 and malnutrition16–18 in multiple settings. The measurement of indirect and longer term effects on RMNCH has received limited attention but is considered to be much larger than the direct effects.19 A recent study based on geospatial analysis of conflict location and survey cluster data in sub-Saharan Africa showed major effects of severe conflict events on infant mortality among children living within 50 km for up to 8 years following the conflict event.20
The measurement of the impact of conflicts on RMNCH in countries is fraught with difficulties. National surveys, notably Demographic and Health Surveys (DHS)21 and Multiple Indicator Cluster Surveys (MICS),22 conducted before, during and after conflicts are often the only source of information on national trends in RMNCH but may be affected by sampling or other implementation issues. We assessed the extent to which national surveys can help document the association between armed conflict and national trends of RMNCH coverage of interventions, child growth and child mortality, by comparing conflict-affected countries with subregional levels and trends in sub-Saharan Africa.
Country exposure to conflict
National data on battle-related deaths were extracted from the UCDP, available from 1989.1 We computed population mortality rates due to battle-related deaths per 100 000 population for each year during 1990–2016 to assess the intensity and duration of the conflict from a national perspective. Country years of conflict were identified based on an arbitrary threshold of a minimum battle-related mortality rate of 5 or more per 100 000 population. The end of a conflict is often difficult to determine, as many conflicts tend to linger, even if a formal end such as a peace agreement has been achieved.23 We considered the conflict period as ended if it was followed by 3 years of battle-related mortality below 5 per 100 000. We also analysed data on displacement based on internally displaced persons and refugee data from the United Nations High Commissioner for Refugees database,2 but did not use these data to identify conflict years as the data were incomplete for several countries.
Table 1 shows the battle-related mortality per 100 000 population for the most affected countries, as well as the year in which national DHS or MICS surveys were conducted. We included 17 countries with at least two consecutive years of battle-related mortality rates of 5 per 100 000 or higher. Somalia, South Sudan, Central African Republic and Nigeria did not conduct DHS or MICS during or after conflicts and were excluded. The remaining 13 countries included countries with long-term national or localised conflicts and short-term conflicts such as the Eritrea–Ethiopia war in 1999–2000. The displacement rates often remained high for prolonged periods after the high battle-related mortality period. The trends in battle-related mortality and displacement rates, as well as the results for coverage, child growth and child mortality, are shown for each country in online supplementary file part C.
Battle-related deaths (per 100 000 population), countries most affected by conflict according to national battle-related mortality rates, sub-Saharan Africa, 1989–2016 (□ denotes national DHS or MICS conducted)
National surveys in conflict-affected countries
We used data from 170 DHS and MICS conducted in sub-Saharan Africa since 1986, including 53 surveys in the 13 conflict-affected countries. National surveys may be biased during the active or lingering phase of a conflict as sampling design and implementation are affected by the displacement of people and insecurity. Specific sampling clusters may have to be excluded a priori because of security risks, while survey implementation may be further affected by inability to visit insecure clusters or households. Recent examples of exclusion of survey clusters because of insecurity in the most affected areas include northern Mali (Tombouctou and Gao regions in the MICS 2015) and northern Nigeria (Borno and Yobe states in the DHS 2013).
Most surveys in the 13 countries did not report major sampling problems, with over 95% of the selected clusters visited and consistently high household and individual response rates. Sampling problems were encountered in Uganda national surveys until 2006, where parts of the north were excluded because of insecurity: the whole northern region except West Nile in 1988/1989, one district in 1995, and two of the ten northern districts in 2001. In MICS 2001 in the Democratic Republic of Congo, 32 of 365 clusters (9%) could not be visited because of security problems or could not be found. In Sierra Leone, 17 of the 225 selected clusters (8%) in MICS 2000 were excluded because of inaccessibility or hostilities between government and rebels. For most DHS and MICS surveys, no major problems were reported, except for the exclusion of a few clusters that were affected by local conflict. The impact on national levels and trends of excluding sample clusters is likely to be limited, unless this involves more than 10% of sampled clusters. The effect on subnational rates can however be substantial.
Survey data quality may also be affected by inaccurate sampling frames because of the conflict-related movement of people. The listing of households prior to the survey fieldwork may address this problem, but populations that have moved away and live in transient settings are more likely to be missed. Internally displaced persons may be more likely excluded because their new or temporary households are not listed or because they are not reported as individuals temporarily living in other households. Deaths among displaced populations are more likely to be missed. Refugee camps are generally excluded. The only exception was the DHS 2006 in Uganda where the coverage and stunting estimates for the refugee population were similar to the general population.24
The analyses focused on the levels and trends in coverage of RMNCH interventions, child anthropometry and child mortality derived from the national surveys. We compared the conflict-affected countries with the subregional trends during the different phases: preconflict, during conflict, 0–4 years postconflict and 5–9 years postconflict during the period 1990–2016. In a few countries we used data from surveys conducted pre-1990 to improve the trend analyses, if we did not have sufficient data to assess the preconflict situation. We computed subregional trend data for coverage and child growth in West and Central Africa and in Eastern and Southern Africa based on the Unicef classification of countries, using a penalised B-spline regression analysis of all available national survey data between 1986 and 2016 with multiple imputations for missing data years based on Markov chain Monte Carlo methods and weighting by country-year population size (online supplementary file, parts A and B).
Supplemental material
Association with coverage of interventions
To obtain a general picture of the coverage of RMNCH interventions, we computed the Countdown Composite Coverage Index (CCI) from the survey data.25 The CCI comprises eight indicators in four intervention areas: family planning (demand satisfied with modern methods); maternal and newborn care (four or more antenatal visits and skilled attendant at birth); immunisation (BCG, three doses of Diphteria-Tetanus-Pertusses (DTP) and measles vaccinations); and childhood illness treatment (health facility visit for suspected pneumonia and oral rehydration solution use for diarrhoea).26 The CCI is a robust measure across the continuum of care from family planning to pregnancy to child health; it has been used to assess inequalities and trends and is strongly associated with child mortality.27 We used one antenatal care visit instead of four or more visits, as the earlier surveys did not provide sufficient information on the number of visits.
Compared with the subregional values, the median CCI of the 13 countries was 5.5% lower in surveys during conflict years, 2.1% lower in surveys during the first 5 years after the end of a conflict and 5.8% higher in the first survey at least 5 years after a conflict (figure 1 and online supplementary file 1 appendix D). These patterns were more pronounced in the countries in Eastern and Southern Africa. Several countries present evidence of rapid coverage improvements following the end of conflicts. Rwanda surveys showed the most dramatic drop in the CCI during the conflict phase, an initial slow recovery until 2005, followed by a very rapid increase to well above the regional average by 2010. While Rwanda’s remarkable recovery from about 2005 has been well documented,28 29 Burundi also experienced dramatic coverage improvements during the same period at the tail end of its long-lasting conflict during 2005–2010. Also Uganda data show a major increase after the 2006 survey.
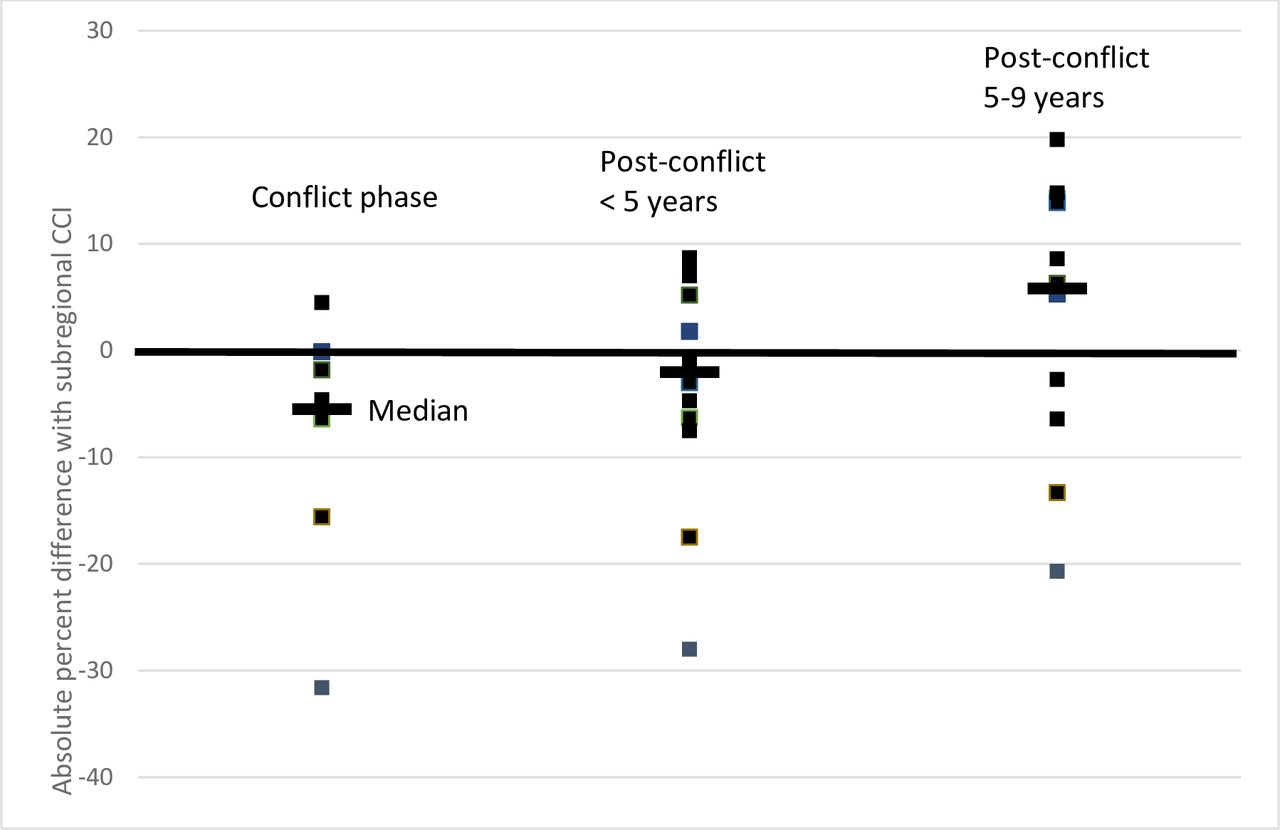
RMNCH CCI in conflict-affected countries based on surveys conducted during the conflict phase, within 5 years postconflict and 5–9 years postconflict: absolute difference of each country CCI and subregional estimates for Eastern and Southern Africa and for West and Central Africa for the survey year. CCI, Composite Coverage Index; RMNCH, reproductive, maternal, newborn and child health.
In West and Central Africa, the postconflict increases were most pronounced in Congo, Liberia and Sierra Leone, and accelerated from 5 years after the conflict end. Sierra Leone was slightly higher than the subregional average in the MICS 2000, which was conducted at the tail end of the decade-long conflict. The survey did not include 8% of clusters because of insecurity: if we assume the worst-case scenario of zero coverage in those clusters, the CCI drops from 43.4% to 40.1%. The Democratic Republic of Congo and Chad both had long-running conflicts at varying levels of intensity and remained below the subregional trend.
In Uganda and the Democratic Republic of Congo, the concentration of the conflicts in the northern and eastern parts of the country, respectively, allows an assessment of survey implementation and subnational trends in the most affected areas. Within Uganda, there is no clear evidence that the CCI in the North was lower than in the West or East, but the exclusion of the most affected districts in the earlier surveys limits the generalisability of the findings in surveys prior to 2006. If no woman or child received any intervention in the clusters excluded for security reasons in the 1995 and 2001 DHS, the CCI in North Uganda would drop by seven percentage points to 44% in 1995 and by 10 percentage points to 42% in 2001, showing the potential impact on the results of excluding survey clusters in the most conflict-affected areas.
In the Democratic Republic of Congo, coverage in North Kivu province was higher than national coverage in all surveys during 2001–2013, even though there was a decline in the more recent surveys (online supplementary file part C). South Kivu province had the lowest CCI in the country in 2001 but increased rapidly and was close to the national average in the other three surveys. Exclusion of selected clusters was only a problem in the 2001 MICS survey, where 9% of selected clusters could not be visited because of security problems or could not be found. The report however did not provide information on the location of these clusters. DHS 2013/2014 reported that only 4 out of 430 clusters could not be visited, including 1 out of 32 clusters in North Kivu. The effects on the provincial and national results are small.
Association with child growth
For child growth we used national data on stunting and wasting among children under 5 years of age obtained from the United Nations Joint Malnutrition Estimates data set.30 This data set is based on anthropometric data generated by surveys including DHS and MICS. Wasting or severe acute malnutrition is a common indicator to assess the impact in the acute phase,16 while stunting rates may reflect longer term effects.
Stunting levels in conflict-affected countries were generally higher than the subregional trends with little improvement postconflict. The median levels of stunting were 3.2% higher in surveys during conflict years, 3.3% higher in the first 5 years postconflict and 5.2% in the surveys after that period compared with the subregional stunting rates (figure 2). National surveys in Rwanda, Uganda and Liberia provided evidence of accelerated postconflict declines in stunting rates, reaching lower levels than the respective subregions in the most recent surveys. Burundi and the Democratic Republic of Congo, both countries with long-running lingering conflicts, had much higher levels of stunting than the subregions, with little evidence of a reduction of the respective gaps.
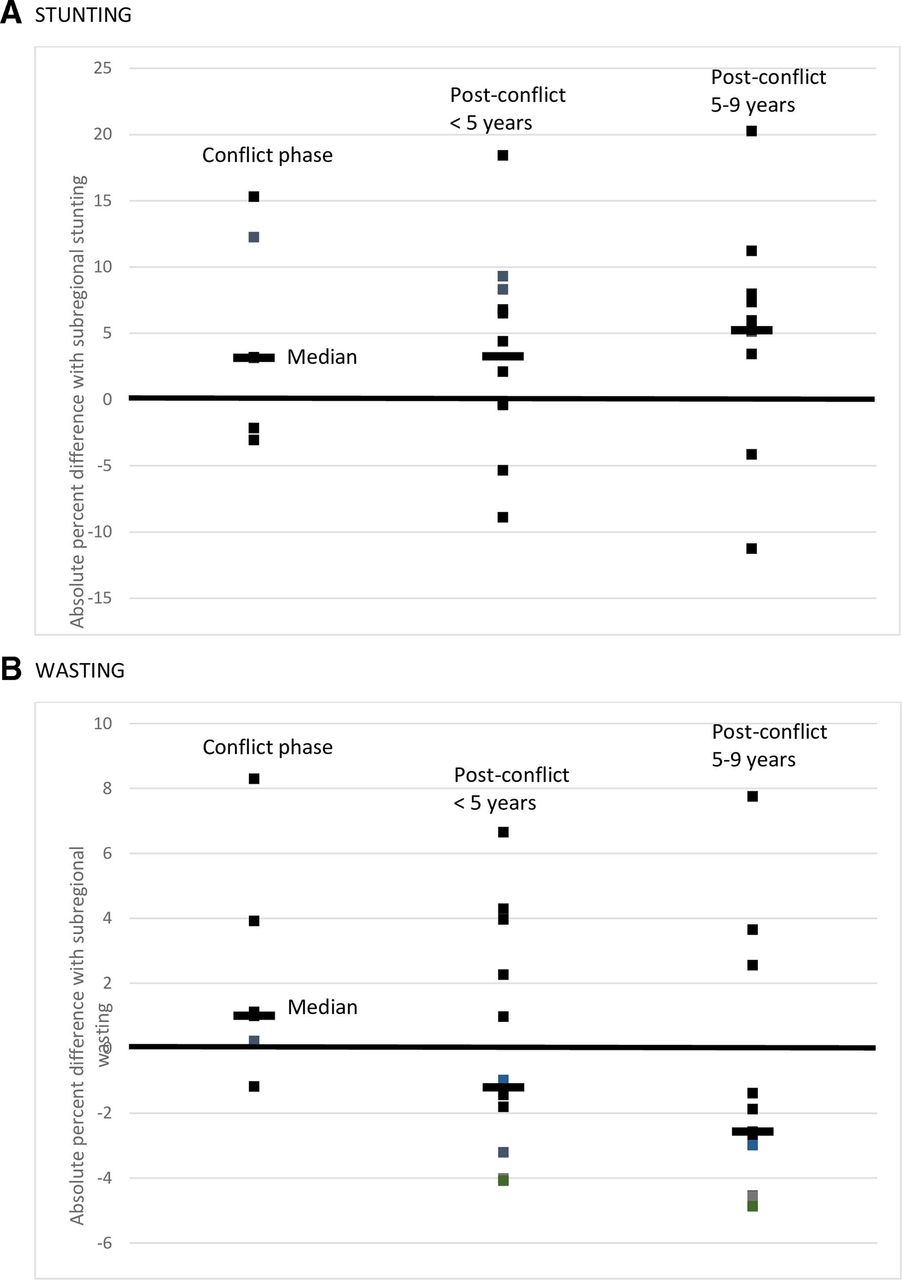
Stunting (A) and wasting (B) among children under 5 years in conflict-affected countries based on surveys conducted during the conflict phase, within 5 years postconflict and 5–9 years postconflict: absolute difference of each country CCI and subregional estimates for Eastern and Southern Africa and for West and Central Africa for the survey year. CCI, Composite Coverage Index.
Wasting levels were on average 1.0% higher in surveys conducted during the conflict phase and 1.2% and 2.2% lower in surveys conducted during 0–4 and 5–9 years following the end of conflict, respectively, compared with the subregional averages for the year of the survey (figure 2).
Association with under-5 mortality
Data on mortality among children under 5 years of age were obtained from the estimates published by United Nations Interagency Group on Child Mortality Estimation (UN-IGME),31 which uses survey and census data and fits a model to obtain the mortality levels and trends. The mortality data are retrospective, collected through birth histories. Therefore, it is possible to reconstruct an annual trend in mortality that may capture the effect of conflict on child mortality from postconflict surveys, even though the accuracy of such annual under-5 mortality estimates may be affected by survivor bias and recall bias related to conflicts or birth histories in general.32 Only in the case of Rwanda the UN-IGME made a direct crisis adjustment of the child mortality rates, using other sources than the main surveys and censuses.
National under-5 mortality rates were higher than the subregional average during the active or lingering conflict phase in 10 of the 13 countries (on average 19 under-5 deaths per 1000 live births higher). The mortality declines in the conflict-affected countries, excluding the short-term conflict countries (Eritrea, Ethiopia, Guinea-Bissau and Chad), were 1.1% slower, 1.7% faster and 1.8% faster than the subregional declines during a conflict, 0–4 years postconflict and 5–9 years postconflict, respectively (figure 3). The strongest effects of conflicts on national child mortality trends were observed in Rwanda, Uganda, Angola and Mozambique (online supplementary file parts C and D)). The evidence of an influence of the conflict on the mortality trend was absent or weak in Liberia and Sierra Leone despite a decade of devastating war. Further analyses of the effect on neonatal and infant mortality may be worthwhile but were not conducted, and we did not analyse the association of conflict with national maternal mortality trends given sparsity of data and large uncertainty of such statistics, while evidence from protracted camp settings is limited.5–7

Difference of the average annual rate of change (AARC) in under-5 mortality between each conflict-affected country and the subregional trends for Eastern and Southern Africa or West and Central Africa (negative value indicates absolute per cent slower decline than the subregion).
Conclusions
National surveys conducted during and after conflicts in the 13 countries in sub-Saharan Africa provide substantive evidence of a negative association between armed conflict and national RMNCH service coverage, child growth and under-5 mortality. The most important evidence was related to the major improvements in the rates postconflict for coverage, wasting and under-5 mortality, which occurred in most countries, reducing the gaps with other countries in the same region. There was no demonstrable improvement in national stunting rates postconflict with a few exceptions.
In some countries, the survey data did not register a clear association of the conflict with RMNCH. Most notably, the postconflict surveys in Liberia, and to a lesser extent Sierra Leone, both with severe long-running conflicts, provided little evidence. This may be due to specific issues with survey implementation, such as major displacement affecting the sampling. The short-term conflict in Congo and the Ethiopian–Eritrea war had limited effects on national trends, even though direct local associations with increased child stunting have been demonstrated in Eritrea.17 In some cases, the results may be true as a result of a sustained emergency response to a conflict. Possible subnational examples include North Uganda, and North and South Kivu in the Democratic Republic of Congo, where intervention coverage levels were surprisingly close to the national levels despite long-running conflicts. Given the heterogeneity of conflicts and available survey data between countries, we did not attempt to provide an estimate of the overall impact of conflicts for sub-Saharan Africa as a whole.
It is not possible to attribute the levels and trends in coverage, stunting and mortality to the conflicts. We used a comparison with subregional levels and trends to assess the status and progress in preconflict, during conflict or postconflict. The effects should be considered a minimum estimate as we included all countries in the subregional reference populations. Many countries in sub-Saharan Africa were affected by conflicts or governance challenges at some point in time during 1990–2016, while others experienced humanitarian emergencies caused by environmental disasters such as droughts, which may greatly affect health and nutrition.33 Furthermore, the consequences of violent conflict are often highly complex and variable.34 Countries may simultaneously be both refugee-sending and refugee-hosting countries, and the levels of humanitarian and development assistance during conflict and postconflict may mitigate negative impacts. There was only limited evidence of a relationship between the size, duration and intensity of a conflict and the impact on RMNCH. Rwanda had the highest battle-related mortality rates and also the greatest effect on RMNCH, and localised conflicts had more limited national impact. On the other hand, Liberia has the second most severe conflict in terms of battle-related mortality rates, but the evidence of association with RMNCH was limited.
The size of the impact of conflict on women’s and children’s health is likely to depend on the nature, location, intensity and duration of the conflict, the resilience of existing health systems, the level of humanitarian assistance available for affected populations, and the postconflict recovery. The UCDP data set was used to classify countries but has its limitations in terms of completeness which is difficult to quantify. We also had to exclude recent or long-running conflicts, such as in Somalia, South Sudan and the Central African Republic, because of a lack of recent survey data. Pre-existing levels of RMNCH coverage, child growth deficits and child mortality are important factors as well. Recent analysis showed that the local impact of conflict can be measured through geospatial analyses that link conflict location and survey cluster.20 Our analyses show that national health surveys, notably DHS and MICS, can also contribute to an overall assessment of the effects of conflicts on national RMNCH services, child growth and mortality, when sampling issues are taken into account. Additional survey questions on conflict-related mortality and displacement history could provide even richer data for more direct analysis of the impact on RMNCH.35 The surveys provide critical national RMNCH trend data which, in combination with further analysis of the distinct features of each conflict, RMNCH programme data and further investments in measuring immediate conflict impact,36 can provide a better assessment of the national impact of armed conflicts on RMNCH.
References
Footnotes
Handling editor Seye Abimbola
Contributors TB conceptualised the paper and wrote the first draft. All authors contributed to multiple revisions. AJDB and CV conducted the analyses of the survey data to provide estimates of coverage. DYM led the estimation work for comparative analyses.
Funding This work was supported by a grant of the Bill and Melinda Gates Foundation to the Countdown to 2030 for Women’s, Children’s and Adolescents’ Health.
Competing interests None declared.
Patient consent for publication Not required.
Provenance and peer review Not commissioned; externally peer reviewed.
Data sharing statement All data are available in the public domain.
Author note This paper is part of a supplement that aims to address the challenges in measurement and monitoring women’s, children’s and adolescents’ health in the context of the sustainable development goals. The series includes improved ways to measure and monitor inequalities, drivers of women’s, children’s and adolescents’ health especially governance, early childhood development, reproductive maternal and child health in conflict settings, nutrition intervention coverage, and effective coverage of interventions. These papers were developed as part of an initiative of the multi-institutional Countdown to 2030 for women’s, children’s and adolescents’ health, presented at a Countdown measurement conference in 31 January to 1 February 2018 in South Africa, and benefited from reviews by members of the Countdown working groups.