Article Text

Abstract
Introduction Longer travel times are associated with increased adverse maternal and perinatal outcomes. Geospatial modelling has been increasingly used to estimate geographic proximity in emergency obstetric care. In this study, we aimed to assess the correlation between modelled and patient-reported travel times and to evaluate its clinical relevance.
Methods Women who delivered by caesarean section in nine hospitals were followed up with home visits at 1 month and 1 year. Travel times between the location before the delivery and the facility where caesarean section was performed were estimated, based on two models (model I Ouma et al; model II Munoz et al). Patient-reported and modelled travel times were compared applying a univariable linear regression analysis, and the relation between travel time and perinatal mortality was assessed.
Results The median reported travel time was 60 min, compared with 13 and 34 min estimated by the two models, respectively. The 2-hour access threshold correlated with a patient-reported travel time of 5.7 hours for model I and 1.8 hours for model II. Longer travel times were associated with transport by boat and ambulance, visiting one or two facilities before reaching the final facility, lower education and poverty. Lower perinatal mortality was found both in the group with a reported travel time of 2 hours or less (193 vs 308 per 1000 births, p<0.001) and a modelled travel time of 2 hours or less (model I: 209 vs 344 per 1000 births, p=0.003; model II: 181 vs 319 per 1000 births, p<0.001).
Conclusion The standard model, used to estimate geographical proximity, consistently underestimated the travel time. However, the conservative travel time model corresponded better to patient-reported travel times. The 2-hour threshold as determined by the Lancet Commission on Global Surgery, is clinically relevant with respect to reducing perinatal death, not a clear cut-off.
- maternal health
- geographic information systems
This is an open access article distributed in accordance with the Creative Commons Attribution Non Commercial (CC BY-NC 4.0) license, which permits others to distribute, remix, adapt, build upon this work non-commercially, and license their derivative works on different terms, provided the original work is properly cited, appropriate credit is given, any changes made indicated, and the use is non-commercial. See: http://creativecommons.org/licenses/by-nc/4.0/.
Statistics from Altmetric.com
Key questions
What is already known?
Increased travel times to a facility are associated with increased risk of adverse perinatal outcomes.
Geospatial modelling has been increasingly used to estimate geographical proximity to health facilities.
Geospatial modelled travel time can significantly underestimate the reported travel time.
What are the new findings?
Conservative travel time models correspond better with patient-reported travel times.
With respect to the risk of perinatal death, the 2-hour threshold as determined by the Lancet Commission on Global Surgery, is clinically relevant but not a clear cut-off.
What do the new findings imply?
Geospatial travel time models must be interpreted with caution.
Input variables for geospatial travel time modelling should be carefully selected.
Introduction
Universal Health Coverage and the health aspirations defined by the Sustainable Development Goals will not be achieved without access to, and availability of, affordable and safe surgical and anaesthesia care.1 This includes access to caesarean sections as an integral part of comprehensive emergency obstetric care, which can save the lives of both mother and neonate when performed for the appropriate indications and at the right time.
Studies from Rwanda, Wales, France and the Netherlands have shown an increased risk of adverse perinatal outcomes with longer travel time from home to hospital.2–5 For obstetric emergencies, 2-hour access has been widely accepted as the critical time from postpartum haemorrhage to death if no intervention is provided.6 However, there is no evidence supporting an exact 2-hour cut-off. The Lancet Commission on Global Surgery (LCoGS) adapted this benchmark, setting the target that 80% of the population should live within 2 hours of a facility that can perform caesarean sections, laparotomies and treatment of open fractures.1 This geographical proximity indicator has been included in WHO 100 Core Global Health Indicators.7 Still, few countries have reported on this indicator,8 such that the global community needs a robust tool to measure geographic proximity in order to plan and monitor access to care.
Geospatial modelling has increasingly been used to estimate geographical proximity to healthcare,9 including emergency obstetrics.10 However, different geospatial models apply different input variables, such as travel speeds and road network standards.11–15 These selected input variables are often not validated, and little is known about how modelled travel times relate to patient-reported travel times.
A recent single-facility study from Rwanda comparing patient-reported travel time with geospatial modelled travel time concluded that the latter significantly underestimated real travel time.16 Possible reasons for this deviation include applied assumptions about modes of transport, travel speeds and travel routes. In the present study, we extended the analysis to nine hospitals across all regions of Sierra Leone, and we compared reported travel times with estimates produced by two geospatial models.
The aim of this study was to assess the correlation between travel time reported by patients and travel time estimated by two geospatial models and to evaluate the relation between travel time and perinatal mortality.
Methods
Sierra Leone, in West Africa, reports some of the world’s worst maternal and perinatal health outcomes.17 More than half (54.4%) of the deliveries take place in a health facility,18 either in one of the 1160 primary healthcare units, or 24 public or 30 private hospitals.19 The national population caesarean section rate is 2.9%,20 far below the suggested threshold of 10%–19%,21 22 and reflects limited access to emergency obstetric services in the country. Delayed and substandard care results in a perinatal mortality rate after caesarean section of 190 per 1000 births,18 much higher than the national perinatal mortality rate of 39 per 1000 pregnancies.23
Study participants
This study was part of a prospective multicentre audit comparing outcome of caesarean sections performed by medical doctors and associate clinicians in nine hospitals in Sierra Leone.23 24 The study facilities consisted of four district hospitals, one regional hospital, the national maternity referral hospital and three private non-profit hospitals, located in all geographical regions of Sierra Leone. Women who underwent a planned caesarean section were excluded from the analysis.
Data collection
In each of the participating hospitals, anaesthesia team members were trained to enrol patients and do the in-hospital data collection. Data collection was supervised and reviewed by the primary investigator, during hospital visits at 1–3 weeks intervals, throughout the whole study period. Data were entered into a Microsoft Excel 2016 database in the study facilities and inconsistent or missing data were supplemented from operation logbooks or patient files. During admission, the following data was collected: the patient’s address before coming to the hospital; patient-reported estimated time from the place of stay before the delivery to the facility where the caesarean section was performed; other health facilities visited en route to the hospital; and clinical process and outcome data. Except for clinical data, information was provided by patients and their relatives. Follow-up home visits were conducted at 1 month and 1 year after discharge by four research nurses. During the home visits, data collected while admitted was verified, information regarding the means of transport to the hospital was collected and geolocations were recorded. OpenStreetMap was used to review all geospatial data regarding location before coming to the hospital.25
Geospatial modelling
Two previously published geospatial models were used to create travel time maps. The first (model I) was based on the methods described by Ouma et al11, which overestimated geographical access compared with patient-reported travel time in a recent study.16 Several more conservative national models have been published from Rwanda, Ghana, Tanzania and Zambia.12–15 As a sensitivity analysis, the model from Rwanda (Huerta Munoz et al12, walking and public transport scenario) was applied to our data set as it presented the most conservative travel time estimates. Minor adjustments were made to both models to increase the reproducibility (table 1).
Comparison of two geospatial models
Based on the two models, two maps were generated for each of the nine study hospitals (see online supplemental figure 1), using the open-source WHO tool AccessMod V.5.6.0,26 freely available geospatial data and geographical information systems (GIS) desktop software (QGIS V.3.12, Open Source Geospatial Foundation Project). The input layers for each map analysis were a Digital Elevation Model (DEM) with a resolution of 94 m and a vegetation map extracted from the 2016 Africa land cover (Contains modified Copernicus data (2015/2016), ESA Climate Change Initiative-Land Cover project 2017). Rivers and road networks, with primary (including trunk roads), secondary and tertiary roads (including unclassified roads for model II), were retrieved from OpenStreetMap.25 The models were based on the assumption that patients would reach the nearest road at walking speed and then continue with other means of transport. Road and non-road speeds varied between the models. For model II, an anisotropic analysis using the DEM was incorporated, implying that travel speeds were affected by the slope of the terrain. For each patient, travel time to the facility was extracted from the facility-specific maps with QGIS V.3.12 software.
Supplemental material
Statistical analysis
Univariable linear regression analysis was used to compare patient-reported and geospatial modelled travel times. For each patient, a conversion factor was calculated by dividing the modelled travel time by the patient-reported travel time. Median and IQRs were used to present the non-normally distributed variables travel time and conversion factor. Travel time comparisons were presented using scatter plot with regression line and analysed with correlation coefficients. Statistical analyses were performed with STATA V.16.0 (StataCorp). P values of less than 0.05 were considered statistically significant. For patients that used multiple means of transport, the main mode of transport was presented. Maps were produced with QGIS V.3.12 to illustrate patient-reported and geospatial modelled travel times, using the raw output of the AccessMod tool and an interpolated surface of patient-reported travel times. The interpolation was produced using inverse distance weighting.
Written informed consent was obtained from each woman by signature or thumbprint, either before or as soon as possible after surgery. The study is registered in the international clinical trial register (ISRCTN16157971).
Patient and public involvement
Patients were involved in the selection of the content of the health promotion packages provided as an incentive during home visits and provided feedback on the burden of the questionnaires.
Results
Between 1 October 2016 and 5 May 2017, 1276 caesarean sections were included in the study, among which 177 were planned and 1099 were emergency caesarean sections (figure 1).24 Of all emergency caesarean sections, 994 (90.4%) were followed up with a home visit after 1 month and 946 (86.1%) after 1 year. Patient-reported travel time was retrieved for 1088 women (99.0%). Geospatial modelled travel time for emergency caesarean sections was obtained for 1088 women (99.0%) and 1090 women (99.2%) for model I (based on Ouma et al) and model II (based on Huerta Munoz et al12), respectively. Figure 2 presents the patient-reported and modelled travel times for the nine hospitals combined.
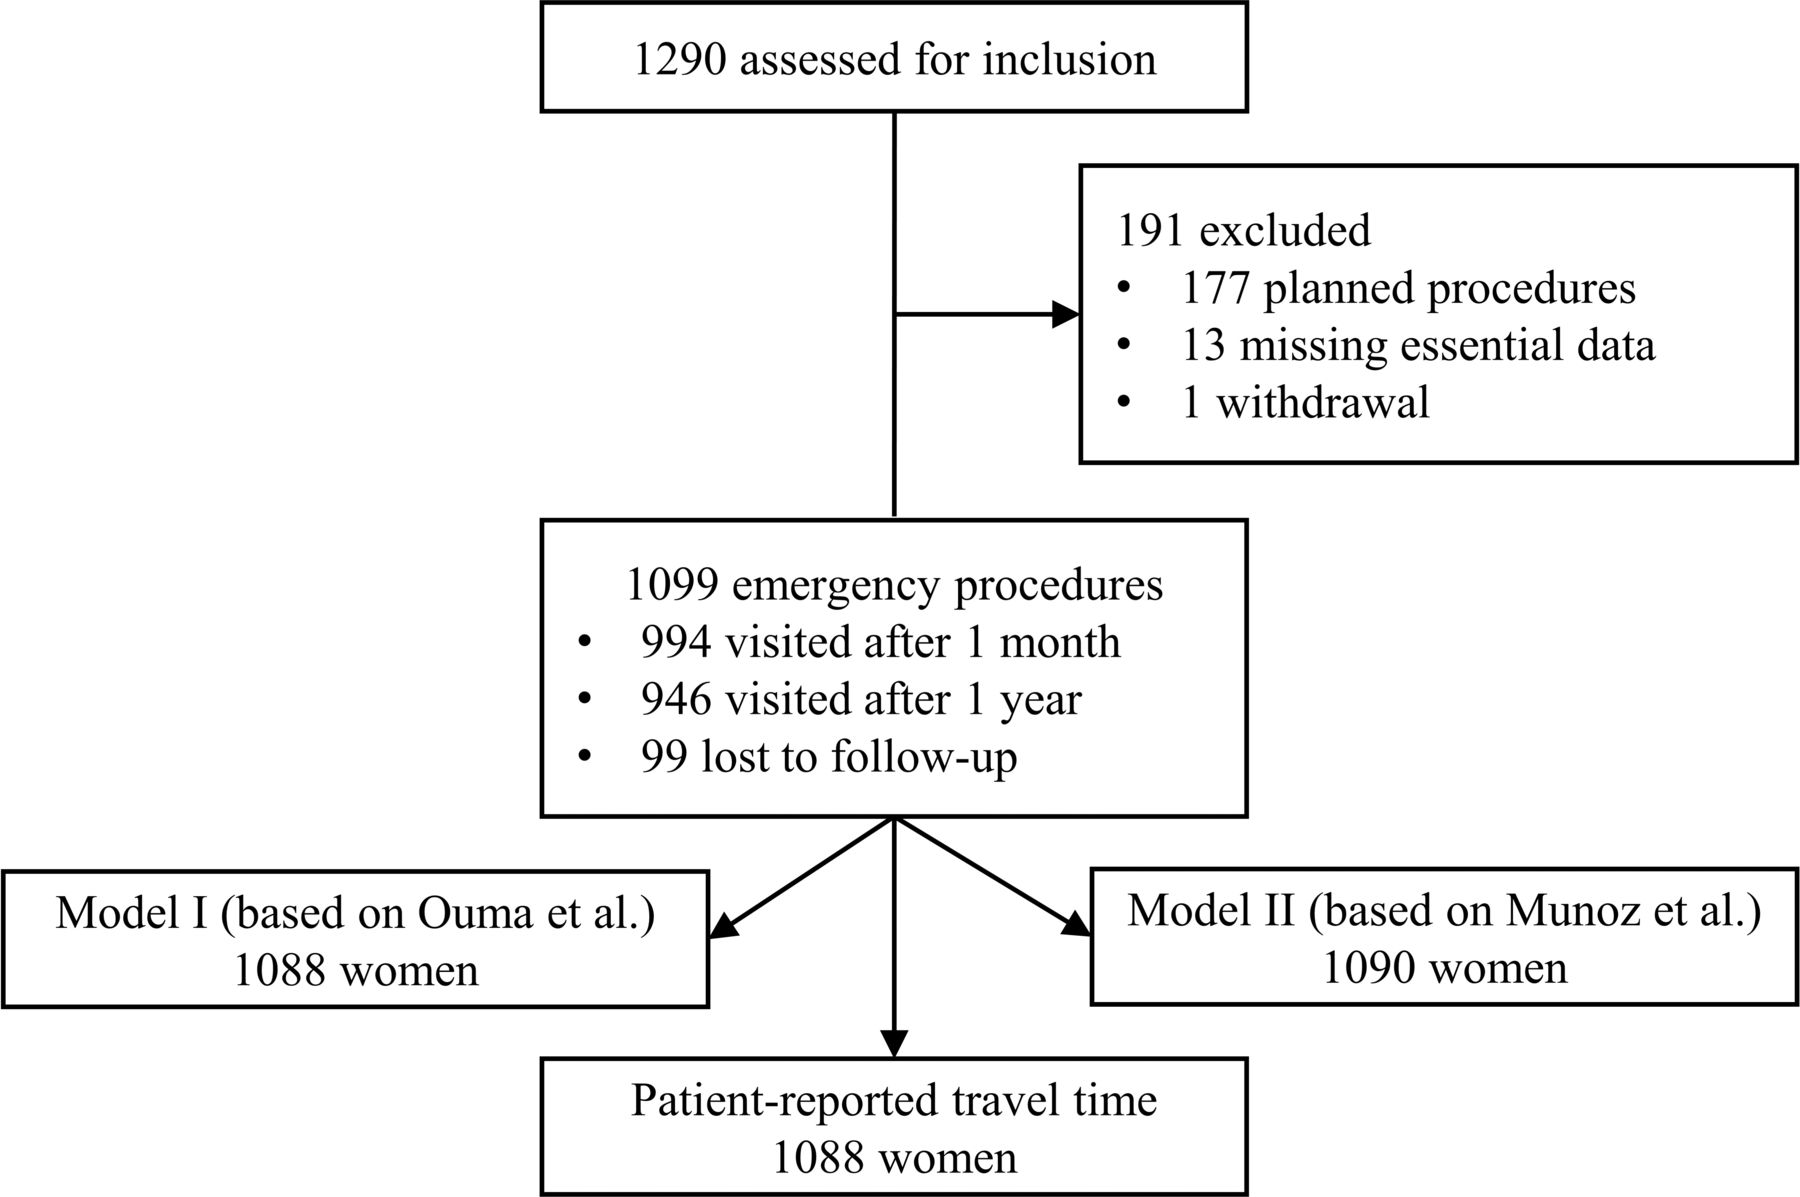
Study flow chart. Caesarean sections included in and excluded from the study. Analysis was performed for all patients, with and without follow-up. For 11 patients, no patient-reported travel time was recorded. For model I (based on Ouma et al11) and model II (based on Huerta Munoz et al12), 11 patients and 9 patients, respectively, had a geolocation that was not assigned a travel time, due to surrounding water bodies.

Patient-reported and geospatial modelled travel time (model I based on Ouma et al11, model II based on Huerta Munoz et al12) to the nine study hospitals. Patient locations before travelling to the caesarean section Hospital. *Patient locations before travelling to the hospital where the caesarean section was performed.
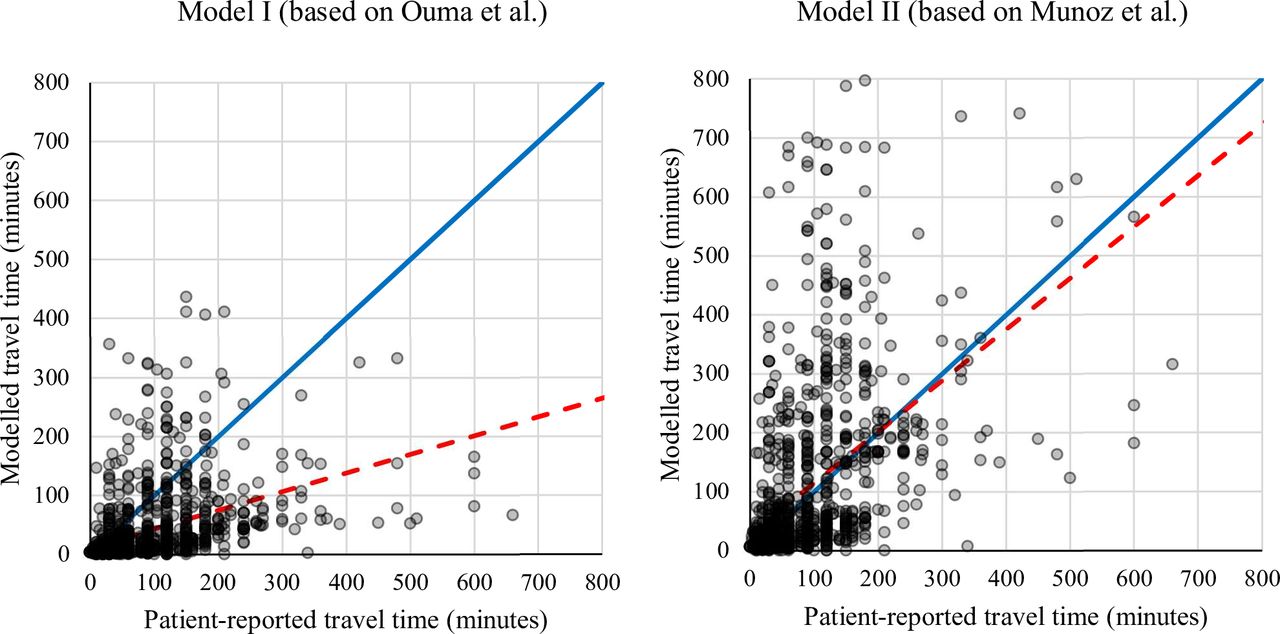
The median travel time reported by patients was 60 min (IQR 30–120), which was longer than that estimated with model I (13 min, IQR 4–44) and model II (34 min, IQR 13–153). There was a moderate positive relationship between patient-reported travel time and model I (r=0.420; p<0.001) and model II (r=0.487; p<0.001). In the linear regression analysis, for every unit increase in patient-reported travel time, the modelled travel time increased by 0.32 units (95% CI 0.27 to 0.36) for model I and 0.87 units (95% CI 0.76 to 0.96) for model II (figure 3). Taking these findings into account, the 2-hour threshold, as defined by LCoGS, correlates with a modelled travel time of 5.7 hours with model I and 1.8 hours with model II. The accuracy of both models in predicting if a woman lived within the 2-hour proximity threshold of the hospital was 79% (see online supplemental figure 2); however, model II had much higher specificity (69%) compared with model I (20%).
Supplemental material

Scatter plot comparing patient-reported travel time and modelled travel time for model I based on Ouma et al11 and II based on Huerta Molina et al.12 There was a moderate positive relationship between patientreported travel time and model I (r=0.420; p<0.001) and model II (r=0.487; p<0.001). The red dotted line is the regression line, for model I (y=0.32 * x+12) and model II (y=0.87 * x+28). The blue line represents equality.
Of all 938 patients that reported means of travel, 67 (7.1%) reported two or more means of transport. Patients whose main mode of transportation was boat and ambulance had the longest reported and modelled travel time (table 2). In total, 478 women (43.5%) visited one other facility and 13 (1.2%) visited two other facilities before reaching the hospital where the caesarean section was performed and thereby had longer reported and modelled travel times. In model I, 94 women (8.6%), and in model II, 122 women (11.2%) did not visit the hospital with the shortest travel time (see online supplemental figure 3). The study accounted for this result by using hospital-specific models. Women in the poorest quantile and women with no formal education reported a travel time approximately twice as long as those in the richest quantile and with higher education.
Supplemental material
Patient-reported and modelled travel times by category
The overall perinatal mortality rate was 219 per 1000 births. Women who reported a travel time of 2 hours or less had significantly lower perinatal mortality compared with those with a longer travel time (193 vs 308 per 1000 births, p<0.001). Lower perinatal mortality was also found for modelled travel time of 2 hours or less in model I (209 vs 344 per 1000 births, p=0.003) and model II (181 vs 319 per 1000 births, p<0.001). When moving the threshold from 2 hours to 30 min, the perinatal mortality rate was significantly lower for both reported travel time (p=0.025) and model I (p=0.040), and borderline significant for model II (p=0.071) (figure 4).

Perinatal mortality rate (per 1000 births) after caesarean section by patient-reported and modelled travel time groups with 95% CI. Model I (based on Ouma et al11), model II (based on Huerta Munoz et al12) and Lancet global surgery indicator threshold of 2 hours (red dotted line). Travel time is defined as the time between home and the facility where the caesarean section was performed.
Discussion
Key findings
This study aimed to assess the correlation between travel time reported by patients and travel time simulated with two geospatial models. The 2-hour access threshold, as defined by LCoGS, deviated from model I (5.7 hours) but was comparable with model II (1.8 hours). The secondary aim was to evaluate its clinical relevance and therefore assess the relationship between travel time and perinatal mortality. The 2-hour access threshold is clinically relevant for perinatal mortality, with lower rates associated with shorter travel times, for both reported and modelled travel times.
Interpretation
This study endorses the previous finding that the geospatial travel time model described by Ouma et al11 underestimates reported travel time.16 However, we found that the more conservative model described by Huerta Munoz et al12 provides estimates that are closer to patient-reported travel times. Possible reasons for the difference between patient-reported and modelled travel times are the fact that modelled travel time does not take into account the actual mode of transport and the actual route—including facilities that are visited before reaching the facility where the caesarean section is performed. Variations in road and traffic conditions due to, for example, seasonal variation and time of the day are other important factors influencing actual travel time.27 28
We also found that between 9% and 11% of the patients did not go to the hospital with the shortest modelled travel time. It is possible that other reasons than shortest travel time play a role in patients’ choice of facility, such as expected quality of care.29 The first model did not include trunk roads; consequently, one of the hospitals was not connected to the road network, leading to longer modelled travel times. Local knowledge of the actual status of the road network and transport system may provide more reliable data than internet-based maps.30 31 In a study from the Pacific region reporting on the LCoGS indicators, 5 of the 14 countries that estimated the proportion of the population living within a 2-hour access were based on manual or non-mapping techniques and not on geospatial modelling.30
Patient-reported travel times were provided by the woman and her relatives during admission. The accuracy and reproducibility of the patient-reported travel time as the golden standard can also be questioned, especially in a society with high illiteracy and taking into account the impact of traditional perceptions of time.18 32 In addition, the stress of labour may result in a distortion of time perception.33
Implications
In the context of the commitment of governments to providing Universal Health Coverage and attempting to reach the Sustainable Development Goals, health system planning is essential. Patients will only access the care they need if human resources and supplies are available at the right location and at the right time. Geospatial models can assist in identifying populations living in geographical areas with inadequate access to certain health services, such as emergency obstetric care. Freely available geospatial data, such as DEMs and land-cover maps of increasingly higher quality are continuously becoming available. This, together with open source GIS software, improves access to geospatial modelling techniques and can support evidence-based planning and resource allocation for emergency referral systems in low-resource settings.12 34
An important implication of this study is that geospatial modelling techniques only provide valuable information if input variables are chosen carefully. For example, when modelled travel time is used to compare access to healthcare between different countries, care must be taken in the interpretation of the results, as road conditions and transport systems might differ between countries. In low-income countries with more significant infrastructural challenges, a more conservative model with lower travel speeds should be considered.
Patient-reported and modelled travel times are related not only to the risk of maternal death in a situation of postpartum haemorrhage, but also to the risk of perinatal mortality. Applying the 2-hour threshold is pragmatic and useful. However, it is important to realise that this is not a ‘hard’ timeline, and that the group with travel time below 30 min had the best perinatal outcome. This is in line with findings from high-income settings where travel times longer than 15–20 min were associated with poorer perinatal outcome.3–5 In most high-income settings 2 hours travel time to reach emergency obstetric care would be considered too long and efforts to shorten travel time to improve perinatal outcome should be made in all settings.
There is an inherent tension between centralisation, which potentially increases travel times for patients but improves quality of care, with calls to reduce travel times taken to reach facilities. Underlining the importance of minimising travel time for the best possible outcome, should therefore be considered alongside issues of quality of care.35 Indeed poor quality of service delivery related to decentralisation of the health system has resulted in calls to redesign and centralise health systems to improve quality of care in low-income and middle-income countries.36 Primary health facilities might create an obstacle for patients in need for a caesarean section and delay access to the required treatment, centralisation can shorten the time to reach the facility that can provide emergency obstetric services.
One recent study modelled the geographical feasibility of service delivery redesign that shifted deliveries from primary care clinics to hospitals in six countries in order to improve the quality of care and concluded that this would reduce 2-hour access by at most 10%.37 This reduction of maximum 10% should be interpreted with caution, taking into account the possible over estimation of accessibility with modelled travel time. In addition, centralisation will disproportionally be disadvantageous for those living in the remote areas having already the poorest outcome and might lead to increasing disparities in health outcomes.
Strengths and weaknesses
The prospective design, in combination with follow-up home visits, made it possible to collect adequate data on the geolocation and clinical outcomes of women who delivered by caesarean section in nine different hospitals. Patient-reported travel time was compared with the estimates produced by two different models. As many roads are not passable during the rainy season, the inclusion period was purposefully selected during the dry season (October 2016 to May 2017), to maximise the follow-up rate. However, only the patients who reached the hospitals and received the caesarean section were included in the study. Therefore, the most vulnerable group, which has inadequate access to healthcare with potentially longer travel times, might have been excluded from the study, resulting in selection bias. If this study had been performed during the rainy season, patient-reported travel times would have been longer, and this would have favoured a more conservative model.
Conclusion
Standard travel time models consistently provide an underestimation of the time needed to access emergency obstetric care, compared with patient-reported travel times. However, conservative travel time models come closer to patient-reported travel times. There is a relation between geographical proximity and perinatal mortality: the shorter the travel time to the hospital, the lower the mortality, for both reported and modelled travel time. The 2-hour threshold, as determined by the LCoGS, is clinically relevant to reducing the risk for perinatal death. Nonetheless, it is not a hard timeline, and 2 hours might be too long regarding perinatal outcome.
Acknowledgments
The authors acknowledge the important contributions by Abu Bakarr Dumbuya, Abdul Rahman Moijue, Musa Sumah and Mohammed Samba Bah for the data collection, and Jan Boonen for providing support with the geospatial analysis. We are also grateful to all the women and children who took part in the study, as well as all anaesthesia teams, associate clinicians and medical doctors at the participating hospitals.
References
Supplementary materials
Supplementary Data
This web only file has been produced by the BMJ Publishing Group from an electronic file supplied by the author(s) and has not been edited for content.
Footnotes
Handling editor Seye Abimbola
Contributors AJvD, APK, AJML, LH, AW and HAB conceived the study and wrote the protocol. AJvD and HAB developed the data analysis plan with input from LH, HH and OF. AJvD coordinated the data collection, supervised by APK, MMK, AJML and HAB. AJvD and HA analysed the data and wrote the first draft of the manuscript. All authors participated in the revision of the manuscript and approved the final version.
Funding The Liaison Committee between the Central Norway Regional Health Authority and the Norwegian University of Science and Technology (NTNU). Laerdal Foundation Grant: 40313.
Map disclaimer The depiction of boundaries on this map does not imply the expression of any opinion whatsoever on the part of BMJ (or any member of its group) concerning the legal status of any country, territory, jurisdiction or area or of its authorities. This map is provided without any warranty of any kind, either express or implied.
Competing interests None declared.
Patient consent for publication Not required.
Ethics approval The study was approved by the Sierra Leone Ethics and Scientific Review Committee and the Regional Committees for Medical and Health Research Ethics in central Norway (ethical clearance no. 2016/1163).
Data availability statement Data are available on reasonable request.
Supplemental material This content has been supplied by the author(s). It has not been vetted by BMJ Publishing Group Limited (BMJ) and may not have been peer-reviewed. Any opinions or recommendations discussed are solely those of the author(s) and are not endorsed by BMJ. BMJ disclaims all liability and responsibility arising from any reliance placed on the content. Where the content includes any translated material, BMJ does not warrant the accuracy and reliability of the translations (including but not limited to local regulations, clinical guidelines, terminology, drug names and drug dosages), and is not responsible for any error and/or omissions arising from translation and adaptation or otherwise.