Article Text

Abstract
Introduction The measurement of progress towards many Sustainable Development Goals (SDG) and other health goals requires accurate and timely all-cause and cause of death (COD) data. However, existing guidance to countries to calculate these indicators is inadequate for populations with incomplete death registration and poor-quality COD data. We introduce a replicable method to estimate national and subnational cause-specific mortality rates (and hence many such indicators) where death registration is incomplete by integrating data from Medical Certificates of Cause of Death (MCCOD) for hospital deaths with routine verbal autopsy (VA) for community deaths.
Methods The integration method calculates population-level cause-specific mortality fractions (CSMFs) from the CSMFs of MCCODs and VAs weighted by estimated deaths in hospitals and the community. Estimated deaths are calculated by applying the empirical completeness method to incomplete death registration/reporting. The resultant cause-specific mortality rates are used to estimate SDG Indicator 23: mortality between ages 30 and 70 years from cardiovascular diseases, cancers, chronic respiratory diseases and diabetes. We demonstrate the method using nationally representative data in Myanmar, comprising over 42 000 VAs and 7600 MCCODs.
Results In Myanmar in 2019, 89% of deaths were estimated to occur in the community. VAs comprised an estimated 70% of community deaths. Both the proportion of deaths in the community and CSMFs for the four causes increased with older age. We estimated that the probability of dying from any of the four causes between 30 and 70 years was 0.265 for men and 0.216 for women. This indicator is 50% higher if based on CSMFs from the integration of data sources than on MCCOD data from hospitals.
Conclusion This integration method facilitates country authorities to use their data to monitor progress with national and subnational health goals, rather than rely on estimates made by external organisations. The method is particularly relevant given the increasing application of routine VA in country Civil Registration and Vital Statistics systems.
- public health
- epidemiology
Data availability statement
All data relevant to the study are included in the article or uploaded as supplemental information.
This is an open access article distributed in accordance with the Creative Commons Attribution Non Commercial (CC BY-NC 4.0) license, which permits others to distribute, remix, adapt, build upon this work non-commercially, and license their derivative works on different terms, provided the original work is properly cited, appropriate credit is given, any changes made indicated, and the use is non-commercial. See: http://creativecommons.org/licenses/by-nc/4.0/.
Statistics from Altmetric.com
Key questions
What is already known?
Existing guidance to countries to calculate many Sustainable Development Goals (SDGs) is inadequate for populations with incomplete death registration and poor-quality cause of death data.
What are the new findings?
We propose a method to calculate population-level cause-specific mortality rates where there is incomplete death registration by integrating routine verbal autopsy (VA) and Medical Certificate of Cause of Death (MCCOD) data.
The method is demonstrated to calculate SDG Indicator 23 (the probability of dying between ages 30 and 70 years from cardiovascular diseases, cancers, chronic respiratory diseases and diabetes) in Myanmar in 2019 using local VA and MCCOD data.
What do the new findings imply?
The method allows country authorities to use local VA and MCCOD data to monitor progress with national and subnational health goals, rather than rely on estimates made by external organisations.
Introduction
All countries have committed to monitor progress towards national and international health goals, including the Sustainable Development Goals (SDGs) and the goals and targets set forth in the WHO’s Noncommunicable Diseases Global Monitoring Framework (NCD GMF).1 2 Global and local goals and targets are a key component of any health and development strategy, providing vital intelligence on the effectiveness of targeted interventions and the outcomes of significant investments in health systems. Many of these health goals require accurate and timely cause of death (COD) and all-cause mortality data for the country, disaggregated by age and sex.3 Indeed, 7 of the 17 SDGs, and 17 of their corresponding indicators, require cause-specific mortality data from a Civil Registration and Vital Statistics (CRVS) system for their measurement.4 A good example is SDG 3.4 which aims, by 2030, to reduce premature mortality from NCDs by one-third.1
The COD data to measure progress with these goals should ideally come from a complete and timely CRVS system where the cause of every death is ascertained using the International Medical Certificate of Cause of Death (MCCOD) completed by a physician, adhering to the certification and coding rules of the International Classification of Diseases Revision in force (currently ICD-10).5 However, the ability of national governments to reliably measure indicators for these, and other health goals, is affected by incomplete death registration and often poor-quality COD data. Only about two in three deaths worldwide are registered, while close to 70% of the world’s population live in a country where less than 90% of deaths are registered or otherwise known to health authorities, overwhelmingly low/middle-income countries (LMICs) where the burden of premature mortality is greatest.6 Reliable COD data are even less available for policy and planning.7 In many countries, the only available COD data are from hospitals, but these are often misdiagnosed or otherwise of poor quality and are unrepresentative of national COD patterns because they are biased towards younger ages at death and acute diseases.8 9 Data on community (ie, non-hospital) deaths, which comprise the majority of deaths in LMICs, are commonly either unavailable or contain vague or ill-defined diagnoses due to poor-quality data collection and diagnostic practices.10
Typically, the guidance offered to countries to assist them to compute national values of these indicators does not adequately specify what methods to apply when faced with incomplete or suboptimal quality data. For example, SDG Indicator 23 (pertaining to SDG 3.4 mentioned above) measures the probability of dying between exact ages 30 and 70 years from either a cardiovascular disease, cancer, diabetes or chronic respiratory disease. The SDG guidance states that the most reliable data source for this indicator should be based on death certificates and administrative data from health facilities, but without any mention of the intrinsic biases in health facility data.11 The guidance offered goes on to state that where coverage of death certification is poor, household surveys can be used to measure NCD mortality, but without any specific guidance on potential quality issues or biases commonly associated with survey data on CODs, nor on the feasibility of using this source, or how to use them to calculate the indicator.11 Similarly, the WHO’s NCD GMF specifies that, for the same indicator, the preferred data source is CRVS systems of sufficient completeness to calculate all-cause mortality rates, with other possible sources being sample registration systems and verbal autopsy (VA).2 Again, there is no guidance about the potential limitations of these data nor how to use or interpret them. For many countries, these challenges in calculating mortality-based indicators mean there is a heavy reliance on estimates produced by the Global Burden of Disease (GBD) Study and other international efforts using complex statistical models, often largely based on other countries’ COD data, with very little direct evidence on the local epidemiological situation.12–14 Further, these estimates are not generally available for subnational populations for the vast majority of countries. Recent research has suggested methods to estimate population-level CODs by extrapolating from in-hospital cause patterns, but it is unclear how widely applicable this approach might be.15
For many, if not most, LMICs, complete death registration and widespread use of medical certification to ascertain CODs are unlikely to be achieved in the foreseeable future, in part because there is limited experience and knowledge about cost-effective ways to notify community deaths to official authorities and typically low physician to population ratios.16 17 Increasingly, VA is being used or trialled in LMICs to ascertain the cause of community deaths in rural populations, together with more effective data management practices with the potential to integrate them into routine death registration and reporting systems.10 VA predicts the probable COD based on an interview of family members of the deceased using a standardised questionnaire about the signs and symptoms experienced by the deceased prior to death; these responses are then applied to automated diagnostic algorithms or reviewed by a physician, to ascertain the probable COD. For example, in Myanmar, since 2018 VAs have been collected from 42 townships that comprise a representative sample of the national population.10 Routinely collected VA data on all, or a sample of, community deaths, diagnosed using an established, validated diagnostic method, together with COD data from hospitals ascertained using MCCOD, can, in principle, lead to more policy-relevant, representative COD statistics than either source alone. Yet, there has been relatively little scientific debate about issues in the integration of the two data sources, despite the fact that this process has significant potential to fill key data gaps that currently exist in many LMICs and enable countries to more reliably monitor progress with health goals.
This integration is not straightforward, however, and needs to consider not only the number of reported VAs and hospital deaths from each cause, but also the extent to which the reporting of the fact of death is incomplete in hospitals and the community, by age and sex. As a result, there have been few attempts to integrate VA and MCCOD data; previous studies to generate national cause-specific mortality rates by integrating VA and MCCOD data have been conducted in Malaysia and Thailand but have relied on complete or close to complete death registration systems where there is reasonable certainty about the true numbers of deaths by age and sex.18 19
To our knowledge, there are no published studies, with replicable methods, on the use of incomplete death reporting and the integration of VA and MCCOD data to calculate national cause-specific mortality rates, despite the policy utility of this information. National Statistics Offices and Ministries of Health should be empowered to calculate these indicators themselves using available data, in order to be able to continuously assess progress towards national and subnational health goals. In this paper, we propose a method for local analysts to apply to estimate national and subnational cause-specific mortality rates for populations where both MCCOD and VA data are available, and where death registration or reporting is incomplete. We then provide an example of the application and interpretation of the method to calculate SDG Indicator 23, the probability of dying between exact ages 30 and 70 years from any of cardiovascular disease, cancer, diabetes and chronic respiratory disease, for a nationally representative population of Myanmar.
Methods
Method to integrate VA and MCCOD data
The integration of COD data requires data on cause-specific mortality fractions (CSMFs; the fraction of all deaths that are due to a specific cause) that are available from both MCCODs and VAs, with a clear distinction between the two sources. The vast majority of MCCOD data on CODs in a country would have an ICD-10 code attributed as the underlying COD and would reflect deaths that occur in hospital. A small fraction might also contain attempted diagnoses for ‘dead on arrival cases’ where the patient died before or soon after arrival at a hospital, or deaths subject to coronial enquiry. VA deaths typically would cover deaths at home or in the community (ie, non-hospital deaths) where it was not possible for a physician to provide a MCCOD. In such cases, VA is the only viable alternative to ascertain a probable COD.
Integration of the CSMFs derived from MCCOD and VA data to produce population-level CSMFs is reliant on a reliable estimate of the number of deaths that occurs in hospitals (for MCCODs) and in the community (for VAs). Given that vastly more deaths generally occur in the community than in hospitals in most LMICs, failure to account for the relative number of deaths that occurs in each setting would result in biased cause estimates.
We define:


where C is the CSMF, D is reported death,  is estimated deaths, and where the subscript i is cause, s is sex, x is age group, v is VA, g is MCCOD, c is community, h is hospital and t is total deaths (hospital and community). In the integration, MCCOD and VA CSMFs are multiplied by the estimated number of hospital and community deaths, respectively, to estimate the number of hospital and community deaths from each cause. The estimated total number of deaths from each cause is then calculated, from which the final CSMFs are computed. Each of these calculations is conducted for each sex and 5-year age group separately to improve the accuracy of results and to enable calculation of all relevant SDGs and other health goals. Where the (low) numbers of deaths would imply too much uncertainty in CSMFs calculated for specific age groups, CSMFs of a broader age group can be calculated and applied instead (eg, use the CSMF for the broader age groups 45–64 years for each 5-year age group between ages 45 and 64 years).20
The ‘estimated’ number of deaths needs to be determined for populations where death reporting is incomplete (the principles are also relevant in cases where death reporting is thought to be complete; in that case, the number of ‘reported’ rather than ‘estimated’ deaths would be used.). The number of age-specific and sex-specific deaths in the community and in hospitals also needs to be estimated. The estimated total number of deaths in the population can be calculated as follows:

where E is all-age completeness of total reported deaths (as a fraction). Completeness of death reporting can be calculated using the empirical completeness method, which requires limited data inputs and can be reliably applied at the subnational level.21 A model life table can then be used to estimate deaths by age ( ); further, completeness of death reporting is likely to be lower for child deaths compared with adult deaths (alternatively, total deaths by age and sex can be obtained from estimates made by an established source such as the GBD, UN World Population Prospects or National Statistics Office, if available; at the very least, these sources can be used to assess the plausibility of the estimated level and age pattern of mortality.).21–23 If hospital death reporting is complete, estimated community deaths can be calculated as total estimated deaths minus total reported hospital deaths (by age and sex). However, if not all hospital deaths are reported, then this calculation will overestimate community deaths. If that is the case, hospital deaths can be estimated (ie, adjusted upwards) based on local knowledge of hospital reporting completeness, and community deaths recalculated. Whichever way the number of community deaths is calculated, the resultant percentage of total deaths that occur in the community should be assessed for plausibility by local health officials with knowledge of the hospital reporting system.
Preparing for data integration
Before integrating the VA and MCCOD data, the characteristics and quality of these data sources need to be assessed in terms of the age pattern of hospital and community deaths, the completeness of VA reporting (ie, the proportion of community deaths for which a VA was conducted), and the quality of VA and MCCOD CSMFs, using available tools (see online supplemental file 1 for more information on assessing the hospital and community datasets prior to integration).20 24 The data quality assessment of the two data sources may identify that either or both sources are of such poor quality that the integration should not proceed because it would result in CSMFs that are significantly biased. Importantly, the MCCOD and VA cause lists need to be mapped to a common COD list. Given the interview-based process for VA, there will be many more ICD-10 causes in the MCCOD data than would be possible from a VA interview where time and complexity of symptom questions are a major consideration. As a result, VA can generally only identify a limited number of CODs, although these are of greatest public health importance. Consequently, the MCCOD causes should be mapped to the VA cause list. This simply involves careful aggregation of the MCCOD deaths into the ICD-10 codes that define each VA cause. However, the detailed MCCOD causes should still be used to understand hospital cause patterns within the larger VA cause groupings. For purposes of illustration, we confine the method to one automated diagnostic algorithm, namely SmartVA, although the principles of integration proposed here could be applied to any VA diagnostic method.25 The SmartVA and ICD-10 cause mapping is provided in online supplemental table S1.
Supplemental material
Calculation of premature mortality (SDG Indicator 23)
The integration of VA and MCCOD data produces the required data from which, among other uses, one can calculate SDG Indicator 23. There may be differences between the ICD codes for the four causes specified by the WHO for this indicator and those pertaining to the VA cause list used. The WHO specifies the following ICD codes: cardiovascular disease I00–I99, cancers C00–C97, diabetes E10–E14 and chronic respiratory diseases J30–J98. The SmartVA causes for cardiovascular diseases and diabetes are mapped to the same ICD codes. However, chronic respiratory diseases are limited to J40–J46 (comprising bronchitis, emphysema and asthma—the major causes of chronic respiratory mortality), and cancers to C00–D48 (codes C98–D48 are uncommonly used for cancer mortality). MCCOD hospital mortality data for chronic respiratory diseases in particular should be assessed as to the concordance between the WHO and SmartVA cause lists (ie, percentage of deaths in J30–J98 that are in J40–J46).
The equations below describe the calculation of the premature mortality indicator for a calendar year, using life table techniques2:


where  is the age-specific death rate of the four NCD causes between exact ages x to x+5,
  is the probability of dying from any of the four NCD causes between exact ages x to x+5,
  is the probability of dying from any of the four NCD causes between exact ages 30 and 70 years (independent of other causes and assuming current mortality conditions).2 In summary, age cause-specific death rates are calculated for each age group, converted to age-specific probabilities of dying from each of the causes, and the indicator calculated as one minus the product of the age-specific probabilities of not dying from one of the four causes.
Myanmar example
In this manuscript, we demonstrate the integration of VA and MCCOD data and calculation of SDG Indicator 23 using data from a nationally representative sample of 42 townships in Myanmar (comprising at least two townships from each state and region in the country) with a population of 8.4 million, or 15% of the national population. Myanmar has incomplete death registration, with the only routine COD data arising from hospital deaths, which are estimated to be about 16% of all deaths in the country.10 To improve evidence about the CODs that occur outside of hospitals, the government of Myanmar partnered with the Bloomberg Philanthropies Data for Health Initiative in 2016 to introduce routine-automated VA for community deaths in the 42 townships. In 2019, over 42 000 VAs were conducted in these townships, complementing the 7600 hospital deaths that occurred in this population during that year. Routine VA fills a major data gap for Myanmar, and by providing age-specific and sex-specific CSMFs can enable integration of VA and MCCOD data and provide nationally representative COD data. The assessment of the completeness of the Myanmar data was conducted using the empirical completeness method.21 The estimate of the under-5 mortality rate for the 42 townships was calculated from state-level estimates from the 2014 Population Census and 2015–2016 Demographic and Health Survey and scaled to the United Nations Inter-agency Group for Child Mortality Estimation estimates, while the population data were sourced from the 2014 census population projections from the Department of Population.26–28 The 42 townships have a very similar under-5 mortality rate to the national population (45.4 per 1000 compared with 44.6 per 1000 nationally) and a very similar population age structure (6.1% were aged 65 years and over, compared with 6.4% nationally), and hence are sufficiently representative of the provinces and regions to draw reasonable conclusions about the likely COD pattern nationwide.26–28
Results
In Myanmar, completeness of VA reporting was estimated to be 70% in 2019, being substantially higher in males than females (81% males, 63% females). This was assessed as being sufficient to proceed with integration of the data, recognising that about one-third of community deaths do not have a cause, more so for females. This analysis resulted in a total of 67 426 estimated deaths at all ages in 2019, of which 89% were estimated to have occurred in the community; similar to GBD and UN World Population Prospects (WPP) estimates (according to the total estimated deaths, the probability of dying from age 15 to 60 years in 2019 was 251 per 1000 for males and 134 per 1000 for females, compared with 226 for males and 128 for females as estimated by the GBD, and 246 for males and 149 for females as estimated by the UN WPP).22 23 The percentage of VAs at ages 30–69 years for which the COD could not be determined in 2019 was 12% for men and 10% for women. The percentage of MCCODs at ages 30–69 years that were ill-defined (R00–R99) was 6% for both men and women. In 2019, 22% of MCCODs had unusable CODs (ie, of limited use for policy) at very high, high or medium severity levels.29 Further analysis of the quality of the VA data using the VIPER tool demonstrated that the CSMFs from VA were plausible, based on a comparison with GBD 2019 data and an analysis of the age–sex pattern of specific causes.20 For hospital deaths coded to chronic respiratory diseases (J30–J98) in 2019, 49% used codes that mapped to chronic respiratory for SmartVA (J40–J46); this figure was 61% if J96 ‘Respiratory failure, not elsewhere classified’ and J98 ‘Other respiratory disorders’ were excluded from the denominator (because many of these deaths would likely be in codes J40–J46 if correctly certified). Almost all (95%) hospital deaths included in the SmartVA’s cancer codes (C00–D48) were within the WHO’s codes for this cause group (C00–C97).
Table 1 summarises the data inputs and outputs in the integration of the two data sources. As expected, a higher proportion of younger adult deaths occurred in hospitals compared with older adults. The CSMF of the four causes combined increased with age and was consistently higher in community than hospital deaths. For all (ie, total) deaths, the CSMF of the four causes combined was comparatively high, as expected, being 0.676 for men and 0.749 for women in the age group of 65–69 years. When the four causes were calculated as age-specific death rates and probabilities of dying, they were higher among men than women, especially in younger age groups. The final result shows that the probability of dying of any of cardiovascular disease, cancer, diabetes or chronic respiratory disease between ages 30 and 70 years in 2019 was 0.265 for men and 0.216 for women, independent of other causes and assuming current mortality conditions.
Calculation of probability of dying between exact ages 30 and 70 years from any of cardiovascular disease, cancer, diabetes or chronic respiratory disease, by sex, 42 townships, Myanmar, 2019
Online supplemental table S2 presents the CSMFs for each of the four causes by age group and sex. Cardiovascular diseases were the most common of the four causes, with the CSMFs for each increasing with age. The CSMFs were higher for women in the younger ages because a much higher proportion of men in these ages die from external causes and cirrhosis. The CSMFs for diabetes were consistently and significantly higher for women across all age groups.
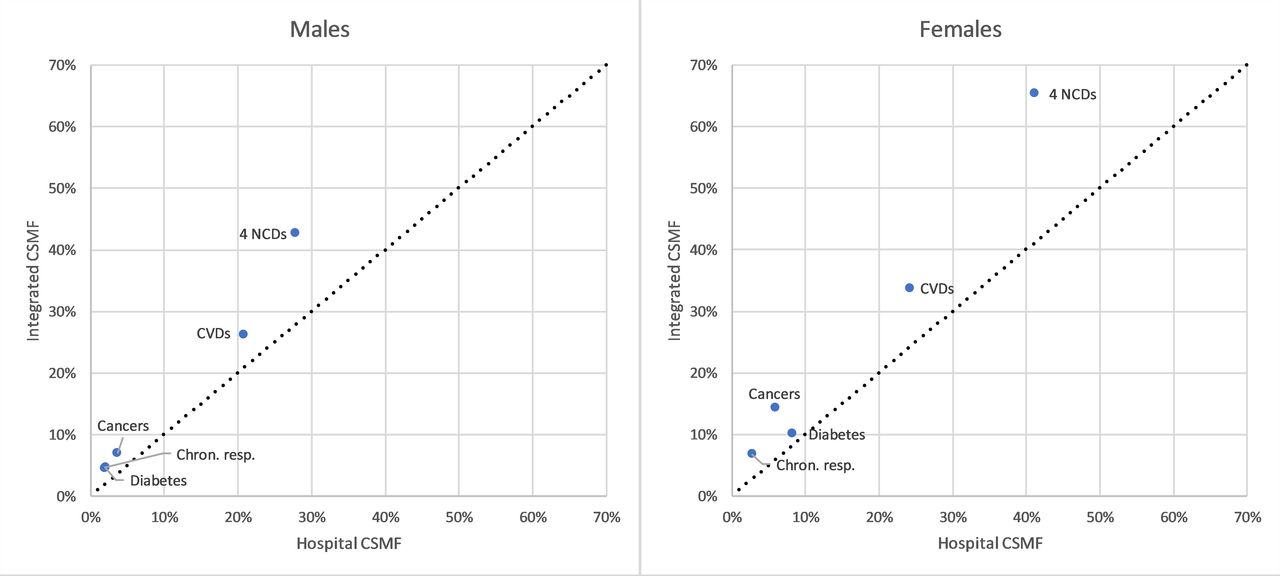
Figure 1 compares CSMFs for specific causes according to whether the data were reported in hospitals only with that resulting from the integration of data sources. For each cause, the CSMF derived from the integration data was higher than that in hospitals, with the largest differences among women. For all four NCDs combined, for example, the CSMF for women based on the integrated data was 65% vs 41% in hospitals, while the respective figures for men were 43% and 28%. In other words, NCDs are likely to be 50% higher based on integrating data sources compared with hospital data alone. Other large differences can be observed for cardiovascular diseases (10 percentage points higher for women) and cancers (8 percentage points higher).
CSMFs between exact ages 30 and 70 years in hospitals and integrated data, by sex, 42 townships, Myanmar, 2019. Chron. resp., chronic respiratory diseases; CSFMs, cause-specific mortality fractions; CVDs, cardiovascular diseases; NCDs, non-communicable diseases.
Discussion
The measurement of progress towards the attainment of SDGs and other health goals assumes complete reporting of deaths and reliable COD data, something that is, and will continue to be challenging for many LMICs where good quality mortality data are typically not available. The introduction of routine VA in an increasing number of LMICs to measure COD patterns in the community, where the majority of deaths occur, should, in principle at least, substantially improve countries’ ability to monitor health goals and, more generally, generate evidence on local COD patterns.
This manuscript has described and demonstrated the use of a practical method to estimate summary cause-specific health indicators based on the integration of MCCOD for hospital deaths with routine VA data for community deaths, taking into account the common situation of incomplete reporting of the fact of death. We demonstrate the applicability of the method in a nationally representative sample of 42 townships in Myanmar to produce estimates of the SDG premature mortality indicator pertaining to NCDs. The higher CSMFs for these causes based on the integrated data, compared with what is suggested from hospital data alone (which only comprise a minority of all deaths in the country), demonstrate the importance of collecting routine VA data to ascertain the causes of community deaths and the policy benefits of integrating community CSMFs with hospital CSMFs; otherwise, using just hospital data would underestimate the magnitude of premature NCD mortality in the country. The resultant estimates of the probability of dying from any of the four NCDs included in the SDG indicator between the ages of 30 and 70 years in 2019 of 0.265 for men and 0.216 for women are similar to those made by the WHO for 2016 for Myanmar of 0.27 for men and 0.21 for women, but lower than the 0.304 for men and higher than the 0.199 for women calculated using GBD mortality and COD estimates.22 30 31 Importantly, rather than relying on indirect estimates using the complex methods of the GBD or WHO, largely based on covariates with little or no local data, the method is straightforward enough to enable local authorities to use the country’s own data to monitor progress with national, and crucially, subnational health goals. The method also overcomes the vague and generally unhelpful guidance currently available for countries about how to estimate indicators required for monitoring progress with global health and development goals.
A strength of the integration method is that it is appropriate for countries where there is incomplete death reporting, because it employs the empirical completeness method to reliably estimate the extent of incompleteness. In many LMICs, incomplete death reporting is unfortunately likely to be the reality for the foreseeable future, and hence the ability to reliably estimate the volume of mortality both in and outside hospitals is key to facilitating the integration of COD estimates from different sources, in particular VA for home deaths. In the case of Myanmar, cost-effective approaches using automated VA have been demonstrated to work well in a nationally representative sample of the population, yielding important information on community CODs that did not exist before.10 It is important though that users of the integration method are able to understand the quality and plausibility of the COD data that result using the ANACONDA and VIPER tools, and when data quality and completeness is too poor for the integration to proceed.20 24 For example, in Myanmar VA diagnoses of the COD are available for an estimated 70% of community deaths; if the cause pattern for the 30% of deaths without a VA is significantly different, this will bias community cause patterns. Similarly, if the completeness of VA reporting is below about 50%, or if the fraction of undetermined (ill-defined) CODs exceeds about 20%, then the integration should probably not proceed. Users should also be careful about making inferences about national level cause patterns if the data used for the integration are not from a nationally representative sample.
There are some limitations of the integration method presented here, many of which are related to the quality of the available data. Where the reporting of the fact of death is incomplete then, despite the use of a reliable method to estimate completeness, there will still be some residual uncertainty about the total number of deaths and how they are distributed by age and sex, and also between hospitals and the community. Local knowledge of the quality of hospital reporting and plausibility of the proportion of total deaths that occur in hospitals is important to identify any clear errors in estimates. In the example of Myanmar, the low proportion of deaths that occur in hospitals implies that any error in the estimation of this number would likely only have a small impact on the resultant COD estimates. That would not be the case for errors in the levels and cause structure of community deaths, however. Incomplete death reporting or high levels of ill-defined or undetermined causes can also bias the quality of COD estimates, and in particular will affect the representativeness of results if these data issues are more acute for certain subpopulations of a country. Additionally, small numbers of deaths may create uncertainty about results, which is particularly relevant when applied to subnational populations. Another limitation of any integration is that it will be reliant on the cause list employed in VA. As in the case of the Myanmar example, the ICD codes suggested by the WHO for use in the calculation of the premature mortality indicator do not directly map to the VA cause list; however, analysts can use their hospital data to gauge what impact this will have on calculation of this indicator. Despite the fact that integration with a lower number of causes from the VA will necessarily reduce the list of causes for which mortality can be monitored, current VA tools can identify COD from the major conditions likely to be of highest policy relevance for LMICs, some more reliably than others.32 33
Conclusion
To fully realise the benefits of the integration of VA and MCCOD data to calculate national and international health indicators, there is an urgent need to strengthen capacity in National Statistics Offices and Ministries of Health to apply these methods confidently and competently. Analysts in Myanmar from the Central Statistical Organization and Ministry of Health and Sport have been trained remotely in these methods and have successfully estimated nationally representative CSMFs that have recently been published in their Statistical Yearbook.34 This demonstrates the feasibility of widespread application of this integration method by country staff, thus reducing reliance on the indirect GBD or WHO estimates, enabling subnational estimation, building local analytical capacity and enhancing national ownership of the estimates. Such multisource integration methods also demonstrate the need and benefits of investing in nationally representative routine-automated VA systems, especially in populations with a high proportion of deaths in the community, and for strengthened practices to correctly certify and code deaths that occur in hospitals. These strategies will yield more reliable mortality and COD information which in turn will enable countries to measure progress towards health goals and the avoidance of major causes of premature death.
Data availability statement
All data relevant to the study are included in the article or uploaded as supplemental information.
Ethics statements
Ethics approval
Ethics approval was not required because data collection formed part of ongoing routine work by Myanmar government staff in the 42 townships. Ethics training was provided as part of the verbal autopsy training and informed verbal consent was obtained from the relatives of the deceased person. The Ministry of Health and Sports and the Central Statistical Organization approved this consent procedure for the verbal autopsy interview in Myanmar. Only government staff (ie, Ministry of Health and Sports and the Central Statistical Organization) had access to the data, and all data analyses for this manuscript were conducted by a Central Statistical Organisation staff member. We did not involve patients or the public in the design, conduct, or reporting of the research.
Acknowledgments
The authors wish to acknowledge the work of the Ministry of Health and Sports and Central Statistical Organization staff involved in verbal autopsy and medical certification of cause of death data collection and data processing.
Supplementary materials
Supplementary Data
This web only file has been produced by the BMJ Publishing Group from an electronic file supplied by the author(s) and has not been edited for content.
Footnotes
Handling editor Sanni Yaya
Contributors TA led the development of the methods, advised on application of the methods, drafted earlier versions of the manuscript and contributed to the final version of the manuscript. SF provided technical input to the development of the methods, drafted and edited earlier versions of the manuscript, and contributed to the final version of the manuscript. TPPP conducted the data analysis and contributed to the final version of the manuscript. KSB was responsible for implementing the activities in Myanmar under the Data for Health Initiative and contributed to the final version of the manuscript. AL conceptualised the research theme, provided technical input to the development of the methods, edited earlier versions of the manuscript and contributed to the final version of the manuscript.
Funding This study was funded under an award from Bloomberg Philanthropies and the Australian Department of Foreign Affairs and Trade to the University of Melbourne to support the Data for Health Initiative.
Disclaimer The funders had no role in study design, data collection and analysis, decision to publish or preparation of the manuscript.
Competing interests None declared.
Provenance and peer review Not commissioned; externally peer reviewed.
Supplemental material This content has been supplied by the author(s). It has not been vetted by BMJ Publishing Group Limited (BMJ) and may not have been peer-reviewed. Any opinions or recommendations discussed are solely those of the author(s) and are not endorsed by BMJ. BMJ disclaims all liability and responsibility arising from any reliance placed on the content. Where the content includes any translated material, BMJ does not warrant the accuracy and reliability of the translations (including but not limited to local regulations, clinical guidelines, terminology, drug names and drug dosages), and is not responsible for any error and/or omissions arising from translation and adaptation or otherwise.