Article Text

Abstract
Background Travel time to comprehensive emergency obstetric care (CEmOC) facilities in low-resource settings is commonly estimated using modelling approaches. Our objective was to derive and compare estimates of travel time to reach CEmOC in an African megacity using models and web-based platforms against actual replication of travel.
Methods We extracted data from patient files of all 732 pregnant women who presented in emergency in the four publicly owned tertiary CEmOC facilities in Lagos, Nigeria, between August 2018 and August 2019. For a systematically selected subsample of 385, we estimated travel time from their homes to the facility using the cost-friction surface approach, Open Source Routing Machine (OSRM) and Google Maps, and compared them to travel time by two independent drivers replicating women’s journeys. We estimated the percentage of women who reached the facilities within 60 and 120 min.
Results The median travel time for 385 women from the cost-friction surface approach, OSRM and Google Maps was 5, 11 and 40 min, respectively. The median actual drive time was 50–52 min. The mean errors were >45 min for the cost-friction surface approach and OSRM, and 14 min for Google Maps. The smallest differences between replicated and estimated travel times were seen for night-time journeys at weekends; largest errors were found for night-time journeys at weekdays and journeys above 120 min. Modelled estimates indicated that all participants were within 60 min of the destination CEmOC facility, yet journey replication showed that only 57% were, and 92% were within 120 min.
Conclusions Existing modelling methods underestimate actual travel time in low-resource megacities. Significant gaps in geographical access to life-saving health services like CEmOC must be urgently addressed, including in urban areas. Leveraging tools that generate ‘closer-to-reality’ estimates will be vital for service planning if universal health coverage targets are to be realised by 2030.
- geographic information systems
- maternal health
- obstetrics
- other study design
This is an open access article distributed in accordance with the Creative Commons Attribution Non Commercial (CC BY-NC 4.0) license, which permits others to distribute, remix, adapt, build upon this work non-commercially, and license their derivative works on different terms, provided the original work is properly cited, appropriate credit is given, any changes made indicated, and the use is non-commercial. See: http://creativecommons.org/licenses/by-nc/4.0/.
Statistics from Altmetric.com
Key questions
What is already known?
Self-reports and models using geographical information systems have been mostly used to assess geographical accessibility and travel time in low and middle-income countries, including urban and rural settings.
With the advancements in geographical information systems and availability of geocoded health facility lists, there has been an explosion in the application of model-based analysis.
In studies that have used models, many authors have highlighted that it may not reflect reality and with self-reports, authors have pointed to subjectivity and issues of recall bias.
What are the new findings?
We have undertaken, to the best of our knowledge, the first comparative study looking at estimates from modelled and web-based platforms against actual replication of the journeys that women would have taken to reach comprehensive emergency obstetric care.
Our findings revealed substantial variation in travel time estimates between modelled approaches and actual journey replication.
Modelled estimates also obscured inequalities in access by concluding that all women could reach a facility within the globally set benchmark of 2 hours’ travel time.
What do the new findings imply?
Models and, in particular, large-scale national and global models may not be effective for advocacy and service planning, with subnational analyses being able to offer more in-depth exploration of geographical accessibility.
Web-based platforms which have the capacity to capture relevant and context-specific data on travel and incorporation of real-time traffic in models will be critical for service planning.
The 2-hour benchmark warrants a careful review with consideration given to more service-specific thresholds and to the other delays that women may experience but are not captured during their travel, if the goal is truly to ‘leave no one behind’.
Introduction
Every year, 295 000 women lose their lives due to complications of pregnancy and childbirth around the globe. Ninety-nine per cent of these deaths occur in low and middle-income countries (LMICs), with Nigeria, second only to India, contributing 25% in 2017.1 Timely emergency obstetric care (EmOC) provided by skilled health personnel reduces maternal deaths after women arrive at health facilities by 15%–50% and intrapartum stillbirths by 45%–75%.2 EmOC comprised nine clinical and surgical evidence-based interventions that are most effective in managing the five complications causing the majority of maternal deaths: hypertensive disorders, severe bleeding, sepsis, obstructed labour and complications of abortion. Seven of these nine interventions (parenteral antibiotics, uterotonic drugs, parenteral anticonvulsants, manual removal of placenta, removal of retained products of conception, assisted vaginal delivery and neonatal resuscitation) are classified as basic emergency obstetric care (BEmOC). In addition to BEmOC elements, blood transfusion and caesarean delivery make up comprehensive emergency obstetric care (CEmOC).3
However, delays in decision-making of women to seek care, travel of women to reach equipped health facilities and inadequate provision of appropriate care on arrival at the facility impede access to EmOC services and have been associated with worsened maternal and perinatal outcomes.4 In 2009, the WHO recommended that BEmOC and CEmOC facilities are ‘available within two to three hours of travel for most women’ and that this should be assessed to fully understand geographical distribution and accessibility of EmOC facilities.3 Subsequently, the 2015 Lancet Commission on Global Surgery defined geographical accessibility as the percentage of population that can access a facility with essential surgical and anaesthesia services within 2 hours, with a target of 80% minimum coverage by 2030.5 A 2019 systematic review found that all studies estimating travel time to EmOC facilities in LMICs were either model based or relied on women’s self-report.6 More sophisticated models at regional and global scale are being published now with advancements in geographic information systems modelling and availability of geocoded health facility lists.7 8
Two-thirds of the world’s population are expected to live in urban areas by 2050 with nearly 90% of these additional 2.5 billion urban residents expected to be concentrated in Africa and Asia.9 With the significant impact that the several consequences of urbanisation have on access to emergency health services especially for the urban poor,10 it is important to understand the accuracy of available methods in estimating travel time to health facilities within the context of an LMIC megacity. The objective of this study is to compare modelled travel time estimates to those obtained using web-based platforms, and to estimates from actual replication of travel. This is part of a larger mixed methods study that explored geographical accessibility of women to reach public CEmOC facilities in Lagos, Nigeria.
Methods
Study setting
Lagos State, located south-west Nigeria, has a mix of different geographical terrains (land and riverine) and settlement types, including a megacity, suburbs, towns, informal settlements and slums. Our study was conducted in the Lagos megacity, which is the most populous in sub-Saharan Africa with 13.5 million inhabitants in 2018.11 With an unprecedented population growth, researchers have projected that the population of Lagos will be tripled by 2050.12 Within the megacity, the most popular mode of travel is by road. However, the road infrastructure is particularly poor in many parts of the city with numerous potholes that are sometimes as wide as the road itself. The road conditions are worsened during the rainy season with flooding, though bumper-to-bumper traffic remains a constant feature irrespective of the season (dry or rainy). Efforts at road repairs are at best stop gaps and sometimes generate even more travel disruptions.13–16
Within the Lagos megacity and its surrounding suburbs, there are 16 public CEmOC facilities, including 12 general hospitals and four tertiary referral hospitals with capacity to provide all nine signal functions 24 hours/day. For this study, we focused on the four tertiary referral hospitals: Federal Medical Centre, Ebute-Metta (FMC), Lagos Island Maternity Hospital (LIMH) and the Institute of Maternal and Child Health (IMCH, commonly referred to as Ayinke House) at the Lagos State University Teaching Hospital and Lagos University Teaching Hospital (LUTH). These four hospitals are the apex public referral facilities managing the most complex obstetric emergencies referred from other public CEmOC facilities (general hospitals), private hospitals/clinics and primary health centres. In 2018, FMC, LIMH and LUTH managed 986, 3681 and 2011 deliveries, respectively. We have no data for IMCH, as this facility was only just reopened for service on 24 April 2019 after a 9-year shutdown for renovation.17 18 To reach these facilities, most women travel on their own or accompanied by their relative(s). If referral is needed, the Lagos State Ambulance system functions to transfer patients between facilities, though the service is not always available for pregnant women and when it is, it appears to mostly transfer from hospitals to other hospitals and not from primary healthcare centres.19 Traffic congestion, lack of driver etiquette with other commuters not giving way and community disturbance are some reasons that minimise the service effectiveness for patient transfer.20 21
Compared with the national maternal mortality ratio (MMR) of 512 maternal deaths per 100 000 live births (year 2017),22 MMR in Lagos State has been estimated to be 450 (95% CI 360 to 530) per 100 000 live births.23 However, estimates as high as 1050 (95% CI 894 to 1215) per 100 000 live births were reported in slum areas.24
Data collection
In this study, data were collected from review of patient records of all pregnant women who presented in obstetric emergency situations (any major pregnancy and childbirth complication) at the four CEmOC facilities between November 2018 and October 2019. Over a 6-month period, the data were extracted from the records by members of the research team supported by trained research assistants who were qualified medical doctors conversant with the patient records system in Lagos public health facilities. Records were included whether or not women were referred from another facility. Pregnant women whose complications were identified during routine antenatal visits were excluded, as their journeys did not reflect emergency situations (88 cases). In addition, we excluded cases of women who had untraceable home addresses (26 cases). In all, using a systematic sampling technique, which eliminates the risk of clustered selection,25 we sampled every second woman from the pool of 732 included patient records.
Using a predesigned online data extraction form, we captured data on demographic characteristics, obstetric history, index admission history (day and month of presentation), period of day when journey to the facility commenced (morning, afternoon, evening or night), street name of women’s self-reported start location (origin), other facilities visited en route (referral points), if any, and the destination facility.
We geocoded the origin, any referral and destination locations. Three methods were used for travel time estimation. For method 1, travel time was obtained using the cost-friction surface approach. The friction surfaces were derived from a variety of geospatial data sets, including landscape characteristics and the road network.8 The cost-friction surface approach associates a value that represents the generalised difficulty for trespassing (represented as speed) to each 1 km2 grid covering the study region depending on land surface condition (eg, roads and waterbodies). The travel time between two points was then obtained with an algorithm that identifies the path that requests the least total difficult (time). This approach has previously been used to estimate travel time to healthcare facilities both in sub-Sahara Africa and at the global scale.8 26 For method 2, we used the Open Source Routing Machine (OSRM), a routing engine designed to run on OpenStreetMap data,27 to find the fastest route between pairs of coordinates. For method 3, estimated travel time between origin and destination was obtained from Google Maps using the ‘typical time of travel’ tool for the time and day that the woman commenced her journey. In addition to an assumed speed, Google Maps also accounts for traffic condition at specified time. To collect travel time estimates via Google Maps for the period of the day when journey to the facility commenced, we used specific time slots (09:00, 15:00, 18:00 and 21:00 for morning, afternoon, evening or night journeys, respectively). Lastly, the journeys of the women to reach the facilities during the period of the day of travel, including any referrals in between, were replicated by professional motor vehicle drivers. One driver replicated the journey by following the route suggested by Google Maps at the period of the day that women commenced journeys as closely as possible. A second driver used native intelligence to navigate their route from origin to destination. These journeys were tracked with a mobile application, Life360 (Life360, San Francisco, USA). Both drivers were mandated to drive carefully and keep within the speed limit. For journeys in which we could not tell the time of the day that women commenced their journeys to the facility (33% of sample), we assumed that these journeys were made in the afternoon on the day of presentation for Google Maps extraction (method 3) and journey replication. The choice of this period was made because it offered a conservative travel time estimate in between the two known peak periods for travel in Lagos (06:30 and 11:30 (morning peak period) and 15:00 and 19:30 (evening peak period)).16 All journey replications were undertaken from 12 June 2020 to 7 August 2020 which were during the 270-day period of the rainy season expected in Lagos for the year 2020.28 29
Data analysis
Following the descriptive analysis of the sample, we compared travel time estimates obtained using the three methods with the median travel time of the two replicated journeys. The extent to which method 1 (cost-friction surface approach), method 2 (OSRM) and method 3 (Google Maps) match with the travel time estimates of journey replication was measured by the mean absolute error (MAE), root mean square error (RMSE) and the intraclass correlation coefficient (ICC) for agreement from a one-way random effects model. The MAE was used to detect bias and should be zero if the travel time estimates were unbiased. RMSE was used to measure the average magnitude of the squared error. Smaller MAE and RMSE values would indicate few errors and more ‘accurate’ estimates. ICC was used to indicate the absolute agreement between different measures. Negative ICC values suggest very appealing agreement, and positive ICC values range from 0 to 1, with greater values indicating between agreement. In addition to reporting overall MAE, RMSE and ICC, we also reported MAE, RMSE and ICC disaggregated by day in the week and time of the day, participants’ referral status and total time of journey. Lastly, we reported the percentage of women living within 60 and 120 min of travel to the CEmOC facilities they attended, based on the estimates and the journey replication. Analysis was carried out using the ‘osrm’ and ‘gdistance’ packages in R V.4.0.2 (R Development Core Team, Auckland, New Zealand); all maps were drawn with the ‘ggmap’ package, including the tile server for Stamen Maps. There were no missing data.
Patient and public involvement
Patients and/or the public were not involved in the design, conduct, reporting or dissemination of this research.
Results
Table 1 presents a summary of the obstetric and demographic history of the included women. Of the 385 pregnant women, 291 (76%) were aged 20–34 years, 345 (90%) were married and 142 (37%) were self-employed. Regarding the index pregnancy, 279 (72%) travelled on a weekday, 100 (26%) commenced their journey to the facility in the morning and 132 (34%) were referred.
Characteristics of pregnant women included in the study (n=385)
Travels of the 385 pregnant women leading to the four destination facilities, including 161 (LIMH), 98 (LUTH), 93 (FMC) and IMCH (33), were mapped (figure 1).
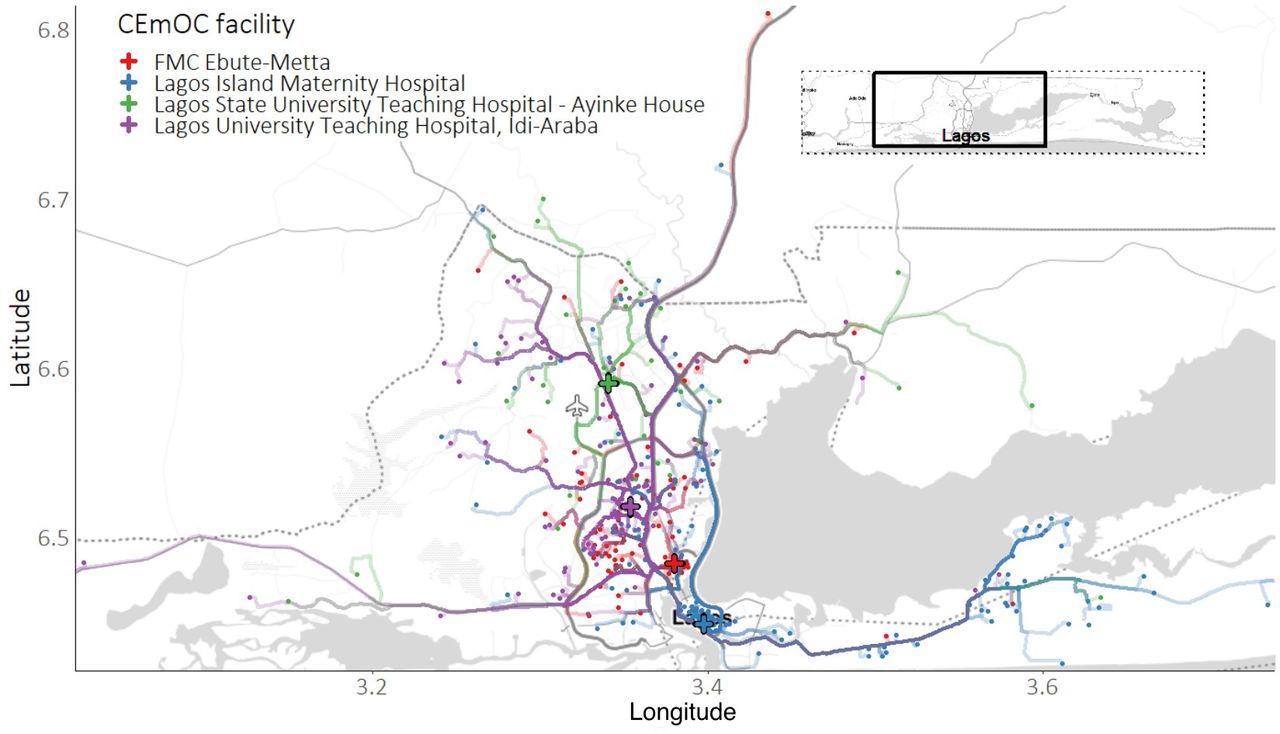
Journeys of 385 women from origin to destination of care (CEmOC facilities). CEmOC, comprehensive emergency obstetric care.
Depending on the estimation method, between 14% (cost-friction surface approach) and 17% (OSRM) of the 385 women used their nearest CEmOC facility (of all 24 facilities offering such services in the study area). Among women who were referred (n=132), 9–18 (10%–14%) used their nearest CEmOC facility. This contrasted with 42–50 (17%–20%) for women who were not referred.
Travel time of pregnant women in emergency situations to CEmOC service
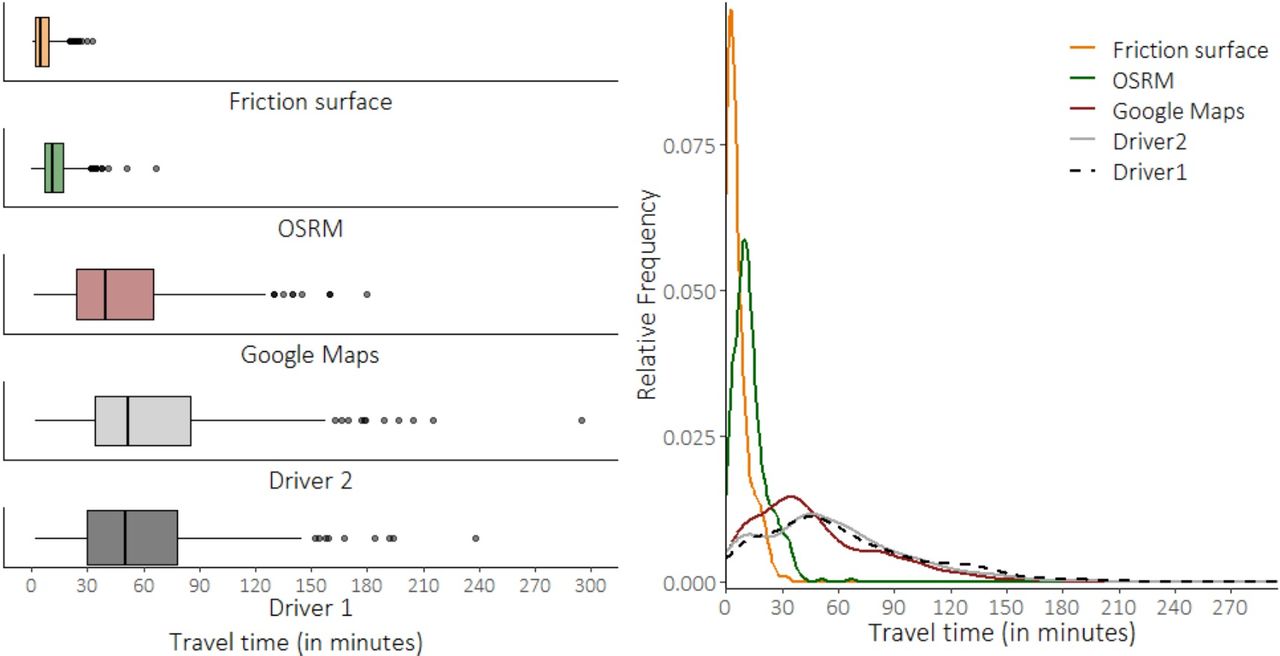
The median and mean travel time estimates were 5 and 6 min (cost-friction surface approach), 11 and 13 min (OSRM) and 40 and 48 min (Google Maps), respectively. The median and mean driving times between driver 1 and driver 2 were nearly identical (driver 1: median 50 min, mean 57; driver 2: median 52, mean 62) (figure 2).

Boxplot and density plot of travel time between participants’ origin and destination (comprehensive emergency obstetric care facilities). OSRM, Open Source Routing Machine.
Travel time estimates of the three methods versus replication of journey
The estimated travel time was shorter than the mean time produced by the two drivers for all 385 women using the cost-friction surface approach, 383 women using OSRM and 292 women using Google Maps (figure 3).

Estimated travel time versus replication of journey by two drivers (mean). The diagonal line in panel (A) and the horizontal line at 100% in panel (B) indicate perfect matching between travel time estimates and mean driving time replicated by driver 1 and driver 2. OSRM, Open Source Routing Machine.
At its best matching (closest to median drive time of drivers 1 and 2), cost-friction surface approach estimate (3 min) was 52% of actual driving time (6 min), OSRM (8.2 min) was 97% of actual driving time (8.6 min) and Google Maps was 100% for 14 women varying between 2 and 102 min. The median estimated travel time of the cost-friction surface approach, OSRM and Google Maps estimates as a percentage of actual travel time was 9% (IQR=6%–14%), 23% (IQR=17%–30%) and 85% (IQR=69%–98%).
The MAE between cost-friction surface approach and replication of journey was 53 min. That is, the average magnitude of the absolute error was almost an hour (53 min) different (shorter, in this case) from replicated travel using the cost-friction surface approach to estimate travel time. The MAE between OSRM and Google Maps was 46 and 14 min, respectively. RMSE between the three methods and replication of journey was 64 (cost-friction surface approach), 57 (OSRM) and 21 (Google Maps) min, respectively. The ICCs for absolute agreement between cost-friction surface approach and OSRM and replicated journeys were −0.34 and −0.19 (both indicating an appalling agreement), while for Google Maps estimates was 0.85 (table 2).
MAE, RMSE and ICC for agreement with actual driving time
By period of day and weekday/weekend, referral status, and time and distance covered
Among observations with a known period of day of travel, most happened in the morning on a weekday (n=69) and the least happened at the weekend at night-time (n=10). The smallest differences between replicated travel and estimated travel time were seen for night-time journeys at weekends. The MAEs for this period of day were 21, 13 and 2 min for the cost-friction surface approach, OSRM and Google Maps. On the other hand, the largest errors were found for night-time journeys at weekdays. Journeys of women who were referred had larger errors compared with journeys of women who were not. For instance, the MAEs were 68 vs 45 (cost-friction surface approach), 61 vs 39 (OSRM) and 16 vs 13 (Google Maps). For all estimation methods, shorter journeys had lesser extent of error and agreement compared with longer journeys. For journeys that took more than 120 min (n=30), MAEs were 131, 120 and 37 min by the cost-friction approach, OSRM and Google Maps, respectively. A similar pattern was observed when the journeys were disaggregated by estimated distance (table 2).
Benchmarking geographical accessibility to CEmOC
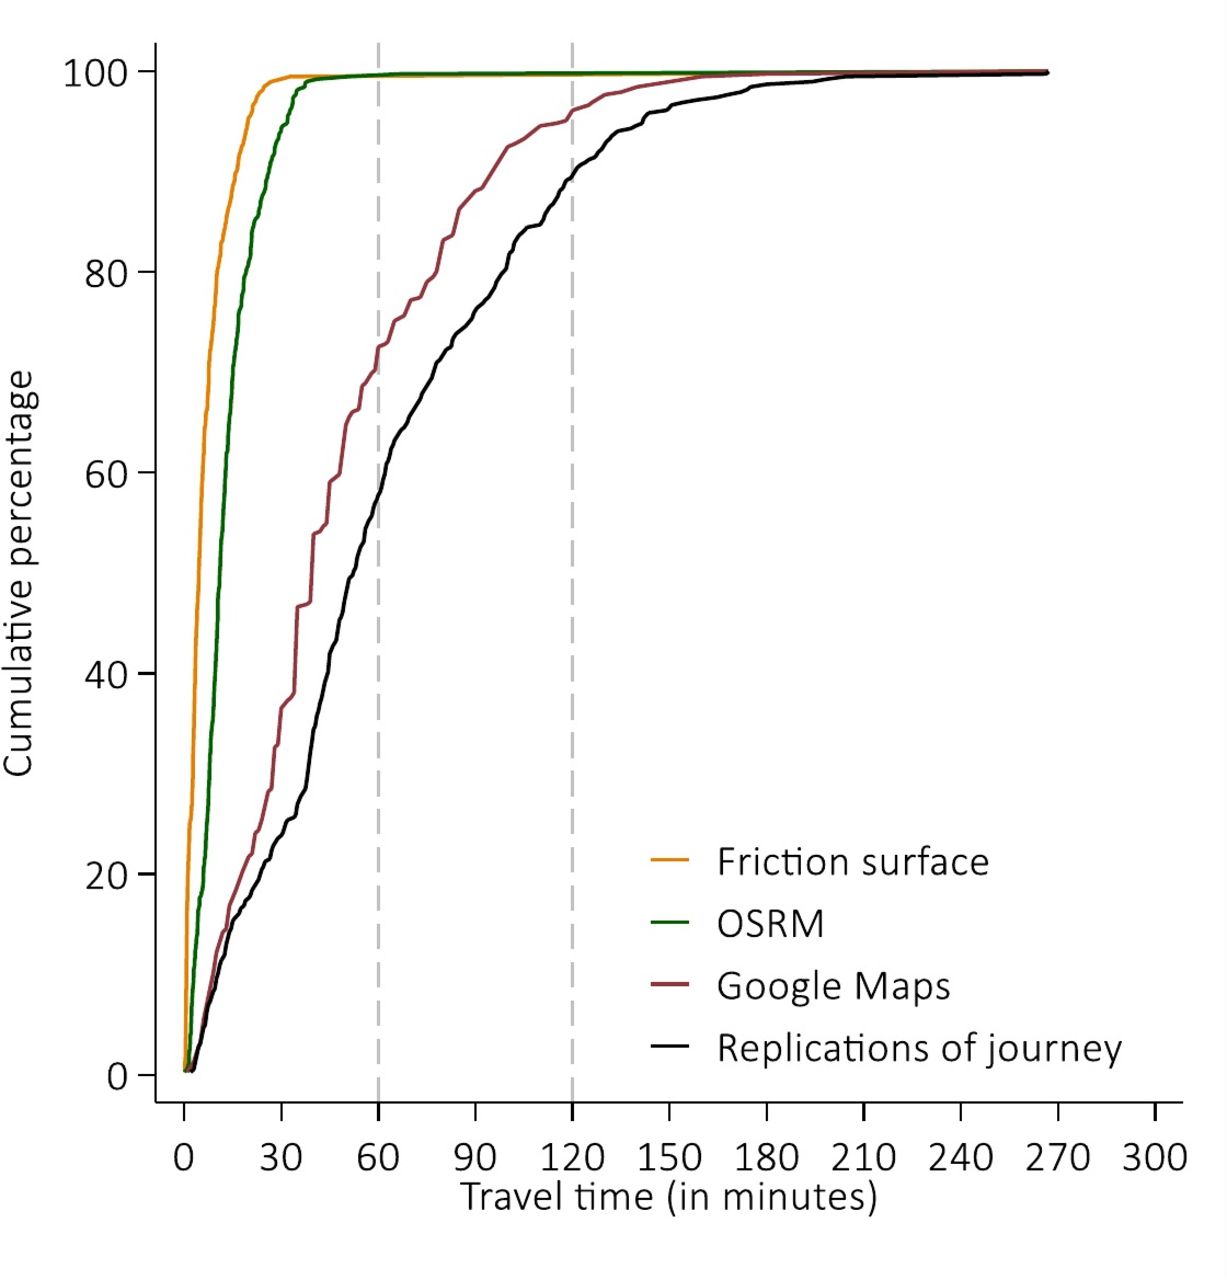
Lastly, 92% of the sample lived within 120 min of replication travel time from the CEmOC facility where they received care (figure 4). According to the cost-friction surface approach, OSRM and Google Maps estimates, this was 100%, 100% and 95%, respectively. Replication of driving time showed that 57% of women lived within 60 min of travel from the visited CEmOC facility, which contrasted with 100%, 100% and 70% for the three different methods.
Cumulative percentage of travel time to reach comprehensive emergency obstetric care by 385 women. OSRM, Open Source Routing Machine.
Discussion
By collecting data from clinical records of pregnant women using CEmOC facilities, we have, for the first time, been able to compare the travel time estimates obtained using popular tools with the reality that the women would have experienced. For our study sample, median travel time was estimated as 5, 11 and 40 min using the cost-friction surface approach, OSRM and Google Maps, respectively. In reality, however, median drive time was 60 min as replicated by two independent private car drivers. Agreement between travel time estimates and real-life driving time was particularly poor for the cost-friction surface approach and OSRM, and for weekday night-time travel and journeys longer than 120 min in all methods.
Modelled approaches such as the cost-friction surface approach and OSRM have been widely used to estimate travel time and to assess the extent of accessibility of healthcare in LMICs in general, not just for obstetric emergencies.6–8 While the limitations of using modelled travel time to indicate real-life travel have been acknowledged,6 30 31 our findings highlight that the errors produced by using cost-friction and OSRM using currently available associated speed data are too large for these tools to be deemed representative of actual travel time in cities. A publication in 2020 by Rudolfson and colleagues showed that even in rural settlements, self-reported times are longer than modelled estimates by a factor of 1.50 for women seeking CEmOC services.32 We show that in a large sub-Saharan African megacity like Lagos, model-based methods are closest to actual travel time only over short distances (especially journeys <10 min), and underestimate travel time by an order of magnitude for longer journeys. This underestimation has significant impact on maternal and perinatal survival. Researchers who have used these two modelling approaches have either assumed that women travelled to the nearest facility or that they were referred from BEmOC to CEmOC facilities.33 However, this is not always the case.19 34 35 While there are personal reasons for some women not to travel directly to the nearest facility,19 our study suggests that for a fifth of our sample a referral to apex referral facilities farther away from women’s residence was needed. In addition, in megacities like Lagos, decisions about whether, where and how to travel are influenced by traffic conditions, perceptions of safety, cost of transport, time of travel and poor roads.19 In Bangladesh, an Asian megacity, congested traffic conditions mean that 37% of the city’s slum population cannot access emergency services within 1 hour.10 These crucial influences on travel time are not accounted for in cost-friction surface approach and OSRM. When both cost-friction surface approach and OSRM were compared previously, larger discrepancies were reported for long travel time estimates.36
On the other hand, Google Maps, which benefits from real-time traffic data, had a median estimate as a percentage of actual travel time of 85%. As per a 2019 systematic review, there has been no use of such web-based platform in estimating travel time in LMICs,6 as has been done in high-income countries.37 This may be because Google Maps queries after a certain number of requests need to be paid for. Such costs could be prohibitive for LMIC researchers.6 There is also the question of scale of analysis. In using Google Maps for our study, we had to individually trace journeys. In a study conducted in rural Mzuzu community, Malawi, the authors using Google Earth combined with global positioning satellite individually found locations of 79 traditional birth attendants and traced from their facilities to formal health facilities in the area.38 Our study was conducted across multiple facilities and on a wider scale. This approach of travel time extraction can be time consuming and is not an efficient process. However, as per our study findings, it was clear that while not perfect, a web-based platform like Google Maps offered estimates that were closer to reality. Strengths of Google Maps have been highlighted in the literature, including its use of relatively up-to-date road data set, capacity to account for traffic and consideration given to peak and off-peak hours.39 These are all important elements altering travel experiences in megacities.16 In our study, there were few instances in which Google Maps time estimates were higher than the median replicated travel time. We attributed this to the application of native intelligence of driver 2 in using short cuts to reach their destination.
Whichever method was used, we found that the smallest differences between replicated travel and estimated travel time were for night-time journeys at weekends, while the largest difference was in night-time journeys on weekdays. This might be because traffic is worst in the Lagos metropolis from evenings onwards during the weekdays when commuters are returning from work.16 We also found that journeys which took less time had the closest estimates using all three methods, and journeys that took longer time had most errors and least agreement. This was expected, as shorter journeys will have fewer encumbrances that can prolong actual travel time.
Comparing our travel time estimates to the global benchmark of 80% of women reaching CEmOC facilities within 2-hour travel time,5 all three methods estimated that this target was exceeded. However, both cost-friction surface and OSRM estimated that all women got to facilities within 2 hours, though in reality 8% did not. This error obscuring the inequality in access to critical services has large implications for advocacy for service provision and service planning for life-saving maternal and perinatal care.
Our study has some limitations. First, we replicated journeys but cannot confirm that these were the actual times it took the women, since new road constructions or further damage to the roads may have reduced or increased travel time. Second, our data did not capture whether and how long women stopped on the journeys to the destination hospital. Third, though we had data on the months of presentation and could have aggregated these to assess seasonal patterns that may influence travel, we have not replicated the journeys in the months that the women presented. This would have required yearlong replication of travel yet no one of the methods of travel time estimates has capacity to show seasonal variation in travel time. In any case, by driving during the rainy season, we were able to replicate their journeys during the worst-case scenario. However, replicating journeys in the rainy season also gives a worst-case difference between the modelled times and the replicated times, and it may be the case that this difference could have been smaller if journeys were also replicated during the dry season when road infrastructure is better. However, reports from regular road users in Lagos and researchers suggest that many roads are in deplorable conditions and traffic is significant in both dry and rainy seasons.15 40 Fourth, not all women would have travelled by private car, so it is likely that our driver replication would be the most direct and probably fastest way of getting to the hospitals, as public transport would require some waiting time. We also have not accounted for the time it might have taken women to get transport ready after they have decided to go to a facility. This means that the difference in women’s actual journeys and the estimates produced by models may in reality be even greater. Attempts to retrospectively contact the women to capture self-reported travel time raised serious ethical concerns, especially for those who had traumatic birth experiences. In any case, issues of recall bias and subjectivity, which minimises validity of estimates, have been reported with this approach.32 However, we know that in emergencies, some pregnant women in Lagos take extreme measures such as driving in breakdown or oncoming lanes illegally or deserting their motor vehicles to hail motorcycles that would move faster through gridlocks to reach facilities.19 Altogether, re-enacting the exact journeys of the women was not our goal. To account for any variation in the actual travel, we had two drivers independently replicating travel. This is a strength in our study design.
Going forward, models need to take into account the variable traffic conditions, as was done by Ahmed et al.10 While this draws models closer to reality, there will still be a gap in linking populations to actual facilities of care, as we have done in our study. This is particularly important if available tools are going to be truly effective for tackling inequities in geographical coverage in LMICs. On the other hand, web-based platforms should be mainstreamed into efforts to support evidence generation for health service delivery at next to no cost to researchers and service planners. While advocacy to big tech mapping companies like Google and ESRI to provide these ‘life-saving’ data will be a sensible next step, open-source platforms such as the World Bank-supported OpenTraffic (http://opentraffic.io/) should be promoted. Supporting the growth, development and distribution of free transport data for academic and policy use will make models more relevant for urban settings.
For benchmarking, there is a need to review the 2-hour threshold set for travel to access services like EmOC.3 5 Recommending indicators that capture geographical access was a necessary first step.41 However, if the data feeding into these indicators are not reflective of reality, then their validity will be questionable. LMIC urban settings, more so, megacities, are getting too congested to use such wide travel benchmarks for service planning. In any case, pregnancy and childbirth complications can quickly escalate ‘in less than two hours’, and for some women even in minutes.42 43 In our study, we identified women who travelled for longer than 2 hours within the city, and this is without any other personal and structural points of delays that women may have faced. Our finding is particularly concerning when consideration is given to women who live in more periurban and slum areas need to reach these apex referral facilities, which can be remote even where they exist within cities. In a Tanzanian study, excluding time to first facility, modelled median travel time estimates of actual facility referrals from periurban to urban area were 156.4 min (IQR: 7.9–356.6 min).44 As per our findings, real travel time will be longer. Even after getting to these apex hospitals, evidence shows that women could still face an additional 60 min (IQR: 21–215 min) delay between diagnosis and receiving life-saving interventions.45 In many LMIC settings including cities, ambulances are not particularly effective and even if an ambulance is used during referral, due to lack of regard by other road users and emergency road lanes, women are still not guaranteed to reach the facility in good time.19 Another key consideration is that a CEmOC facility being available within 2 hours does not guarantee that the facility can provide the service that the woman needs. Due to such service gaps, service-specific geographical accessibility metrics that reflect service availability (24 hours/not) will be more informative for service planners. Many of these considerations require a ‘local gaze’, minimising the relevance of large-scale model-based studies that assume availability and functionality of facilities. For example, recent large-scale models suggest that geographical accessibility targets have been met and travel can be done to health facilities within 1 hour in the same geographical space in which we conducted our study.7 8 30
Conclusion
Prolonged travel time can have huge repercussions for women in need of life-saving obstetric care in urban settings. It influences their choice to deliver at an EmOC facility or at home,46 and contributes to worse outcomes for pregnancy and childbirth.47 Our study only describes women who made it to a facility, there are others who did not—ranging in reasons from having decided against travelling altogether to dying on the way. The urgency to meet the health needs of populations living in LMIC cities and megacities, including slums and periurban areas in the post-2015 era, has been established.48 However, if travel time estimates are to be more applicable to ‘leaving no one behind’, especially in LMIC urban settings, then leveraging tools that reflect closer to the reality of women trying to reach facilities offers more relevant evidence to support service planners and policymakers.
Acknowledgments
We are grateful to the Lagos State Government, in particular, the Lagos State Ministry of Health and the Lagos State Health Service Commission, for their support in gaining access to all state-owned facilities. We also thank the leadership of federal government-owned facilities (Federal Medical Centre Ebute-Metta and Lagos University Teaching Hospital) included in our study for their support. We are also indebted to the drivers who replicated the journeys.
References
Footnotes
Handling editor Seye Abimbola
Twitter @abankethomas, @kerrylmwong, @lenkabenova
Contributors ABT conceived the study. ABT, KLMW and LB designed the study. ABT, FIA and ROGA led the data collection. ABT and KLMW did the statistical analyses. ABT and KLMW wrote the first draft of the article. All authors critically reviewed the article and approved the final draft.
Funding This research was funded by grant provided by AXA Research Fund.
Map disclaimer The depiction of boundaries on this map does not imply the expression of any opinion whatsoever on the part of BMJ (or any member of its group) concerning the legal status of any country, territory, jurisdiction or area or of its authorities. This map is provided without any warranty of any kind, either express or implied.
Competing interests None declared.
Patient and public involvement Patients and/or the public were not involved in the design, or conduct, or reporting, or dissemination plans of this research.
Patient consent for publication Not required.
Ethics approval We obtained ethical approval from the Research and Ethics Committees of Lagos State University Teaching Hospital (LASUTH) (LREC/06/10/1226) and Lagos University Teaching Hospital (LUTH) (ADM/DCST/HREC/APP/2880). Social approval was received from the Lagos State Government (LSHSC/2222/VOLII/107). As this study was based on patient records, we minimised the risk of patient identification by not collecting data on patient names and specific street numbers. In mapping, we selected midpoint of streets of origin to ensure that participants cannot be identified.
Provenance and peer review Not commissioned; externally peer reviewed.
Data availability statement All data relevant to the study are included in the article or uploaded as supplementary information.