Article Text

Abstract
Introduction The Sustainable Development Goals framed an unprecedented commitment to achieve global convergence in child and maternal mortality rates through 2030. To meet those targets, essential health services must be scaled via integration with strengthened health systems. This is especially urgent in Madagascar, the country with the lowest level of financing for health in the world. Here, we present an interim evaluation of the first 2 years of a district-level health system strengthening (HSS) initiative in rural Madagascar, using estimates of intervention coverage and mortality rates from a district-wide longitudinal cohort.
Methods We carried out a district representative household survey at baseline of the HSS intervention in over 1500 households in Ifanadiana district. The first follow-up was after the first 2 years of the initiative. For each survey, we estimated maternal, newborn and child health (MNCH) coverage, healthcare inequalities and child mortality rates both in the initial intervention catchment area and in the rest of the district. We evaluated changes between the two areas through difference-in-differences analyses. We estimated annual changes in health centre per capita utilisation from 2013 to 2016.
Results The intervention was associated with 19.1% and 36.4% decreases in under-five and neonatal mortality, respectively, although these were not statistically significant. The composite coverage index (a summary measure of MNCH coverage) increased by 30.1%, with a notable 63% increase in deliveries in health facilities. Improvements in coverage were substantially larger in the HSS catchment area and led to an overall reduction in healthcare inequalities. Health centre utilisation rates in the catchment tripled for most types of care during the study period.
Conclusion At the earliest stages of an HSS intervention, the rapid improvements observed for Ifanadiana add to preliminary evidence supporting the untapped and poorly understood potential of integrated HSS interventions on population health.
- health systems evaluation
- health services research
- maternal health
- child health
- cohort study
This is an Open Access article distributed in accordance with the Creative Commons Attribution Non Commercial (CC BY-NC 4.0) license, which permits others to distribute, remix, adapt, build upon this work non-commercially, and license their derivative works on different terms, provided the original work is properly cited and the use is non-commercial. See: http://creativecommons.org/licenses/by-nc/4.0/
Statistics from Altmetric.com
Key questions
What is already known?
Interventions that strengthen one or several of the WHO health system building blocks can result in increases in service quality, higher healthcare utilisation and even reductions in mortality rates.
While the need for integrated health system strengthening (HSS) has been established, new initiatives tend to focus on discrete interventions that seem more scalable, such as e-health or the strengthening of community health.
What are the new findings?
After the first 2 years of integrating HSS activities across all levels of care within a government district, we observed rapid increases in the population coverage of maternal and child health services, a reduction of wealth-related inequalities and a tripling of utilisation at supported health centres.
We observed a decline in under-five mortality rates of 19.9% in the HSS catchment population, which, although it was not statistically significant, is close to some of the fastest rates of reduction reported at a subnational level.
What do the new findings imply?
Support to all levels of care and building blocks within local health systems may be necessary to achieve effective coverage of existing technologies and services, especially in rural areas.
In order to achieve global convergence in child and maternal mortality rates, the current focus on vertical interventions should be integrated with substantial investments in stronger health systems rooted in primary care.
Introduction
The Millennium Development era marked a significant expansion of health services and corresponding reductions in mortality rates in low-income countries. In 2015, the average rates of maternal and under-five mortality in sub-Saharan Africa had decreased by half compared with 1990 levels.1 2 However, the gap between what can be accomplished and what is being implemented around the world remains wide.3 4 According to The Lancet Commission on Investing in Health,3 10 million lives could be saved if existing technologies and services were scaled up among low/middle-income countries. Yet, an estimated 400 million people globally continue to lack access to essential health services.5 A key element to scaling up effective health delivery services is stronger health systems rooted in integrated primary care.4 6 WHO frames health system strengthening (HSS)7–9 as involving six reinforcing building blocks: service delivery, health workforce, health information systems, medicines and supplies, financing, and leadership and governance.10 11 Despite the broad acceptance of HSS within the global health community, most international development assistance for health continues to be directed to specific health focus areas (‘vertical programs’) such as HIV, tuberculosis and malaria.12
There are two broad kinds of approaches for strengthening health systems. First, large-scale HSS efforts at the national level tend to focus on specific building blocks (eg, financing through health insurance mechanisms; investments in public sector health workforce) that have inherently cross-cutting benefits for health outcomes. Evaluation for such programmes is often done through ‘before-after’ comparisons in one or several countries using data aggregated at the country level, such as Demographic and Health Surveys (DHS).11 13–15 Such large-scale studies are prone to confounders, and it is often not known whether policies designed at the national level improve service delivery locally at the point of care.16 17 Second, a number of pilot HSS initiatives have focused on multiple building blocks at one or several levels of care within a local health system.18–23 The complexity of such initiatives, which require opportunistic adaptation, creates challenges for rigorous evaluation, and the evidence of population-wide health impacts for any health intervention is still limited.22 24 Recently, evaluation approaches of horizontal interventions and policies have been proposed based on the longitudinal assessment of a set of core indicators (eg, utilisation rates, intervention coverage, mortality rates) using a combination of population surveys and health system data.10 25–27 A key challenge is that the data systems necessary for impact evaluation are generally insufficient, often lacking true population baselines or clear comparison groups.
In 2014, a new HSS initiative was implemented in the district of Ifanadiana to create a model health district in Madagascar, one of the poorest countries in the world which has the lowest per capita spending on healthcare.28 29 Guided by national policies and in partnership with the Madagascar Ministry of Health (MoH), the non-governmental organisation PIVOT began implementing HSS efforts that support all six building blocks at all levels of care within a government district, combined with an integrated prospective monitoring, evaluation and research platform.30 Here we present an evaluation of the HSS intervention after the first 2 years, relying on data from (1) a 2014 baseline household survey and a 2016 follow-up survey of the same households; and (2) health management information systems data from the 13 district health centres. The aim of the study is to evaluate changes in intervention coverage, healthcare inequalities and health outcomes in the population of Ifanadiana, both within and outside the initial intervention catchment.
Methodology
Study site and intervention
Ifanadiana is a rural health district of approximately 200 000 people located in the region of Vatovavy-Fitovinany in Southeastern Madagascar. As per MoH norms, Ifanadiana district has one reference hospital, one primary care health centre for each of its 13 communes (subdivision of a district with ~15 000 people) and two community health workers (CHW) for each of its 195 fokontany (subdivision of a commune with ~1000 population). In 2014, our baseline survey revealed that maternal and under-five mortality rates in Ifanadiana were 1044 per 100 000 and 145 per 1000, respectively (more than twice the national mortality estimates).31 The district population relied mostly on agriculture as the primary activity (84.8%), and nearly three-quarters lived in extreme poverty.31 Poverty, geographical barriers and unreliable health services were associated with limited access to healthcare in the district, which was substantially lower than average estimates for Madagascar.31 32
The integrated HSS intervention carried out by the PIVOT-MoH partnership was guided by existing MoH policies (summarised in table 1), covers all six building blocks and is implemented across all three levels of care in the district (community, health centre and hospital). This intervention is structured through the integration of horizontal improvements in system ‘readiness’, vertically aligned clinical programmes and information systems. Readiness includes infrastructure and sanitation, staffing and equipment to improve the quality of care; procurement systems; an ambulance network; the removal of user fees and provision of social support to patients; and trainings and frequent supervision of health staff. The clinical programmes included malnutrition and integrated management of child illness (IMCI) through strengthened community health programmes, primary healthcare centres and hospital (details can be found in ref 30). The information systems included facility-based registries, routine monitoring and evaluation systems and population-based household surveys. The core activities in the first 2 years covered approximately one-third of the population of Ifanadiana (referred to as ‘PIVOT catchment’), with some activities such as medical staff recruitments spanning the whole district (table 1).
Summary of HSS interventions implemented in Ifanadiana district between 2014 and 2016, classified by building block of HSS* affected. These included the PIVOT intervention at all three levels of care in its initial catchment area, the PAUSENS project at the primary care level and the Mikolo project at the community health level. Details of each intervention are provided in the main text and online supplementary appendix S1
Supplementary file 1
In addition to PIVOT’s intervention, the population of Ifanadiana benefited from two other notable programmes that covered both the PIVOT catchment and the rest of the district (RoD). First, the PAUSENS project, funded by the World Bank, provided a basic package of services free of charge in all 13 major health centres for every woman attending the health centre for antenatal, delivery or postnatal care (first 6 weeks) and children under age 5 with any illness.33 The project also included trainings, support for child vaccination in remote areas and some donations of equipment and furniture to health centres. Second, the Mikolo project, funded by the US Agency for International Development, provided support to a network of 150 CHWs in the remote Fokotany (further than 5 km from a health centre) of eight communes in Ifanadiana, four of which were in the PIVOT catchment and four in RoD. The project organised annual trainings and periodic supervision, provided some equipment, supplies and an initial stock of medicines to each CHW. All the interventions are explained in detail in the online supplementary appendix S1. The main difference between PIVOT catchment and RoD (our control group) was the implementation of the PIVOT HSS intervention.
Population survey data
A longitudinal cohort study was designed to obtain demographic, health and socioeconomic information from a representative sample of 1600 households in Ifanadiana district over time. Questionnaires were adapted from the DHS,34 with additional questions from other internationally validated surveys such as the Multiple Indicator Cluster Survey.35 Data collection, survey coordination, training and oversight were carried out by the Madagascar National Institute of Statistics (INSTAT), which implements all major national health surveys in the country. A two-stage sample stratified by PIVOT’s initial catchment area and the RoD was used to estimate indicators for each of the intervention and non-intervention areas, as well as Ifanadiana district as a whole. Eighty clusters, half from each stratum, were selected at random from enumeration areas mapped for the 2009 census. Individual households were then mapped within each cluster, and 20 households were selected at random from each cluster.
Between April and May of 2014, individual face-to-face interviews were conducted with all women aged 15–49 years and men aged 15–59 years (usual residents or visitors) in 1522 of the sampled households (95.1% response rate). The original 1600 households were revisited between August and September 2016; any missing or refused households were replaced with others from the same cluster using a predefined random replacement list. Overall, 1514 households were interviewed during the follow-up survey (94.6% response rate). All residents, including children, had weight and height measured (or length in the case of infants). Data collected in the questionnaires included, among others, household composition (size, genders, ages); indicators of socioeconomic status (education, employment, household durable assets); illness in the last 30 days; preventive behaviours (bed net ownership, access to water and sanitation); women’s reproductive history and care-seeking behaviours for reproductive health; children’s health, development and care-seeking for illness; and adult, maternal and child mortality.
French and Malagasy questionnaires used in the cohort, as well as data collection protocols, had been standardised and validated for Madagascar during previous national surveys carried out by INSTAT. The study was approved by the Madagascar National Ethics Committee and Harvard Medical School IRB. All adults (≥15 years) provided verbal consent for the in-person interview and anthropometric measurements. Parents or guardians provided consent for children ≤5 years of age. INSTAT provided survey data to the investigators with all individual identifiers removed and with geographical information at the cluster level. Spatial boundaries of each cluster were made available to the investigators and are stored separately; this information will not be published or shared publicly. Further details on data collection and survey design are available in ref 31.
Health system utilisation data
For the period of January 2013 to December 2016, we obtained data from the MoH for all 13 primary care public health centres (CSB2) in Ifanadiana district on the number of new individuals per month attending each health centre for outpatient consultations or maternal care. These data were available from the health centres’ monthly activity report to the district ("revue mensuelle d’activité", RMA), which is aggregated from the health centres’ registries every month by MoH staff. We excluded the six basic health centres (CSB1) in the district because these lack medical doctors and provide a more limited number of health services. As a component of the HSS intervention, data quality was maintained through joint MoH-PIVOT supervision of monitoring and evaluation carried out every 3 months at a subset of health centres to compare RMA values with registry data (see ref 32 for more details). From May 2015, the MoH changed the estimation and reporting of outpatient utilisation rates. Thus, we gathered all subsequent utilisation data directly from the registries to ensure consistent estimates throughout the 2013–2016 period. Information on total catchment population was obtained from official MoH records. Consistent with MoH estimates, catchment population of children under-five, expected number of pregnant women and expected number of deliveries were set at 18%, 4.5% and 4% of the total catchment population, respectively. Since official population estimates could be inaccurate, we also estimated catchment populations using available data from WorldPop36; we run additional analyses of per capita utilisation rates based on those data (see details in the online supplementary appendix S2).
Data analysis
Population-level under-five mortality was estimated using the synthetic life table method for DHS surveys.37 Under-five mortality was defined as the probability of death before age 60 months per 1000 children born alive. For each survey wave, we used information from the 5 years prior to the survey, which comprised a sample of 4063 children for 2014, and 4037 children for 2016. In addition to these cross-sectional estimates, the observed difference in under-five mortality for the 1446 children followed up over the 2 years was also assessed in each area. From this longitudinal analysis, incidence rates of death per person-year in under-five children were calculated using Poisson regression. Coverage indicators (see list in table 3) were estimated strictly using standard definitions for DHS surveys.37 Vaccination coverage was defined as the proportion of children aged 12–23 months who received all recommended vaccines (three doses of polio and DTP, one dose of BCG and measles). Access to treatment was estimated as the proportion of children under 5 years of age who were ill with either fever, acute respiratory infection (ARI) or diarrhoea in the 2 weeks prior to the survey and sought medical treatment (at a hospital, health centre or CHW). In order to measure the effect of PIVOT’s interventions on maternal health service coverage, indicators were estimated for the last pregnancy during the last 2 years. In addition, to track a summary indicator of maternal, newborn and child health (MNCH) intervention coverage, we estimated a modified version of the composite coverage index (CCI)38 that included all standard interventions except for family planning, which was not available in the 2014 survey (see online supplementary appendix S2 for details in the estimation of CCI).
Changes in population-level child mortality rates* in PIVOT initial catchment and the rest of Ifanadiana district (RoD) between 2014 and 2016
Coverage and mortality indicators were calculated for 2014 and 2016 both within PIVOT’s initial catchment area and for the RoD. Differences in coverage between PIVOT catchment and the RoD for each year were tested through Pearson Χ2 tests, adjusted by second-order Rao & Scott approximation.39 Absolute and relative trends were estimated for the 2014–2016 period and difference-in-differences (DiD) analyses were conducted to evaluate the statistical difference in the trends between the two areas.40 A separate analysis was carried out controlling for household wealth and proximity to the main (paved) road to explore whether these changed DiD estimates (online supplementary appendix S2 and table S1). Data were entered into CSPro and all analyses were done using R statistical software V.3.1.2,41 with the exception of population-level mortality rates and associated 95% CIs, which were calculated with SAS V.9.3, and the observed under-five mortality incidence rate ratios, which were calculated with Stata V.13 (College Station, TX). Sampling weights that adjusted for unequal probability of selection due to stratification and non-response were calculated for household, women’s and men’s surveys. All estimates were done using survey commands available in R package survey and applicable sampling weights.39
To assess trends in economic inequality for these coverage indicators, wealth indices were calculated for the population of Ifanadiana following standard DHS methods.37 Briefly, household physical assets were included in a principal component analysis and then the scores from the first principal component were used. Households were classified into five wealth quintiles, with cut-off points at 20%, 40%, 60% and 80% of the cumulative wealth distribution. The first two quantiles (poorest) and the last three (wealthier) were grouped together. For each indicator, we estimated wealth-specific averages in the intervention area as well as composite indicators of inequality, such as relative concentration index (RCI) and slope index of inequality (SII).42 The RCI is a measure of relative inequality based on the concentration curve, a plot of the cumulative distribution of each coverage indicator (y-axis) in the population ranked by wealth (x-axis) and adjusted by survey weights.42 The RCI is defined as twice the area between the line of equality (45° diagonal line) and the indicator’s concentration curve, and was calculated using R package decomp.43 The SII is a measure of absolute inequality that represents the difference in coverage between the highest and the lowest values of the wealth rank (normalised between 0 and 1). It was estimated at the individual level as the slope of the health outcome on the individual wealth ranks in a logistic regression, adjusted by survey weights.42 44
Using health centre data, we calculated the annual average in per capita utilisation rates for maternal care (antenatal care, first and fourth visits, deliveries and postnatal care) and outpatient care (all patients and children under-five). We estimated annual changes during the 2013–2016 period for health centres inside and outside of PIVOT’s initial catchment area using linear regression models with an interaction term and described as:
 (1)
(1)
where Yij is the average per capita utilisation rate for yeari and catchmentj (inside or outside); β1 is the yearly change outside the catchment area, β2 is the baseline difference in utilisation between catchments, and β3 is the yearly change associated exclusively with the intervention (p values for β3 coefficient are reported). Equation 1 is a standard DiD formulation, equivalent to the analyses carried out for survey data.
Results
In the 2 years since initiation of programmes, under-five mortality decreased from 104.1 (95% CI 72.6 to 135.5) to 84.2 (95% CI 54.3 to 114) per 1000 live births in the initial catchment area, a relative change (RC) of 19.1%. Infant mortality in the initial catchment decreased from 66.1 (95% CI 40.4 to 91.9) to 57.8 (95% CI 37.3 to 78.3) and neonatal mortality from 47.3 (95% CI 26.9 to 67.7) to 30.1 (95% CI 15.0 to 45.2) per 1000 live births, an RC of 12.6% and 36.4%, respectively. The RoD experienced comparable reductions in under-five mortality from 168.6 (95% CI 128.2 to 208.9) to 143.5 (95% CI 110.9 to 176.0) per 1000 live births (RC 14.9%), but nearly no change in infant or neonatal mortality rates (table 2). In addition to these 5-year population averages, the observed incidence rate of death in the 1446 children under-five followed up between 2014 and 2016 was 2.2% per person-year (32 deaths) in the catchment area and 2.9% per person-year (74 deaths) in the RoD; an incidence rate ratio of 0.79 (95% CI 0.50 to 1.21). Despite these substantive improvements, we did not find statistical differences in the mortality trends between the two areas (p=0.26). The CCI, a summary measure of MNCH coverage, improved from 49.3% to 64.1% (RC 30.1%) in PIVOT catchment but changed little in the RoD from 43.2% to 44.9% (table 3). All coverage indicators evaluated improved more in PIVOT catchment than in the RoD, except for antenatal care (4+ visits). The largest difference in trends between the two areas was seen for curative interventions for children under-five, which improved over 20 percentage points in PIVOT catchment while it remained unchanged or worsened in the RoD. This resulted in a trend difference of 33.7 percentage points for children receiving oral rehydration therapy for diarrhoea (p<0.01), 27.3 percentage points for care-seeking for fever (p<0.05) and 19.25 percentage points in care-seeking for suspected pneumonia (ARI, p<0.1). Coverage for maternal care interventions improved in both areas (table 3). The largest difference observed in maternal care trends was of 8 percentage points for births delivered at a public health centre (13.4 percentage point increase in PIVOT catchment vs 5.4 in RoD) and for postnatal care within 48 hours with a skilled provider (10.5 percentage point increase in PIVOT catchment vs 2.4 in RoD), but these differences were not statistically significant. A more extensive list of intervention coverage results can be found in the online supplementary appendix S3 (table S3).
Changes in health system coverage in PIVOT initial catchment and the rest of Ifanadiana district (RoD) between 2014 and 2016
Coverage of all interventions in PIVOT catchment area increased both for the poorest and richest socioeconomic groups (figure 1 and online supplementary table S2), with the sole exception of antenatal care (4+ visits) which decreased for the poorest. The CCI increased from 55.0% to 71.9% for the richest, and from 37.55% to 48.7% for the poorest quantiles. Although the coverage gap between rich and poor slightly increased for CCI, coverage of most preventive and curative services improved by more than 10 percentage points for the poorest quantiles (figure 1A). The largest increases in this group were observed for vaccine coverage (from 21.15% to 38.45%), children receiving oral rehydration therapy for diarrhoea (from 23.1% to 42.8%) and care-seeking for fever (from 54% to 77.2%). Different wealth-specific rates of improvement for each indicator led to heterogeneous patterns of inequality for the 2014–2016 period (figure 1B). Both absolute and relative inequalities decreased in PIVOT catchment area for vaccination coverage, care-seeking for fever and household illnesses, antenatal care (1+ visit) and postnatal care. However, absolute and relative inequalities increased for care-seeking for children ARI, antenatal care (4+ visits to skilled provider) and births delivered by caesarean section (figure 1B).

Patterns of inequality 2014–2016 in the coverage of relevant maternal and child health indicators in PIVOT catchment area. (A) Equiplot of average coverage across wealth quantiles in 2014 and 2016. (B) Changes in slope index of inequality (SII) and relative concentration index (CIX) as measures of absolute and relative inequality, respectively. Detailed estimates for each indicator, including values for 2014, 2016 and trends, can be found in online supplementary table S2. ARI, acute respiratory infection. ORS, oral rehydration solutions.
Table 4 shows results from health centre data, which confirmed trends observed from survey data. Per capita utilisation rates in PIVOT-supported health centres increased from 0.26 per year in 2013 (year before the intervention started) to 0.76 in 2016 for outpatient care of all patients, and from 0.38 to 1.07 for children under-five. In the same period, utilisation rates changed little in the RoD, dropping from 0.27 to 0.23 for outpatient care of all patients and increasing from 0.52 to 0.59 for children under-five. This led to statistically significant differences in outpatient utilisation for all patients (0.19 per year, p<0.05). Maternal consultations increased in health centres located both inside and outside PIVOT catchment, including prenatal visits, deliveries and postnatal visits. The rate of four prenatal visits conducted by pregnant women increased from 0.2 to 0.4 of expected pregnancies in PIVOT-supported health centres and from 0.26 to 0.42 in the RoD. Delivery rates nearly tripled from 0.13 to 0.35 of expected deliveries in PIVOT-supported health centres and from 0.14 to 0.37 in the RoD. The rate of postnatal care visits increased from 0 to 0.66 of expected deliveries in PIVOT-supported health centres and from 0.09 to 0.47 in the RoD. No significant differences were found in the trends for maternal consultations between the two areas.
Discussion
Despite global progress in reducing mortality rates over the past 25 years, sub-Saharan Africa still has half of all under-five deaths worldwide and 66% of maternal deaths.1 2 Most of these deaths are preventable through an array of MNCH interventions such as vaccination, access to basic treatment for common child illnesses (ie, diarrhoea, malaria, pneumonia), the follow-up of pregnancies by skilled professionals and safe deliveries at health facilities.45–47 All of these programmes require strengthened health systems broadly corresponding to the WHO definition of ‘readiness’ at all levels of care. To accelerate progress achieved during the Millennium Development Goals (MDG) and achieve global convergence in mortality rates,3 the post-2015 agenda has accordingly put a new emphasis on the role of HSS as a way to ensure the provision of quality health services.48 49 In order to generate evidence for the feasibility of accomplishing the MDGs, there have been a number of initiatives to generate population impact indicators as a result of local HSS interventions.20 21 23 To date, the evidence suffers from either limited baseline data or a lack of comparison/control groups. The feasibility of generating rapid population-level impacts through external interventions has been doubted. Here we show the changes in healthcare coverage and mortality rates in the 2 years after an HSS intervention was implemented at all levels of a government health district in Madagascar. We found an annual reduction of 8.2% in population-averaged under-five mortality rates in the catchment area, a 21% reduced risk of incident mortality in children under-five as compared with the RoD and an annual relative increase of 12.9% in the CCI.
The trends observed for under-five mortality rates in the catchment population are much higher than those set for MDG 4, which aimed at an average annual rate of reduction of at least 4.4%. For the 75 countries tracked by the Countdown to 2015 initiative, the rate of reduction in the 1900–2015 period ranged from 0% to 6.5%.50 However, recent evidence showed that much faster reductions at a subnational level are possible, as shown in some of the best performing countries such as China or Rwanda.20 51 For instance, 11 Chinese counties achieved declines higher than 13.2% annually between 1996 and 2012,51 and two rural districts in Rwanda experienced declines of 12% per year between 2005 and 2010.20 These remarkable reductions have been explained by a combination of rapid national economic growth, strong government commitment to HSS and MNCH coverage through national policies, and differences in implementation at the local level.20 51 Importantly, faster progress in Rwanda was associated with an integrated HSS intervention similar to the one described here.20 Both Rwanda and China have been considered outliers—countries with singular political economic circumstances and high concentrations of power—such that the evidence is confounded with questions about the transferability of lessons for most low-income countries. In contrast, Madagascar continues to be one of the poorest countries in the world with relatively low economic growth, high perception of corruption52 and the lowest per capita spending on health.28 29 The rapid effects of the early stages of the district intervention provide a unique opportunity for direct comparison of HSS intervention in a treatment and comparison population under the conditions of relatively few confounders.
The success of integrated HSS interventions in improving coverage and reducing mortality rates in such short periods of time can be attributed to the progressive increase in access to all levels of care by the catchment population (community health, health centres, hospital), together with the provision of better quality care.30 32 51 Coverage of MNCH interventions is closely associated with under-five mortality rates,45–47 and improvements in MNCH coverage have resulted in corresponding mortality reductions at a country level.45 47 At the local level, community-based interventions have been an important focus of both pilot HSS interventions and scientific literature in recent years.11 18 By increasing MNCH coverage through CHWs or volunteers, these interventions have proved effective in reducing child mortality rates.11 However, coverage achieved through better access to clinical care rather than through outreach activities (eg, campaigns, CHWs) is the best predictor of mortality declines.47 Accordingly, a renewed attention to the importance of high-quality care has arisen as a necessary step to meet the Sustainable Development Goals.16 53 In 2 years, in addition to starting a community-based intervention, PIVOT removed out-of-pocket payments at all levels of the health system, improved facility infrastructure and equipment, trained health workers and implemented several clinical programmes to increase the quality of care (eg, IMCI, malnutrition). As a result, some of the largest increases in health coverage were observed at the healthcare facility level (online supplementary table S3), and the rates of utilisation in health centres tripled in 3 years for most types of care (table 4). This increase in utilisation of health centres likely contributed to the reductions in mortality we have seen. Despite the success of the intervention, further improvements are needed and should be expected over time. For instance, while utilisation went up to one consultation per child under-five per year and 34.7% of births delivered at health facilities at PIVOT catchment, this is still far from the three under-five consultations per year or delivery rates of around 90% observed in other settings such as Burkina Faso54 55 several years after user fees at health centres had been removed.
Changes in utilisation rates at all 13 major primary healthcare centres in Ifanadiana, 2013–2016
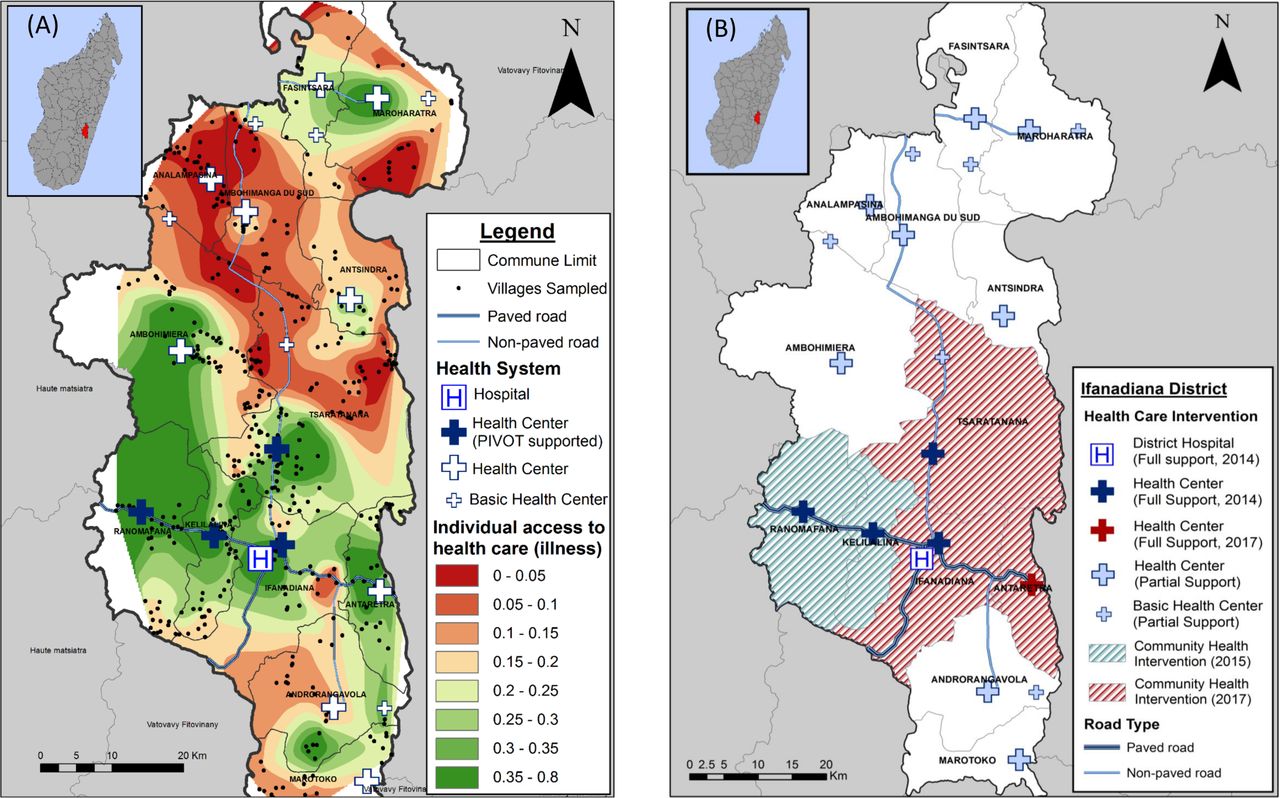
Improvements in coverage were observed for both the poorest and richest groups, leading to inequality reductions for most interventions. The CCI improved by 11 percentage points in 2 years for the poorest quantiles, slightly less than for the richest. These trends were five times higher than the average annual change of 0.92 estimated for the poorest groups in low-income countries between 1994 and 2014.56 However, while the coverage gap between rich and poor in low-income countries is reducing due to the higher rate of improvement among the poor,56 we observed a heterogeneous pattern in our intervention area. Relative inequalities were generally reduced, but some MNCH indicators such as care-seeking behaviours for ARI or antenatal care (4+ visits) experienced increases in both absolute and relative inequalities from 2014 to 2016 (figure 1). These could be attributable to geographic barriers of care such that the wealthier families live closer to the health facilities. Additional efforts in community health will be needed to close the inequality coverage gap in the intervention catchment, especially for the remote poorer communities, which had the lowest access to care in 2016 (figure 2A). To this end, the community intervention that was successfully implemented in two communes since the late 2015 will be expanded in 2017 to cover the full catchment population (figure 2B).
Spatial distribution of individual healthcare access and health system support in Ifanadiana. Left map (A) displays the mean proportion of individuals of all ages seeking care at a health centre when reported illness in the previous 4 weeks. Map was developed from 2016 survey data by performing natural neighbour interpolation based on the values of 80 spatial clusters, each of which includes 20 households and approximately 100 individuals. Right map (B) shows Ifanadiana’s health system, together with the level of support provided by PIVOT at each level since 2014. Both maps were created with ArcMap V.10.2.2.
Our study had several limitations. First, the intervention catchment was chosen for programmatic reasons and was not randomised across the district. Although most coverage indicators at baseline were similar between the two areas, some socioeconomic indicators were significantly better within the intervention catchment than for the RoD.31 However, controlling for wealth and proximity to the road did not have an impact in the trends observed in our study (online supplementary appendix S2 and table S1). Second, the original study catchment used for stratification in the study design did not correspond to the true catchment of the first 2 years of intervention, because one of the original catchment communes (~140 sampled households) did not receive the intervention. As a result, estimates for the true catchment area reported here have lower sample sizes and higher uncertainty than estimates for the RoD. Third, the 2016 survey took place 4 months later in the year than in 2014. This could affect rates of illness such as malaria, respiratory infections or acute malnutrition. Fourth, declines in population-level child mortality reported here were based on 5-year estimates to attain adequate sample sizes, and therefore estimates for 2016 included a 3-year period before the intervention was implemented. This may have resulted in an underestimation of the HSS population impact, especially for under-five mortality, which would explain the larger difference observed between the two areas for neonatal and infant mortality. In addition, the wide CIs in our mortality estimates, due to small sample sizes, prevented us from finding statistically significant results and drawing strong conclusions about the observed mortality declines. Finally, the process of implementing HSS is not discrete and immediate—it is gradually being implemented with the initial catchment area starting in 2014, with some programmes (eg, staffing) that benefit the entire district. These effects would serve to underestimate the impacts of HSS and limit our ability to disaggregate which elements of the intervention contributed the most to the observed changes.
As activities rapidly expand in PIVOT catchment area and towards other communes (figure 2B), we expect that coverage and health conditions will continue to improve. A third survey in the same 1600 sample households is taking place in 2018, the same year as a national health survey is expected to be carried out in Madagascar. This will allow for comparing rates of change with the RoD and with the rest of the country to put into context the impact of the HSS intervention. If trends continue, most coverage indicators may double in the intervention catchment in just 4 years, while child mortality rates could halve compared with 2014 baseline levels, thus rapidly catching up with the rest of the country.
Conclusion
In Global Health 2035, The Lancet Commission on Investing in Health concluded that convergence in child and maternal mortality rates could be achieved for most low-income countries at levels only seen for the best performing countries so far.3 Though the need for strong health systems to accelerate MNCH coverage and mortality reductions is clear,11 57 evidence supporting the population impact of integrating HSS interventions across all levels of care is scarce.4 Our 2-year evaluation of an integrated HSS intervention in Ifanadiana, a poor rural district in Madagascar, revealed a 30.1% relative increase in the CCI and a 19.9% reduction in under-five mortality rates. The decline observed for the HSS catchment population is close to some of the fastest rates of reduction reported at a subnational level20 51 and adds to preliminary evidence supporting the untapped potential of integrated HSS interventions on population health outcomes for substantially different types of populations.20 Unlike previous studies,20 51 this drop in mortality rates was observed in a period where rapid macroeconomic growth and local implementation of ambitious national health reforms in Ifanadiana were largely absent.
Acknowledgments
The authors gratefully acknowledge the contributions and support of Jim Herrnstein, Robin Herrnstein, Benjamin Andriamihaja, Amber Cripps, Pat Wright and Paul Farmer. They are grateful to all of the staff of PIVOT and the Ministry of Health for support of this study and to their commitment to the health of the population. The authors also thank the Institut National de la Statistique (INSTAT) field teams for their involvement in the district-wide population survey.
References
Footnotes
AG and ACM contributed equally.
Contributors AG, ACM, LFC, VRR, MR and HRR collected the data. AG, ACM, DRT and SA analysed the data. LFC, LH, DG, JH, AR, JR, MAO, MLR and MHB planned or implemented the interventions. AG wrote the initial draft. All authors revised and validated the final version of the manuscript.
Funding This study was funded by James McDonnell Foundation (Grant No 220020322), Fogarty International Center (Grant No K01TW008773) and Herrnstein Family Foundation.
Competing interests Some authors are current or former employees of institutions discussed in this article, including the non-governmental organisation PIVOT and the Government of Madagascar. These affiliations are explicitly listed in the article.
Patient consent Not required.
Ethics approval Harvard Medical School IRB and Madagascar National Ethics Committee.
Provenance and peer review Not commissioned; externally peer reviewed.
Data sharing statement Population data from the ongoing cohort study may be obtained upon request to study coordinators at andres.garchitorena@gmail.com and Ann_Miller@hms.harvard.edu. Health centre data may be obtained upon request to the Madagascar Ministry of Health.