Article Text

Abstract
Objective: To investigate the relation between income inequality and life expectancy in Italy and across wealthy nations.
Design and setting: Measure correlation between income inequality and life expectancy at birth within Italy and across the top 21 wealthy countries. Pearson correlation coefficients were calculated to study these relations. Multivariate linear regression was used to measure the association between income inequality and life expectancy at birth adjusting for per capita income, education, and/or per capita gross domestic product.
Data sources: Data on the Gini coefficient (income inequality), life expectancy at birth, per capita income, and educational attainment for Italy came from the surveys on Italian household on income and wealth 1995–2000 and the National Institute of Statistics information system. Data for industrialised nations were taken from the United Nations Development Program’s human development indicators database 2003.
Results: In Italy, income inequality (β = −0.433; p<0.001) and educational attainment (β = 0.306; p<0.001) were independently associated with life expectancy, but per capita income was not (β = 0.121; p>0.05). In cross national analyses, income inequality had a strong negative correlation with life expectancy at birth (r = −0.864; p<0.001).
Conclusions: In Italy, a country where health care and education are universally available, and with a strong social safety net, income inequality had an independent and more powerful effect on life expectancy at birth than did per capita income and educational attainment. Italy had a moderately high degree of income inequality and an average life expectancy compared with other wealthy countries. The cross national analyses showed that the relation between income inequality and population health has not disappeared.
Statistics from Altmetric.com
In the past three decades there has been great interest in examining the relation between income inequality and health. Income inequality has been found to be associated, in a cross national comparison, with a series of health indicators including infant mortality, and life expectancy at birth and at age 5.1 Such findings have been replicated using different indicators across both a wide range of countries2–9 and within countries.10–12
More recently, the evidence that income inequality is one of the major determinants of population health has been questioned. Some authors claimed the relation between income inequality and health vanished to a large extent when new studies with better data from different countries were available.13 Lynch and colleagues suggested that the relation between income inequality and life expectancy may have resulted from the small number of countries for which comparable data were initially available.4 A recent study from Canada did not find a significant association between income inequality and mortality concluding that the relation between income distribution and health is not universal, but instead dependent on social and political characteristics specific to place.14 However, a subsequent study from Canada showed that labour market inequality was related to working age mortality.15 Associations were not found between income inequality and different health outcomes such as all cause mortality and self rated health in Denmark,16 Japan,17 and New Zealand.18
As results on the relation between income distribution and health outcomes have been inconsistent, previous evidence has been dismissed as spurious. At least two major factors have been proposed to explain away the effect of income inequality on health: per capita income and educational attainment. Gravelle argued that the relation between income inequality and mortality is an artefact of the non-linear relation between income and mortality at the individual level.19 However, it is precisely the non-linear relation between micro-level income and life expectancy at birth that justifies the inclusion of income inequality in the study of mortality at the macro-level, for example, when making cross national comparisons.1 Later, Wolfson and colleagues20 using multilevel analyses provided substantial evidence for a non-artefactual explanation.21,22 Others still maintain that population health measured by life expectancy does not depend on how income is distributed, but individual level income instead.16,17,23
With regard to educational attainment, Muller using cross sectional data on income inequality and age adjusted mortality in the US concluded that the proportion of adults with high school diploma in a population accounts for the income inequality effect.24 These findings have been subsequently augmented with data from Brazil, which showed that the introduction of illiteracy into the analysis explained away the association between life expectancy and income inequality.25
In summary, many questions remain unanswered about whether and why there is an association between income inequality and health outcomes, which require further evidence from a variety of social, economic, and political contexts. If the relation between income inequality and health varies according to characteristics specific to place, it is of great interest to investigate such association in different nations. To date, we are not aware of studies that have undertaken this research in Italy, a country characterised by large regional differences in per capita income and income inequality, for example, the relative affluence of the north as compared with the south of Italy.26
In this research, we analysed the relation between the Gini coefficient and life expectancy at birth using aggregated data for all 20 Italian regions. We also examined whether or not this association is the result of variation in per capita income and educational attainment. Finally, we place the Italian data within an international context by studying the relation between income inequality and life expectancy at birth across top 21 industrialised countries.
METHODS
Italy
Data on life expectancy at birth for the year 2001, the study dependent variable, were extracted from the Italian National Institute of Statistics information system.27 The Gini coefficient was calculated using pooled data from the surveys on Italian household on income and wealth (SIHIW) conducted by the Bank of Italy in 1995 (n = 8135), 1998 (n = 7147), and 2000 (n = 8001). Pooling of the three surveys was performed to assure a sample of at least 1000 subjects for 11 regions and at least 500 subjects for the remaining nine regions.28 Face to face interviews of household members were conducted. The sampling strategy consisted in two stages: firstly, a random sample of 300 municipalities (stratified by region and county size) was selected; secondly, a random sample of Italian households was drawn within each municipality. Post-stratification adjustment or raking was used to assure that regional samples were similar to the general population in terms of sex, age, occupation, educational attainment, and municipality size. A more detailed description of the sampling methodology is discussed elsewhere.26
Covariates for the within Italy analysis included per capita income and educational attainment for each Italian region. Data on per capita income for each Italian region came from the SIHIW conducted in 2000.28 Using data from the National Institute of Statistics, we measured educational attainment as the proportion of persons 19 years old in each Italian region that obtained a high school diploma as of 1997.29 Data on population size, life expectancy at birth, educational attainment, per capita income, and Gini coefficients across Italian regions are shown in table A (see appendix, available on line http://www.jech.com/supplemental).
Cross national
Data on life expectancy at birth for the year 2001, Gini coefficient (data were available for different years—that is, from 1990 to 1998), and per capita gross domestic product (GDP) for Italy and the other 20 industrialised countries included in this study were taken from the United Nations Development Program’s human development indicators published in 2003.30 Countries selected for the analysis were the top 25 nations in terms of per capita GDP—Australia, Belgium, Canada, Denmark, Finland, France, Germany, Greece, Italy, Japan, Luxembourg, Netherlands, New Zealand, Norway, Portugal, Singapore, Spain, Sweden, Switzerland, UK, and USA—excluding Austria, Ireland, Israel, and Slovenia. Austria was excluded because income inequality data were not available. Ireland, Israel, and Slovenia were excluded because of their social instability and conflicts. Data on the Gini coefficient were calculated using per capita income as a living standard indicator and came from nationally representative household surveys using similar methodologies. The Gini coefficient was adjusted for household size, providing a more consistent measure of per capita income.31 Data on population size, life expectancy at birth, per capita GDP, and Gini coefficients across top industrialised nations are shown in table B (see appendix).
Statistical analyses
For analyses within Italy, Pearson correlation coefficients were calculated to measure the association between life expectancy at birth and income inequality, per capita income, and educational attainment. Multivariate linear regression was used to study the relation between income inequality and life expectancy when adjusting for per capita income and educational attainment. Problems of collinearity could have arisen because of the high correlation between income inequality and per capita income (r = −0.851; p<0.001). As an indicator of collinearity, we used variance inflation factor (VIF) values greater than or equal to 10,32 however in none of the multivariate regression models did the VIF exceed this threshold.
For analyses between countries, Pearson correlation coefficients adjusted for GDP per capita were calculated to measure the association between life expectancy at birth and income inequality.
All analyses were weighted by population size.
RESULTS
Figure 1A shows the relation between the Gini coefficient and life expectancy at birth across Italian regions. Income inequality had a strong negative correlation with life expectancy (r = −0.785; p<0.001). Regions whose income inequality was higher, such as Campania and Sicily, had a significantly lower life expectancy than regions where income inequality was comparatively low, for example, Marches and Umbria.
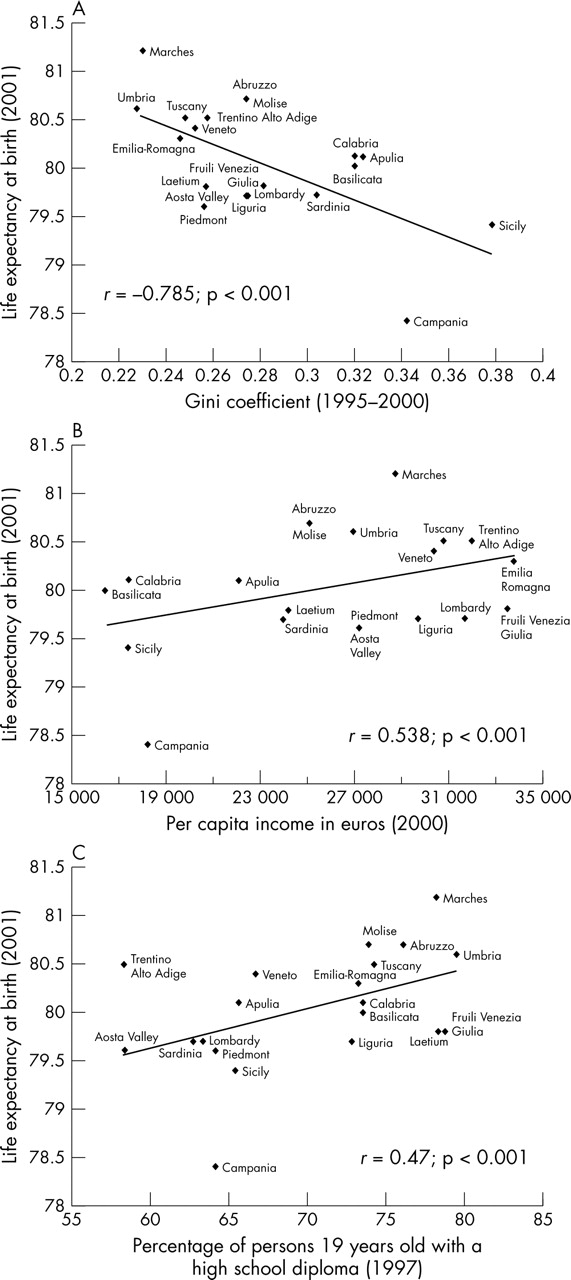
(A) Income inequality and life expectancy at birth among Italian regions (n = 20). Data are weighted by population size and adjusted for gross domestic product per capita. r (crude) = 0.607; p<0.005. r (adjusted for per capita income) = −0.934; p<0.011. r (weighted by population size) = 0.658; p<0.001. (B) Economic development and life expectancy at birth among Italian regions (n = 20). Data are weighted by population size. (C) Association between educational attainment and life expectancy at birth among Italian regions (n = 20). Data are weighted by population size.
There were large variations among Italian regions in terms of per capita income (fig 1B), which ranged from €16 492 for Basilicata to €33 774 for Emilia-Romagna.28 Per capita income was positively correlated with life expectancy at birth (r = 0.538, p<0.001). Regions with low per capita income such as Sicily and Campania had significantly lower life expectancy at birth compared with regions whose per capita income was high such as Emilia-Romagna, Trentino Alto Adige, and Tuscany.
Educational attainment was also positively correlated with life expectancy at birth (r = 0.476; p<0.001; fig 1C). Regions with a higher proportion of persons 19 years old having a high school diploma performed better in terms of life expectancy compared with regions where a lower proportion of young adults of the same age has a high school diploma.
Table 1 shows the results from multivariate linear regressions. The Gini coefficient by itself explained 43.3% of the variation in life expectancy at birth (model 1). When per capita income was introduced into the regression (model 4), the strength of the association between the Gini coefficient and life expectancy increased. The fit of the regression model improved, as shown by the increase in the adjusted r2 from 43.3% (model 1) to 50.0% (model 5), when educational attainment was added to model with the Gini coefficient. Per capita income and educational attainment together explained 46.9% of the variance on life expectancy (model 6). When all three explanatory factors were included into the multiple regression analysis, the β coefficient for per capita income was not significant while the coefficient for income inequality remained strongly associated with life expectancy (β = −0.443; p<0.001; model 7). Moreover, the adjusted r2 increased only slightly.
Linear regression on life expectancy at birth across Italian regions (n = 20)
Figure 2 is a scatterplot of data on the Gini coefficient and life expectancy at birth across the top 21 industrialised countries, including Italy.30 Income inequality was strongly negatively correlated with life expectancy at birth (r = −0.864; p<0.001). Among wealthy countries, Italy has a moderately high degree of income inequality (Gini = 0.36) and an average life expectancy at birth (78.6 years).

Income inequality and life expectancy at birth among industrialised countries (n = 21). Data are from the human development indicators 2003. The correlation presented in the figure is weighted by population size and adjusted for per capita gross domestic product (GDP). r (crude) = 0.415; p<0.65. r (adjusted for per capita GDP = −0.433; p<0.065. r (weighted by population size) = −0.907; p<0.001.
DISCUSSION
This study has a number of important findings. The first set of findings pertains to the Italian context. In Italy, income inequality was associated with life expectancy at birth even when per capita income and education (that is, high school completion rate of persons 19 years old) were held constant. Per capita income did not explain the relation, but education did to a small extent. There was an independent effect of education, but not of per capita income, on life expectancy at birth. The second set of findings situates the data from Italy in an international context. It is a country with a moderately high degree of income inequality and an average life expectancy compared with other wealthy nations. Among these nations, income inequality was negatively associated with life expectancy at birth, which is consistent with earlier reports.1,3,6
Amid recent data supporting the contrary,14,16–18 our findings support the relative income hypothesis, which states that for regions with GNP per capita beyond US$ 8000–10 000, health status is mainly affected by the spread of income.3 Conversely, the absolute income hypothesis asserting that health is primarily influenced by economic development, even in a comparatively rich nation, is not supported by the data on Italy. Income inequality explained most of the variation in life expectancy, and the effect of per capita income on life expectancy disappeared when controlling for income inequality. Regions such as Marches, Umbria, and Tuscany that are more equitable in terms of income distribution and enjoyed a higher life expectancy. On the other hand, highly inequitable regions such as Sicily and Campania performed quite poorly in terms of life expectancy.
Key points
-
Among Italian regions, income inequality has an independent and more powerful effect on life expectancy than per capita income and education. Per capita income does not account for the effect of income inequality on life expectancy while education plays a partial, but limited part in explaining the relation.
-
Italy has a moderately high degree of income inequality and an average life expectancy compared with other wealthy countries.
-
Data from the top 21 industrialised nations including Italy show that there is a strong negative relation between income inequality and life expectancy at birth.
Two major pathways of causation have been proposed for the effect income inequality exerts on health status: the material deprivation pathway and the psychosocial pathway.3,33 The material deprivation pathway states that income inequality is related to health through a combination of negative exposures and lack of resources held by individuals, along with systematic underinvestment across a wide range of human, physical, health, and social infrastructures (for example, education, health services, transportation, environmental controls, availability of good quality food, quality of housing, and occupational health regulations).33 The psychosocial pathway argues that income inequality affects health through individual perceptions of place in the social hierarchy producing negative emotions such as stress, shame, and distrust that are translated “inside” the body into poorer health via psycho-neuro-endocrine-immunological mechanisms and stress induced behaviours such as smoking and overeating. Simultaneously, perceptions of relative position and negative emotions are also translated “outside” the individual into antisocial behaviours such as homicides, traffic accidents, and reduced civic participation, which result in less social capital and social cohesion within the community.3
This study shows that income inequality is strongly associated with health in a country where health care and education are publicly funded with practically free access to all citizens, and unemployed people receive social benefits. Results, showing that education played a significant part in explaining the relation between income inequality and life expectancy, are partially consistent with the material deprivation hypothesis. Income inequality may be partially associated with poorer infrastructures and lack of resources among the most disadvantaged populations, especially in southern Italy. However, we did not find an independent effect of per capita income, yet an independent effect of income inequality predominates. In contrast with previous studies,24,25 the effect of education was small and did not account for the relation between income inequality and health. This may suggest that income inequality may exert an influence through psychosocial mechanisms such as social stress, for example from the unequal distribution of power among citizens, lack of political participation, and social cohesion. However, this study was not equipped to investigate this. Rather than considering the two major pathways of causation (material deprivation and psychosocial stress) as mutually exclusive, our study suggests that a combination of the two pathways are at work.34
Policy implications
-
In the Italian context, improving population health may not only require policies that promote economic development, but also those that reduce income inequality and increase educational attainment.
-
To promote population health, governments of wealthy nations are advised to minimise income inequality.
The results from analyses between wealthy countries corroborate previous evidence showing a significant correlation between income inequality and life expectancy.1,6 Countries having lower levels of income inequality such as Japan and Sweden enjoy a better health compared with countries with high levels of income inequality such as the USA and Portugal. These results, however, are in contrast with the evidence presented by Lynch and colleagues who concluded that the higher income inequality was not associated with lower life expectancies.4 They suggested that the relation had disappeared because of the higher number of countries in their study, in comparison with the analysis presented by Wilkinson in 1992.3
Our findings indicate that with updated data and the inclusion of five additional top industrialised countries in the analysis the relation reappears. Inclusion of Greece, Japan, New Zealand, Portugal, and Singapore, which were excluded in the analysis conducted by Lynch and colleagues because of unavailability of data,4 may explain, at least partially, the difference in results. However, a sensitivity test showed that, when these countries were excluded from the analysis, there was a moderate correlation between income inequality and life expectancy (data not shown).
Discrepancies may also be attributable to the delayed effects of changes in income distribution on mortality rates.35 During the late 1980s and 1990s some countries (for example, United Kingdom and Finland) experienced changes in income distribution. The true effect on life expectancy of these changes may have been difficult to detect (especially in the oldest age groups) in 1990–93, the years when the life expectancy data used by Lynch and colleagues were collected.4
This study has several limitations. As shown in other research, the level of geographical aggregation influences the association between income inequality and health. At higher levels of aggregation it is easier to find independent effects of income inequality on health outcomes.22 We do not know whether or not the use of the Gini coefficient at lower geographical levels such as provinces or municipalities would have produced different results. However, the level of aggregation needs not to be too small to allow income distribution to exert an effect independent of individual income.36 Further studies from Italy using measures of income distribution at lower levels of aggregation would be useful to clarify this point. Another limitation is that the cross sectional data used precludes investigating how changes in income inequality over time influence population health. It is true that inequalities can take time to show their effects, but northern Italy has been more equitable than southern Italy at least since the creation of the unified state—that is, as far as income inequalities are concerned the situation has not substantially changed when we compare different regions. This analysis may also incur “ecological fallacies” when interpreting aggregated data to make conclusions about individuals.37 Multilevel analyses using individual level data on income and aggregated data on income inequality within Italy may contribute in the confirmation or rejection of study findings. However, as income inequality is inherently a social concept, it may not be plausible, both from a theoretical and methodological viewpoint, to evaluate its effects at the individual level. Finally, our cross national results must be interpreted with caution because of the difference between the reference dates of the Gini coefficients. While most of the Gini coefficients were collected between 1994 and 1998, data for Switzerland, Japan, and Spain were from 1990 and 1993. Moreover, comparability problems remain in the use of data from household surveys across countries, even though these problems are diminishing as survey methodologies are improving and becoming more standardised.31
Despite the limitations, our research suggests that the relation between income inequality and population health among wealthy nations has not disappeared as claimed by some authors.4,13 Furthermore, using data from Italy, a country with a moderately high degree of income inequality among the industrialised nations, we show that, in contrast with studies from other countries,23–25 income inequality had an independent and more powerful effect on life expectancy at birth than per capita income and educational attainment. More research is needed to analyse the material and psychosocial mechanisms between income inequality and health in wealthy nations including Italy. However, despite which pathway of causation predominates, income inequality remains a key determinant of population health. Consequently, public policy and public health initiatives to reduce or contain such inequalities are essential to reach public health objectives at the population level.
Acknowledgments
We greatly appreciate the invaluable review and comments provided by Richard Wilkinson and George Davey Smith in the preparation of this manuscript.
CONTRIBUTORS RD performed most of the analyses and wrote most of the paper. RM participated in the writing of the paper, reviewed its contents, and conducted some statistical analyses. RG inspired the development of research hypotheses, reviewed the paper, and participated in the interpretation of results. GAC participated in the design of the manuscript and inspired the framing of the paper.
REFERENCES
Supplementary materials
Web-only Tables
The tables are available as downloadable PDFs (printer friendly files).
If you do not have Adobe Reader installed on your computer,
you can download this free-of-charge, please Click hereFiles in this Data Supplement:
- [View PDF] - Table A Population size, life expectancy at birth, educational attainment, per capita income, and Gini coefficients across Italian regions (n=20)
- [View PDF] - Table B Population size, life expectancy at birth, per capita income, and Gini coefficients across top industrialized nations (n=21)
Updated Figures
The authors of this articles have provided updated versions of figures 1 and 2.
The figures are available as a downloadable PDF (printer friendly file).
If you do not have Adobe Reader installed on your computer,
you can download this free-of-charge, please Click hereFiles in this Data Supplement:
- [View PDF] -
Figure 1a Income inequality and life expectancy at birth among Italian regions (n = 20).
Data are weighted by population size and adjusted for gross domestic product per capita
[r(crude) = -0.607, p < 0.005; r(adjusted for per capita income) = -0.934, p = 0.011;
r(weighted by population size) = -0.658, p = 0.001].
Figure 1b Economic development and life expectancy at birth among Italian regions (n = 20). Data are weighted by population size.
Figure 1c Association between educational attainment and life expectancy at birth among Italian regions (n = 20). Data are weighted by population size.
Figure 2 Income inequality and life expectancy at birth among industrialised countries (n = 21). Data are from the United Nations Development Program�s human development indicators published in 2003.30 The correlation presented in the figure is weighted by population size and adjusted for per capita gross domestic product (GDP) [r(crude) = -0.415; p = 0.65; r(adjusted for per capita GDP) = -0.433, p = 0.065; r(weighted by population size) = -0.907, p <_0.001. p="p">
- [View PDF] -
Figure 1a Income inequality and life expectancy at birth among Italian regions (n = 20).
Data are weighted by population size and adjusted for gross domestic product per capita
[r(crude) = -0.607, p < 0.005; r(adjusted for per capita income) = -0.934, p = 0.011;
r(weighted by population size) = -0.658, p = 0.001].
Footnotes
-
Funding: the work of RD and GAC was supported in part by the John D and Catherine T MacArthur Foundation Research Network Project on Socioeconomic Status and Health.
-
Competing interests: none declared.