Article Text

Abstract
Aim To report refractive error prevalence and visual impairment in Republic of Ireland (henceforth 'Ireland') schoolchildren.
Methods The Ireland Eye Study examined 1626 participants (881 boys, 745 girls) in two age groups, 6–7 years (728) and 12–13 years (898), in Ireland between June 2016 and January 2018. Participating schools were selected by stratified random sampling, representing a mix of school type (primary/postprimary), location (urban/rural) and socioeconomic status (disadvantaged/advantaged). Examination included monocular logarithm of the minimum angle of resolution (logMAR) presenting visual acuity (with spectacles if worn) and cycloplegic autorefraction (1% Cyclopentolate Hydrochloride). Parents completed a questionnaire to ascertain participants’ lifestyle.
Results The prevalence of myopia (spherical equivalent refraction (SER): ≤−0.50 D), hyperopia (SER: ≥+2.00 D) and astigmatism (≤−1.00 DC) among participants aged 6–7 years old was 3.3%, 25% and 19.2%, respectively, and among participants aged 12–13 years old was 19.9%, 8.9% and 15.9%, respectively. Astigmatic axes were predominately with-the-rule. The prevalence of ‘better eye’ presenting visual impairment (≥0.3 logMAR, with spectacles, if worn) was 3.7% among younger and 3.4% among older participants. Participants in minority groups (Traveller and non-white) were significantly more likely to present with presenting visual impairment in the ‘better eye’.
Conclusions The Ireland Eye Study is the first population-based study to report on refractive error prevalence and visual impairment in Ireland. Myopia prevalence is similar to comparable studies of white European children, but the levels of presenting visual impairment are markedly higher than those reported for children living in Northern Ireland, suggesting barriers exist in accessing eye care.
- refractive error
- visual impairment
- myopia
- hyperopia
- schoolchildren
- prevalence
- Ireland
This is an open access article distributed in accordance with the Creative Commons Attribution Non Commercial (CC BY-NC 4.0) license, which permits others to distribute, remix, adapt, build upon this work non-commercially, and license their derivative works on different terms, provided the original work is properly cited, appropriate credit is given, any changes made indicated, and the use is non-commercial. See: http://creativecommons.org/licenses/by-nc/4.0/.
Statistics from Altmetric.com
Introduction
The WHO and the International Agency for the Prevention of Blindness have identified refractive error as the second leading cause of blindness (after cataracts), and addressing this is a WHO Vision 2020 priority.1 2 Presenting visual acuity is accepted as providing a better index of visual disability in a community, as opposed to best corrected visual acuity, as it includes those with uncorrected refractive error.2
Uncorrected refractive errors (myopia, hyperopia and astigmatism) result in reduced educational opportunities and employment options, impacting the individual and the community.3 The global burden and economic cost to society in lost productivity due to uncorrected refractive error are conservatively estimated at $269 billion per year.4 5 Therefore the public health issue of uncorrected refractive error impacts on children’s education; uncorrected hyperopia and astigmatism are associated with poorer educational attainment.6 7
Research suggests a wide global variation and a dramatic increase in the prevalence of myopia from the late 20th century onwards.8 This is particularly evident in East Asia, where myopia is a growing health issue with a prevalence of 80%–90% in school leavers.9 Myopia prevalence is clearly influenced by ethnicity, but environment has also been demonstrated to play a significant role in the onset and progression of the condition.10 For example, myopia prevalence among Chinese children living in Singapore is significantly higher than among Chinese children in Australia, and lower in white children living in Australia than white children in the UK.11 12 Rapid increases in myopia prevalence across diverse geographical locations reflect the environmental role in child myopia susceptibility,13 14 and is particularly evident among children in areas where lifestyle and living conditions have been impacted by significant economic growth.15
The Ireland Eye Study (IES) is the first study to examine the prevalence of refractive error in school-aged children in Ireland. This report describes the prevalence of refractive error and visual impairment in children aged 6–7 years and 12–13 years. These data provide the first opportunity to compare children’s refractive and visual status in Ireland with that from other areas of the world.
Methods
Sampling protocol
Stratified random cluster sampling was employed in selecting schools for participation. Schools were stratified by socioeconomically disadvantaged/advantaged status, urban/rural status and by primary (pupils aged 4–12 years)/postprimary (pupils aged 12–18 years) status. Areas were categorised as ‘rural’ if the population density was less than ten persons per hectare (10 000 square metres), in line with previous studies.16 The Irish state supports schools categorised as Delivering Equality of opportunity In School (DEIS). The IES categorised socioeconomic status by DEIS status: DEIS schools were defined as socioeconomically disadvantaged, other schools were defined as advantaged.17
Within each stratum, schools were randomly selected from a complete list (sampling frame) of schools provided by the Irish Department of Education and Skills. A sample size of 1500 (700 children aged 6–7 years old and 800 children aged 12–13 years old) was calculated using G*Power analysis based on the predicted prevalence of myopia of 3%–5% for children aged 6–7 years old, with a 1% SE, and 10% for children aged 12–13 years old with a 1.5% SE, and an assumed participation rate of 75%.18
Ethnicity
Ethnicity of participants was assessed by the study coordinator and confirmed by the parent/guardian through self-report. Participants were categorised as either white, Traveller or non-white (black, Asian and Arab subjects combined). Although the Traveller community originally descended from the white Irish population, they diverged from the settled population approximately 360 years ago. High levels of autozygosity within the Traveller community have implications for disease mapping within Ireland.19 According to the 2016 Irish census, 9.9% of children aged between 5 and 14 years were non-white.
Recruitment
Selected schools were contacted and, with agreement from school principals, an information pack was distributed to parents/guardians of children aged 6–7 years in primary and 12–13 years in postprimary schools. Each pack contained a letter of invitation outlining the study, an information sheet explaining the testing procedures, the study questionnaire and a consent form. Children for whom informed consent and child assent were received were tested on school premises within school hours.
Testing included the following procedures:
Assessment of monocular distance visions (with spectacles if worn) using the Good-Lite (Elgin, Illinois) Sloan letters logarithm of the minimum angle of resolution (logMAR) chart at 3 m. Visual acuity was recorded using the by-letter scoring system and recorded in logMAR notation. A light metre was employed to ensure the test luminance did not fall below 120 cd/m2.
Cycloplegic autorefraction (Dong Yang Rekto ORK-11 Auto Ref-Keratometer, Everview, Seoul, Korea) was used to determine refractive error.20 21 Cycloplegia was achieved, postinstillation of one drop of topical anaesthetic (Minims Proxymetacaine hydrochloride 0.5% w/v, Bausch & Lomb, UK), using one drop of Cyclopentolate Hydrochloride (Minims, 1% w/v, Bausch & Lomb). Non-white children were administered two drops of Cyclopentolate Hydrochloride 5 min apart. Once it was established cycloplegia had been achieved (pupillary reactions non-responsive to light and accommodation amplitude less than 2 D on push-up test), at least 20 min after instillation of the eye-drops, autorefraction was carried out. The representative value for spherical equivalent refraction (SER)—sphere plus half the cylindrical value—was used in subsequent analysis.
The IES questionnaire was based on questionnaires used in other international studies and with input from epidemiology, dietetics and focus group user testing.18 22 Parents completed a participant and parental history and a children’s lifestyle questionnaire.
Definitions
To facilitate comparison with previous studies,18 22 23 the Refractive Error Study in Children (RESC) protocol was used to define myopia and hyperopia. The SER of the right eye was used to classify subjects as myopic (≤−0.50 dioptre sphere (DS) SER), hyperopic (≥+2.00 DS) or emmetropic (>−0.50 DS and <+2.00 DS).
Astigmatism was defined using negative cylinders as 1.00 dioptre cylinder (DC) or greater. With-the-rule (WTR) astigmatism was defined as cylinder axes from 1°−15° and from 165°−180°, against-the-rule astigmatism as axes 75°−105°, and oblique (OBL) astigmatism as axes 16°−74° and 106°−164°.18 22 23
Visual impairment was defined as ≥0.3 logMAR (6/12 Snellen), in line with the RESC protocol.23 Presenting visual impairment (PVI) was defined by acuity measures ≥0.3 logMAR, with spectacles, if worn. PVI was reported for the ‘better eye’ and for ‘either eye’.
Statistical methodology
The Statistical Package for Social Sciences V.21.0 was used for most analyses. Anonymised study data were entered directly into the SPSS database. Statistical programming language R was used to generate random numbers for the sampling procedure and to calculate prevalence data CIs.
There was no significant difference in SER prevalence, astigmatism prevalence and cylindrical axis of orientation prevalence between the right and left eyes in either age cohort (Pearson’s χ2, all p<0.001). Right and left eye data were strongly correlated for SER (Spearman’s rho coefficient, r=0.878, p<0.001), astigmatism (Spearman’s rho coefficient, r=0.383, p<0.001) and presenting vision (Spearman’s rho coefficient, r=0.795, p<0.001). Hence, right eye data only are presented.
The risk factors for SER prevalence were identified using multinomial logistic regression, controlling for age group, with emmetropic (absence of significant refractive error, SER <+2.00 DS to >−0.50 DS) participants as the reference group. When evaluating the risk factors for astigmatism, the reference group was participants with astigmatic errors >−1.00 DC. The risk factors for PVI were examined using those without PVI as the reference group. P values ≤0.05 were regarded as significant. Throughout, 95% CIs have been used.
Results
Fifty-four per cent of the schools on the initial list agreed to participate in this study; additional schools were recruited from the reserve list. School participation rates did not vary significantly with socioeconomic status, urban/rural status or location. A total of 37 schools participated (23 primary schools, 14 postprimary schools), and data collection occurred between June 2016 and January 2018.
Within-school participation rates ranged from 64% to 100%, with an 83.3% average participation rate. Of those invited to participate, parental consent was obtained from 733 participants aged 6–7 years old (51.8% male; mean age 6.7 years, SD 0.49) and 901 participants aged 12–13 years old (56.1% male; mean age 12.8 years, SD 0.48). All participants successfully completed monocular visual acuity assessment, and 99.3% of participants aged 6–7 years old and 99.7% aged 12–13 years old underwent cycloplegic autorefraction and provided measures for both eyes. The results from eight children who declined eye-drops were excluded.
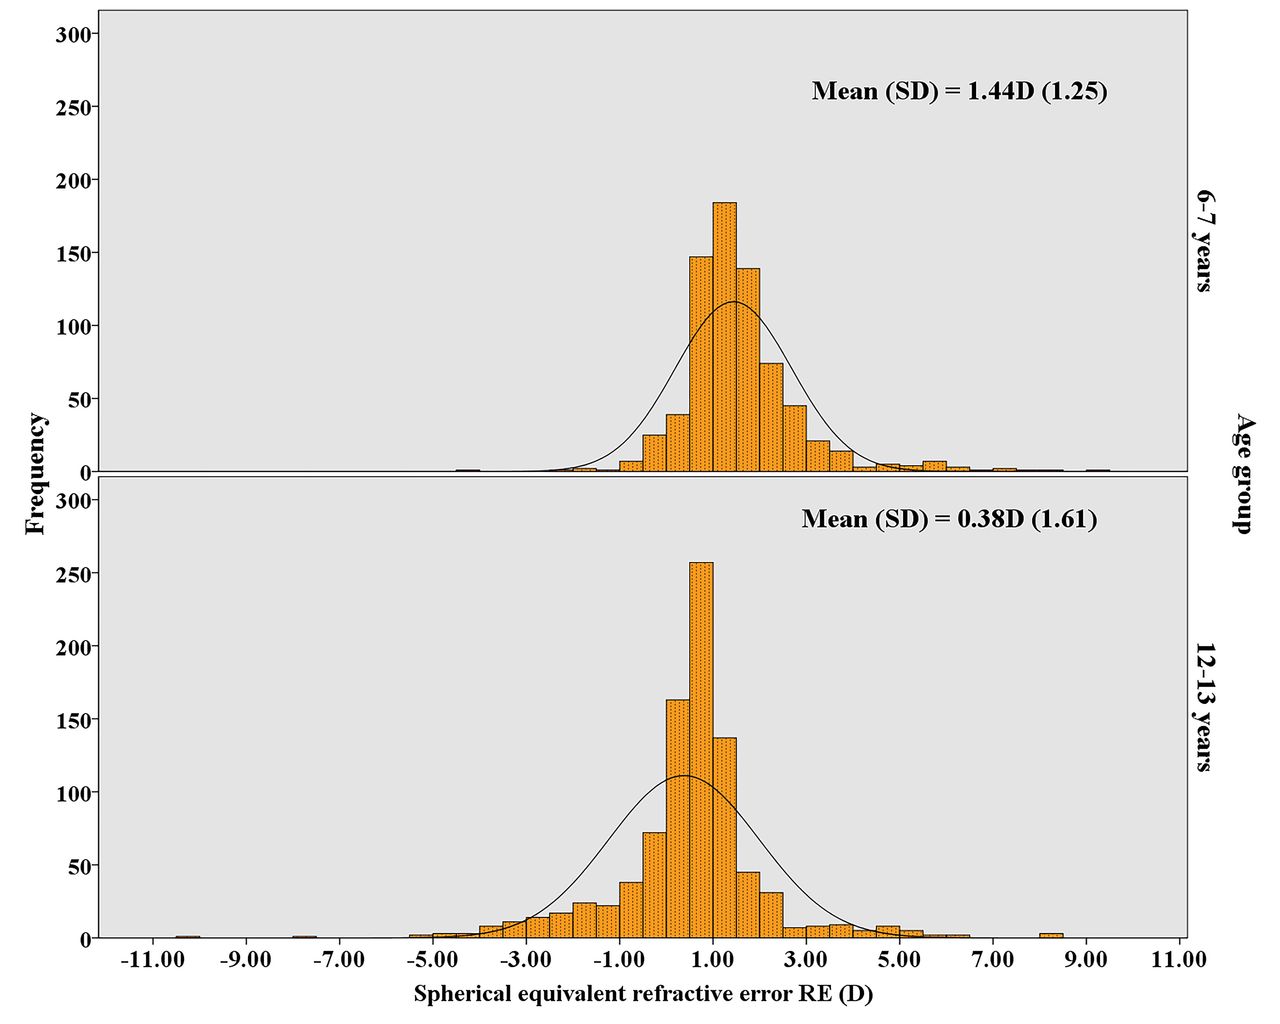
Figure 1 illustrates the non-normal distribution of SER in 2 D intervals for both age groups (p<0.001, Kolmogorov-Smirnoff test). The distributions show peaks around the mean. SER was positively skewed in participants aged 6–7 years old (skew=1.61) and negatively skewed in participants aged 12–13 years old (skew=−0.29). In the older age group, the distribution of SER shifts towards less positive values (6–7 years mean=1.44 D; 12–13 years mean=0.38 D). There was a large variation in SER in both age groups as evidenced by the relatively large SD (figure 1). The difference in mean SER between the two age groups was statistically significant (p<0.001, Mann-Whitney test).
Distribution of spherical equivalent refractive error (D) in children aged 6–7 years old (top image) and those aged 12–13 years old (bottom image) in the Ireland Eye Study.
Table 1 presents the prevalence of myopia, hyperopia, astigmatism, astigmatic axis and PVI plus CIs by age.
Prevalence of refractive error, astigmatic axis, and presenting visual impairment in participants aged 6–7 years and 12–13 years in the Ireland Eye Study
Myopia prevalence was significantly greater, and hyperopia prevalence significantly lower, in the older participant group compared with the younger group (p<0.001), but no significant difference in astigmatism prevalence between age groups was found. The predominant type of astigmatism was WTR in both groups.
There was no significant difference in PVI prevalence (‘better eye’ or ‘either eye’) between the younger and older participants. Myopia (83.3%, p<0.001) and hyperopia (10.0%, p=0.025) were significantly associated with PVI in the ‘better eye’ among older children. Astigmatism (70.4%, p<0.001) and myopia (18.5%, p<0.001) were significantly associated with PVI in the ‘better eye’ among the younger age cohort.
Astigmatism (61.3%, p<0.001), myopia (60.3%, p<0.001) and hyperopia (25.3%, p<0.001) were significantly associated with PVI in ‘either eye’ in the older age group. Astigmatism (63.6%, p<0.001) and hyperopia (53.0%, p=0.013) were significantly associated with PVI in ‘either eye’ in participants aged 6–7 years old.
Refractive data and demographic profile
In addition to age, the principal demographic study variables in the IES were urban/rural status, gender, ethnicity and socioeconomic status (table 2).
Ireland Eye Study principal demographic study variables
Multinomial logistic regression examining the relationship between SER and the study demographic variables jointly showed that myopia and hyperopia were significantly related to age group (p<0.001) and ethnicity (see below) (p<0.001) but not to gender, urban/rural status or socioeconomic status.
The presence of astigmatism was significantly associated with socioeconomic disadvantage (p=0.02) and ethnicity (see below) (p=0.028), but not gender, urban/rural status or age.
PVI in the ‘better eye’ was associated with urban living (p=0.006), socioeconomic disadvantage (p=0.015) and ethnicity (see below) (p=0.007), but not gender or age. PVI in ‘either eye’ was associated with urban living (p=0.017) and socioeconomic disadvantage (p=0.049), but not ethnicity, gender or age.
Relationship of refractive error to ethnicity
Table 3 presents the prevalence of myopia, hyperopia and astigmatism, plus PVI prevalence, by ethnic group.
Prevalence of myopia, hyperopia, astigmatism and presenting visual impairment by ethnic grouping
The prevalence of both myopia and hyperopia was significantly related to ethnicity (p<0.001), with significantly higher prevalence of myopia and lower prevalence of hyperopia in the non-white group (table 3). Astigmatism prevalence was significantly higher in non-white participants (p=0.007). The prevalence of PVI in the ‘better eye’ was significantly higher in Traveller and non-white participants (p=0.007).
Relationship between astigmatism and ametropia
Astigmatism was significantly associated with hyperopia and myopia (p<0.001). Among participants aged 6–7 years old, 46.7% of those with astigmatism were hyperopic and 5.5% were myopic; conversely among participants aged 12–13 years old, 20.5% of those with astigmatism were hyperopic and 37.3% were myopic.
Profile of spectacle wear in IES participants
Table 4 presents the profile of spectacle wear in IES participants.
Profile of spectacle wear in Ireland Eye Study participants aged 6–7 years old and 12–13 years old
Wearing and not wearing spectacles
The proportion of participants who presented wearing spectacles was 8.8% of participants aged 6–7 years old and 13.8% of those aged 12–13 years old; however, of those who reported that they had a current spectacle correction, a proportion did not have their spectacles at school (3.9% of participants aged 6–7 years old and 10.7% of those aged 12–13 years old). The refractive profile of participants who did not have their spectacles at school was mainly hyperopic (53.6%) in the younger cohort and astigmatic (44.8%) or hyperopic (32.3%) in the older age cohort (table 4).
Not having spectacles
The prevalence of PVI in the ‘better eye’ or PVI in ‘either eye’ among participants who reported no history of spectacle wear was 3.2% and 7.2%, respectively, in the younger age group, and 2.1% and 4.4%, respectively, in the older age group.
PVI in the ‘better eye’
Of the 25 participants aged 6–7 years with PVI in the ‘better eye’, 20 reported no history of spectacle wear, 4 needed an updated spectacle prescription and 1 participant did not have their spectacles at school. Of the 30 participants aged 12–13 years with PVI in the ‘better eye’, 14 reported no history of spectacle wear, 1 participant needed a spectacle update and 15 participants did not have their spectacles at school.
PVI in ‘either eye’
Of the 64 participants aged 6–7 years with PVI in ‘either eye’, 45 reported no history of spectacle wear, 13 required an updated spectacle prescription and 6 did not have their spectacles at school. Of the 75 participants aged 12–13 years with PVI in ‘either eye’, 30 reported no history of spectacle wear, 10 required an updated spectacle prescription and 35 did not have their spectacles at school.
Of the 22 participants aged 6–7 years without PVI who reported spectacle wear, but did not have their spectacles at school, 14 were hyperopic and 8 were astigmatic. Of the 61 participants aged 12–13 years without PVI who did not have their spectacles in school, 30 were hyperopic, 21 astigmatic, 9 myopic and 1 participant did not have a refractive error as defined by the IES.
A history of spectacle wear was significantly associated with white ethnicity (p=0.038), older age group (p<0.001) and urban living conditions (p<0.001), but not gender or socioeconomic status. Attending school without their prescribed spectacles was associated with socioeconomic disadvantage (p=0.008), older age group (p<0.001) and white ethnicity (p=0.016).
Table 5 presents the mean logMAR presenting visual acuity for all participants and by gender and ethnicity. It also records the relationship between refractive error and presenting visual acuity. Traveller and non-white participants aged 6–7 years old had significantly poorer presenting acuity compared with white participants aged 6–7 years old (p=0.006). Participants with refractive error had significantly poorer presenting visual acuity compared with emmetropic participants (p<0.001 logistic regression).
Ireland Eye Study presenting visual acuity in the right eye
Discussion
Using similar protocols and methodology, the myopia prevalence in Ireland schoolchildren (6–7 years 3.3%, 12–13 years 19.9%) for the period June 2016–January 2018 was comparable with that reported in the UK Northern Ireland Childhood Errors of Refraction (NICER) study (6–7 years 2.8%, 12–13 years 17.7%), Aston Eye Study (AES) (6–7 years 5.7%, 12–13 years 18.6%),18 22 Poland (7 years 4.0%, 12 years 14.4%)24 and Australia (6 years 1.6%, 12 years 12.8%),25 26 and significantly lower than that reported in China (5 years 5.7%, 15 years 78.4%).27 In line with the majority of other studies, a significantly higher myopia prevalence was found in children aged 12–13 years old than those aged 6–7 years old. An exception to this was the RESC study in South Africa, where a relatively low and stable myopia prevalence was found with age (7 years 2.5%, 13 years 3.4%).28
Similar to the AES (South Asian: 6–7 years 10.8%, 12–13 years 36.8%; black: 6–7 years 11.4%, 12–13 years 27.5%),22 a markedly higher myopia prevalence was found among non-white children (IES: 6–7 years 12.3%, 12–13 years 39.4%) in the IES. The IES myopia prevalence in the non-white ethnic groups was as follows: East Asians: 6–7 years 14.3%, 12–13 years 46.7%; South Asians: 6–7 years 9.1%, 12–13 years 40.0%; and black: 6–7 years 16.1%, 12–13 years 34.7%.
The IES hyperopia prevalence (6–7 years 25%, 12–13 years 8.9%) was broadly in line with Northern Ireland (6–7 years 26%, 12–13 years 14.7%),18 higher than Australia (6 years 13.2%, 12 years 5.0%),25 26 Poland (7 years 19.2%, 12 years 8.3%)24 and China (5 years 17%, 15 years 0.5%).27 The IES hyperopia prevalence at 6–7 years was higher among the Traveller (35.4%) and white (25.8%) participants when compared with non-white (11.1%) ethnic groups. Although hyperopia prevalence was lower at 12–13 years among white (9.5%) and Traveller (11.6%) participants, it was still significantly higher than that of non-white (3.8%) participants.
The IES astigmatism prevalence (6–7 years 19.2%, 12–13 years 15.9%) was similar to that found in Northern Ireland (6–7 years 24%, 12–13 years 20%),29 higher than Australia (6 years 7.6%, 12 years 9.4%)25 26 and considerably lower than that reported by Dobson et al 30 for Native American children (5–16 years 42%). Similar to Dobson et al,30 the IES found astigmatism to be associated with socioeconomic disadvantage and hyperopia. The predominant cylindrical axis of astigmatism was WTR (6–7 years 80%, 12–13 years 77.3%), similar to Dobson et al’s report (98%).30 The NICER study reported the predominant cylindrical astigmatism axes to be OBL (6–7 years 76%, 12–13 years 59%).29
The association between PVI and refractive error has been well established by the RESC, NICER and Sydney myopia studies.18 26 27 Internationally, PVI is accepted as providing an indicator of visual disability in society,2 and the IES found a relatively high prevalence of PVI in the ‘better eye’ of the younger participants (3.7%) compared with the closest comparator, the NICER study (1.5%).18 The level of PVI in the ‘better eye’ was higher than that reported in Australia (1.5%)25 and lower than that detected in China (10.3%).27Participants from minority groups (Traveller and non-white) in particular were more likely to present with bilateral visual impairment in the IES (Traveller: 6–7 years 13.8% and 12–13 years 1.2%; non-white: 6–7 years 7.4% and 12–13 years 5.8%). As 71.4% of younger participants and 40.0% of older children with PVI in the IES were previously uncorrected, simple spectacle correction would address a considerable proportion of childhood PVI in our population. However, the IES found a considerable number of children who demonstrated visual impairment despite wearing refractive correction because their spectacle correction required updating. Similar to Zhang et al,31 the ‘See well to learn well’ project reported inaccurate spectacle prescriptions to be common and recommended annual refractions to address this issue.
The present study demonstrates an association between socioeconomic disadvantage and PVI which was not reflected in the NICER study. Financial barriers have been cited as the primary reason for non-attendance to eye care services or the failure to purchase spectacles.32 In the UK (where the NICER study was conducted) children are entitled to free eye examinations and spectacle correction. This benefit is not available to all children in Ireland, and children from the non-white and Traveller communities may have particular difficulty in accessing eye care for financial and other reasons. The ‘All Ireland Traveller Health Study’ identified waiting lists, embarrassment and lack of information as the main barriers to Travellers in accessing health services.33 Societal factors which may influence access to eye care include family responsibilities, parents’ inability to leave work to attend eye care appointments with their child and a lack of awareness of the importance of vision checks within the community.32
It is not clear why children with PVI who had a history of spectacle wear did not bring their spectacles to school, but such participants were more likely to be socioeconomically disadvantaged and in the older age group. The present study did not explore the reasons for children not having spectacles at school, but issues such as cost of spectacle repair and replacement may be a factor, and children’s increasing concern over self-image as they age may also impact. A recent Irish study reported that parents viewed childhood myopia as a cosmetic disadvantage, a potential expense and an optical inconvenience, and they were less concerned about the health risks associated with myopia.34 The NICER study reported almost 24% of participants did not bring their prescribed spectacles to school,12 34 and in Saudi Arabia children reported they did not wear their spectacles due to parental disapproval, spectacle discomfort, visual appearance and peer pressure.35 The reasons underpinning failure to wear prescribed spectacles merits further investigation to inform the development of an eye health awareness programme addressing spectacle wear and strategies to reduce vulnerability among children who require spectacles to see clearly or maintain ocular alignment.
Study strengths and limitations
The present study used robust protocols, in line with previous studies, and achieved relatively high school participation rates ensuring a representative sample set of the demographic profile in Ireland schools. Strong (88%) within-school participation rates were also achieved.
Study limitations
Forty-six per cent of selected schools from the initial sampling list were unable to facilitate collection of data: school principal concerns around use of cyclopentolate eye-drops, unavailability of space or diary clashes with other school-based programmes were given as reasons for non-participation. The requisite number of schools was achieved from the reserve list covering the urban/rural, socioeconomic disadvantaged/advantaged and primary/postprimary strata. Due to budgetary constraints, the closed-field Rekto Auto Ref-Keratometer was used as opposed to the Shin Nippon open-field autorefractor used in the AES and NICER studies.18 22 36 Under cycloplegic conditions the use of a closed-field autorefractor on SER outcomes is minimal.37
Conclusion
The IES is the first study to report on refractive error prevalence and visual impairment in schoolchildren living in Ireland. The IES demonstrates that myopia prevalence is similar to that reported in comparable studies in Western Europe. However, the levels of PVI are markedly higher than those reported for children living in Northern Ireland, and there is a previously unreported disparity between children needing and wearing appropriate spectacles in Ireland, indicating suboptimal uptake of eye care services. Further research is needed to explore and address individual and societal barriers to good vision in Ireland.
Acknowledgments
The authors would like to acknowledge the support and participation of the schools, the children, and their parents and guardians in the Ireland Eye Study.
References
Footnotes
Contributors All authors (SCH, JS, KS and VO’D) contributed to the conception and design of this work. All authors were involved in drafting, critically reviewing and approval of the final version to be published.
Funding This work was supported by the Dublin Institute of Technology Fiosraigh grant, the Opticians Board and the Association of Optometrists Ireland.
Competing interests None declared.
Patient consent Not required.
Ethics approval Study approval was obtained from the Dublin Institute of Technology Ethics Committee. This research was conducted under the tenets of the Helsinki Declaration of Human Studies.
Provenance and peer review Not commissioned; externally peer reviewed.
Linked Articles
- At a glance