Article Text

Abstract
Objectives To determine wasting prevalence among infants aged under 6 months and describe the effects of new case definitions based on WHO growth standards.
Design Secondary data analysis of demographic and health survey datasets.
Setting 21 developing countries.
Population 15 534 infants under 6 months and 147 694 children aged 6 to under 60 months (median 5072 individuals/country, range 1710–45 398). Wasting was defined as weight-for-height z-score <−2, moderate wasting as −3 to <−2 z-scores, severe wasting as z-score <−3.
Results Using National Center for Health Statistics (NCHS) growth references, the nationwide prevalence of wasting in infant under-6-month ranges from 1.1% to 15% (median 3.7%, IQR 1.8–6.5%; ∼3 million wasted infants <6 months worldwide). Prevalence is more than doubled using WHO standards: 2.0–34% (median 15%, IQR 6.2–17%; ∼8.5 million wasted infants <6 months worldwide). Prevalence differences using WHO standards are more marked for infants under 6 months than children, with the greatest increase being for severe wasting (indicated by a regression line slope of 3.5 for infants <6 months vs 1.7 for children). Moderate infant-6-month wasting is also greater using WHO, whereas moderate child wasting is 0.9 times the NCHS prevalence.
Conclusions Whether defined by NCHS references or WHO standards, wasting among infants under 6 months is prevalent in many of the developing countries examined in this study. Use of WHO standards to define wasting results in a greater disease burden, particularly for severe wasting. Policy makers, programme managers and clinicians in child health and nutrition programmes should consider resource and risk/benefit implications of changing case definitions.
This paper is freely available online under the BMJ Journals unlocked scheme, see http://adc.bmj.com/info/unlocked.dtl
Statistics from Altmetric.com
Childhood wasting (acute malnutrition) is a global public health problem1 with serious consequences for both individuals and societies.2 While community-based treatment strategies are making important progress tackling wasting in children aged from 6 to less than 60 months1,3 (henceforth ‘children’), wasted infants aged under 6 months are often sidelined.4 A major factor exacerbating the challenges for infants under 6 months is a paucity of disease prevalence data.4 This is important for policy makers, managers and clinicians delivering health and nutrition programmes to plan, monitor and evaluate treatment services for infants under 6 months.
What is already known on this topic
▶ Infants aged under 6 months are often excluded from nutrition surveys and marginalised in malnutrition treatment programmes.
▶ In a May 2009 joint statement, the WHO and UNICEF recommended a transition to WHO growth standards to identify wasting but only reviewed the implications for children aged from 6 to under 60 months.
What this study adds
▶ In developing countries, large numbers of infants under 6 months are wasted; we estimate that 0.8 million are severely wasted worldwide and 2.2 million moderately wasted (diagnosed using NCHS growth references)
▶ Using WHO standards to diagnose wasting results in a large prevalence increase: an extra 3 million infants under 6 months severely wasted and an extra 2.5 million moderately wasted worldwide.
New case definitions based on WHO growth standards are relevant to diagnosing infant under-6-month wasting. WHO standards aim to be internationally applicable, describing how infants and children ‘should grow when free of disease and when their care follows healthy practices such as breastfeeding and non-smoking’.5 A 2009 WHO/UNICEF joint statement endorsed their use for ‘identification of severe acute malnutrition in infants and children’.6 They are now being rolled out internationally and are beginning to replace the previously dominant National Center for Health Statistics (NCHS) growth references.7 However, despite being highlighted as an ‘urgent’ issue by the expert consultation preceding the WHO/UNICEF statement,8 implications for infants under 6 months were not discussed.
We aim therefore: (1) To examine the prevalence of infant under-6-month wasting in developing countries. (2) To examine how reported prevalence will change when WHO standards, rather than NCHS references, are used to define cases.
To contextualise our findings, we compared infant under-6-month wasting with that in older children (from 6 to under 60 months) from the same populations.
Methods
Study design, setting and population
We performed secondary analysis of 21 demographic and health survey (DHS) datasets. DHS are large national surveys, standardised across and within countries (http://www.measuredhs.com/).
We selected 21 countries from a reference population of 36 that account for the majority of the global malnutrition disease burden9 and that had available DHS anthropometry data collected in the past 10 years. We registered our project via http://www.measuredhs.com/accesssurveys/access_instructions.cfm.
Variables and data handling
Current definitions of wasting10 are summarised in table 1.
Case definitions of wasting using NCHS growth references and WHO growth standards6
We calculated NCHS z-scores from weight, height/length, age and sex variables using Emergency Nutrition Assessment for software for standardised monitoring and assessment of relief and transitions (SMART).11 Extreme values are more likely to represent measurement or database errors than an individual who is truly very small or very large. Following commonly used nutrition survey criteria,12 we thus excluded individuals with: weight-for-height z-score (WHZ) (NCHS) <–4 or >+ 6; or weight-for-age z-score (WAZ) (NCHS) <– 6 or >+ 6; or height-for-age z-score (HAZ) (NCHS) <– 6 or >+ 6; or incompatible combinations of HAZ and WHZ: (HAZ >3.09 and WHZ <−3.09) or (HAZ <−3.09 and WHZ >3.09). We calculated WHZ (WHO) for these same individuals.
Sample size
The DHS survey size is large enough for robust national prevalence estimates.13 To determine whether our sample of 21 countries was reflective of all developing countries, we compared our findings against other published data.
Data analysis
Using SPSS version 16 and Excel 2003 we performed three analyses.
First we looked at country-level wasting prevalence using the international ‘integrated food security phase classification’ (IPC).14 This is used to determine the severity of an emergency and guide the need for interventions: more than 3% to under 10% wasting prevalence reflects moderately food insecurity; 10–15% an acute food and livelihood crisis; over 15% a humanitarian emergency; over 30% a famine/humanitarian catastrophe. We emphasise that the IPC cut-offs for acute malnutrition are not normally applied to single age groups, and that anthropometric indicators, on their own, are not normally used to classify emergency situations. They serve here to demonstrate the extent of differences between infants under 6 months and children, and the NCHS and WHO growth norms.
Second, we differentiated between severe and moderate wasting, predicting WHO-based prevalence from NCHS-based prevalence using univariable linear regression.
Third, to illustrate the implications for treatment programmes, we estimated the numbers of individuals affected. Population statistics were from the 2004 United Nations population database.9,15 We assumed that infants under 6 months were 1/10th of the total 0 to under 60 months population.16 We accounted for differences in population size by calculating a population weighting for each country. Assuming that our 21-country sample was representative, we extrapolated the pooled, weighted prevalence estimate to the population in all developing countries. The objective was to illustrate the magnitude of NCHS/WHO changes rather than to derive definitive statistics. We lacked the information to calculate useful confidence intervals. To assess our estimate validity, we compared our figures against other published data.
Finally, to improve understanding of why wasting prevalence changes, we used published NCHS17 and WHO18 tables to plot WHZ −3 and −2 cut-off curves.
Results
In our 21-country sample, 15 534 infants under 6 months and 147 694 children aged from 6 to under 60 months had a valid WHZ (NCHS). Survey details are shown in supplementary appendix 1 (available online only).
Figure 1 shows wasting prevalence by country and by age group. The prevalence of wasting in infants under 6 months is related to the prevalence of child wasting: r2=0.66 (using NCHS), r2=0.84 (using WHO). Prevalence is lowest using NCHS-based case definitions: 1.1–15%, (median 3.7%, IQR 1.8–6.5%). Seven of the 21 countries have acceptably low (<3%) wasting. WHO-based prevalence is higher: 2.0–34% (median 15%, IQR 6.2–17%). Only one country remains in the acceptable category. Among children (figure 1b) NCHS/WHO differences are minimal.

Country prevalence of wasting (<−2 weight-for-height z-score) as defined by National Center for Health Statistics (NCHS) growth references (striped) and WHO growth standards (shaded). Countries are ordered by increasing infant under-6-month wasting prevalence (NCHS). Boxed comments (ie, ‘Famine’, ‘Humanitarian emergency’) refer to the ‘integrated food security phase classification, IPC’ – see Methods section. (A) Wasting prevalence among infants aged from 0 to under 6 months. (B) Wasting prevalence among children aged from 6 to under 60 months.
Figure 2 separates severe and moderate wasting. Highlighted by the steeper slope of the regression line, WHO standards result in more diagnoses of severe wasting, particularly among infants under 6 months. Moderate infant wasting also increases when using WHO standards. In contrast, moderate child wasting decreases.
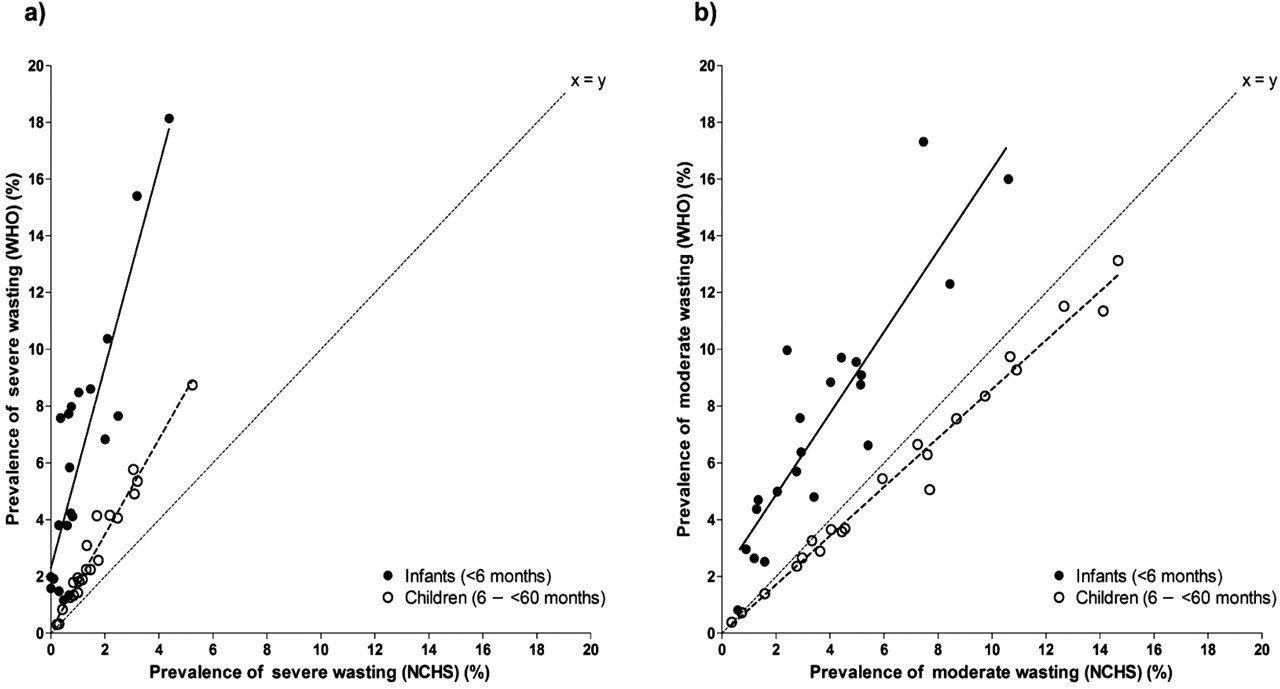
Scatter plot of country prevalence of (A) severe and (B) moderate wasting (weight-for-height z-score <−3 and ≥−3 to <−2 respectively), as diagnosed using either National Center for Health Statistics (NCHS) or WHO growth norms. Regression and identity lines are shown. Each country survey is represented by one filled and one unfilled circle.
Table 2 shows regression equations for figure 2. Regression slopes indicate the magnitude of change in wasting prevalence when case definitions change from NCHS to WHO: severe wasting in infants under 6 months is 3.5 times greater and severe child wasting 1.7 times greater. Moderate wasting in infants under 6 months is also greater with WHO standards. In contrast, moderate child wasting decreases with WHO.
Univariable linear regression models predicting percentage wasting prevalence (WHO) from wasting prevalence (NCHS)
Table 3 presents wasting in terms of the numbers affected. Rounded figures emphasise that these are estimates and assume that our sample is representative of all developing countries.
Approximate numbers of infants and children in all developing countries (millions) affected by severe and moderate wasting, as diagnosed using NCHS and WHO weight-for-height z-score
Finally, figure 3 shows WHO and NCHS WHZ −3 and WHZ −2 cut-off curves for boys. Girl's curves are similar and are not shown. The gap between WHZ (WHO) and WHZ (NCHS) growth curves is greatest for infants under 6 months; this explains why NCHS/WHO changes are greatest in this age group. Differences are also greater for WHZ −3 than for −2 curves; this explains why severe wasting changes more than moderate wasting.

Difference in WHO and National Center for Health Statistics (NCHS) −2 and −3 z-score cut-offs. Arrows on the figure show median length/height at different ages for boys (using WHO growth standards).
Discussion
Principal findings
Our data suggest that large numbers of infants under 6 months in developing countries are wasted. Prevalence is greatest when using WHO growth standards to define cases; severe infant wasting prevalence is 3.5 times greater than when using NCHS references (based on the regression line slope). By comparison, severe child wasting is 1.7 times greater using WHO standards. Moderate infant under-6-month wasting is 1.4 times greater, whereas moderate child wasting decreases.
Strengths
Whereas previous studies have reported an increase in infant under-6-month wasting when using WHO growth standards,19,20 our findings clearly illustrate the magnitude of change. Focusing on weight-for-height directly informs health and nutrition programmes treating infant wasting: survey prevalence reflects need and thus guides treatment service initiation and scale-up.
Limitations
DHS surveys do not record nutritional oedema. As this independently defines acute malnutrition,21 our results underestimate the true caseload that treatment programmes should plan for.
We recognise possible biases: DHS surveys are not all done at the same time of year; weight, age or height might be incorrectly measured or reported. These biases would affect intercountry comparisons and overall prevalence estimates. As the same raw anthropometric measurements (whether accurate or not) are used to calculate an individual's WHZ (NCHS) and WHZ (WHO), the effect on NCHS/WHO changes is unlikely to be marked.
Strengths and weaknesses in relation to other studies
The results extrapolated from our 21-country dataset are comparable to figures cited elsewhere.9,22 This is consistent with our sample being representative of other developing countries. A 2006 review quoted 13.1 million and 47.1 million as severely and moderately wasted, respectively, using NCHS.22 These figures are based on a mix of surveys, some including others excluding infants under 6 months. Our NCHS-based estimates (infants under 6 months and children combined) are 9.3 million severely and 40.7 million moderately wasted. A 2008 review using WHO standards quoted 19.3 million severely wasted.9 Our figure is 19.8 million.
Implications for policy and practice
First, we recommend that nutrition surveys more routinely include infants under 6 months. Our data help estimate infant wasting prevalence, but specific settings are likely to have specific epidemiological patterns.
Second, we suggest that programmes should consider their capacity to treat infants who are identified as wasted. This is particularly important before adopting WHO-based case definitions. Many programmes already struggle to deal with the smaller number of NCHS-diagnosed wasted infants.4
Finally, we call for a review of the effects of diagnosing greater numbers of infants under 6 months as wasted. Current treatment guidelines focus on the anthropometry for diagnosing infant wasting.4 An increased survey prevalence thus equates to greater numbers eligible for treatment. This has possible risks: the evidence base underlying current treatments for infants under 6 months is weak;4,23 if clinically well, exclusively breastfed infants under 6 months are labelled as ‘small’ (ie, below −3 or −2 WHZ), mothers might become concerned24,25 and inappropriately introduce ‘top-up’ foods or breastmilk substitutes.26 This would have adverse consequences given the well-documented protective effects of exclusive breastfeeding.9,27
Unanswered questions
The generalisability of our results could be confirmed by examining other datasets. Work is also needed to explore risk factors for wasting in infants under 6 months and to determine which infants benefit most from which treatments.
We were unable to explore why age-related differences in NCHS and WHO growth curves are so marked. We recognise that WHO standards represent an important advance on NCHS references.28 We note their technical superiority and that they are based on a highly selected population of healthy, optimally fed infants with relatively low statistical variance.29 However, this ‘gold standard’ of growth could be difficult to achieve for many infants in developing countries.
For clarity, we examined only z-score case definitions, which are preferred for nutrition reporting. For admissions, many feeding programmes also use weight-for-height percentage of median.7 Moving from weight-for-height percentage of median (NCHS) to WHZ (WHO) may result in different changes to those described.
Finally, we suggest that alternative diagnostic criteria for infants under 6 months be considered alongside anthropometry: for example, different z-score cut-offs; mid-upper arm circumference,30 body mass index31,32 and clinical criteria.
Conclusions
Wasting among infants under 6 months is prevalent in many of the developing countries examined in this study. Using WHO standards to define wasting results in a greater prevalence of both severe and moderate infant under-6-month wasting. Policy makers and programme managers should consider the implications of this change. An international policy statement on infant under-6-month wasting would fill an important gap because neither the 2009 statement on WHO growth standards6 nor the 2007 statement on the management of wasting3 address this age group.
Acknowledgments
The authors thank MEASURE DHS (Macro International Inc, Calverton, USA) and all countries surveyed for DHS datasets. The authors also thank Melody Tondeur for helpful comments on an earlier draft of the paper. Full DHS datasets used in this paper are available from ORS Macro, USA.
References
Supplementary materials
Web Only Data adc.2010.191882
Table 1
Files in this Data Supplement:
Footnotes
-
Funding This paper was written as part of the MAMI (Management of Acute Malnutrition in Infants) project, funded by the UNICEF led Inter Agency Standing Committee Nutrition Cluster (www.humanitarianreform.org/humanitarianreform/Default.aspx?tabid=74). MK, CG, MM and AS were all part-funded by MAMI. TJC was funded by the Medical Research Council (grant number G0700961).
-
Competing interests None.
-
Provenance and peer review Not commissioned; externally peer reviewed.