Article Text

Statistics from Altmetric.com
Introduction
Road traffic injuries (RTI) is a leading cause of mortality in the world.1 In addition to 1.3 million deaths, 20–50 million people are injured annually.2 To address this enormous burden of RTI, in 2011, the international community launched the Decade of Action for Road Safety 2011–2020 with the goal ‘to stabilize and then reduce the forecast level of road traffic fatalities’.3 4 Four years later, the Sustainable Development Goals (SDG) set the target of ‘[b]y 2020, halve the number of global deaths and injuries from road traffic accidents’ with ‘death rate due to road traffic injuries’ as its indicator.5 6 Since the period of the Decade and the SDG target will end soon and at least the latter is unlikely to be achieved in any country,7 Member States of the United Nations are discussing ‘to define a new time frame’ for the SDG target.8
Is the forecast level of RTI mortality reduced or are we achieving the SDG target if the term were extended to 2030? To the best of our knowledge, there are two forecasts on the global number of RTI deaths,9 10 but they are based on models that are not adequately validated. In 2018, WHO updated its forecast for 2030 at 1 498 653 deaths; but it assumes that a single model fits all countries, and the model is not validated.11 This might partially explain large gaps between the forecast and WHO’s previous forecasts for 2030: 2 112 092 in 2006, 2 190 660 in 2008 and 1 853 581 in 2013.11 Foreman et al forecasted mortality for 2040 at 1 267 790 deaths; but their model validation is inadequate because they did so by using data between 1990 and 2006 to forecast mortality between 2007 and 2016 (10 years) and then applied the chosen model to data between 1990 and 2016 to forecast mortality in 2040 (24 years ahead).10 Since the duration of forecast must not exceed the duration that was validated (24 vs 10 years in this case),12 probably it is impossible to obtain robust forecasts beyond 2030 using data since 1990. An updated forecast on the number and rate of RTI deaths based on adequately validated models using the latest data would help us to obtain deeper insights on how the world is performing, form the last part of the Decade and the SDG terms, and learn the effort it takes to decrease RTI deaths beyond 2020. Therefore, the objective of the current study was to forecast the number and rate of deaths from RTI in the world in 2030.
Methods
Data sources
This study used four data sources freely available online. First, we obtained yearly mortality data from the Global Burden of Disease (GBD) 2017 Study, which estimated mortality from 282 causes including RTI, stratified by country and area (hereafter referred to as ‘country’ for simplicity), sex and age in 1990–2017.1 The GBD Study is a ‘systematic scientific effort to quantify the comparative magnitude of health loss from diseases, injuries and risks by age, sex and population over time’,13 using databases on mortality and morbidity, published papers and reports. Since its first estimation for 1990, it has been updated six times so far. In the current study, we used the estimated RTI mortality rate of all modes of land transport, including those among motor vehicle occupants, motorcyclists, cyclists, pedestrians and other road users (ie, C.1.1.1 through C.1.1.5 of the database1), stratified by country, sex and age (20 groups: 0–4, 5–9, …, 90–94 and 95 years+) in addition to mode of transport.
Second, we obtained population projection for 2030 stratified by country, sex and age from the 2017 Revision of World Population Prospects.14 They are official projections by the United Nations based on current population and projected fertility, mortality and net international migration until 2100. We used its medium variant.
Third, we obtained estimated and projected yearly real gross domestic product (GDP) per capita in 2010 dollars for 1990–2030 by country that the United States Department of Agriculture compiled.15 GDP per capita is an indicator of economic development, which is correlated with road traffic mortality,16 and past forecasting studies also included it in their predictors.9 10 17–19
Fourth, we obtained estimated and projected country-level average years of schooling among people aged 15 years or older from the World Bank.20 Educational attainment is also used in past forecasts for road traffic mortality.9 10 17–19 Since estimates for 1990–2015 and projections for 2015–2030 were made based on different methods, there was a small gap in the estimated and projected values for 2015; therefore, we subtracted the difference of the estimate and projection for 2015 from projections for 2015–2030. In addition, since the estimates and projections were made every 5 years and annual data were unavailable, we employed cubic spline interpolation, with which annual values between two neighbouring values were estimated with a cubic polynomial function that agreed with the two values and whose second derivatives at the two values were set to zero.
We merged the four data sets by country, and among 195 countries in the GBD Study data set, 188 countries had the population data. We excluded seven countries that lacked the population data (American Samoa, Andorra, Bermuda, Dominica, Greenland, Marshall Islands and the Northern Mariana Islands) from all the following analyses. It should not materially affect the forecasted number of deaths in the entire world because their populations total less than 500 000 as of 2015.21 Of the 188 countries, 129 had data for both GDP and educational attainment, 46 had only GDP data, 2 had only educational attainment data and 11 had neither. The 129 countries shared 91% of road deaths in the world in the GBD 2017 Study. The merged data set had 1 541 600 rows stratified by year (41), country (188), sex (2), age (20) and mode of transport (5), and additional columns for the mortality rate, population projections for 2030, GDP per capita and educational attainment. In this data set, the values of the mortality rate for 2018–2030 were missing in all the countries, and the values of the GDP or educational attainment for 1990–2030 were also missing in some countries.
Development of the candidate forecasting models
We developed up to 16 candidate forecasting models and applied them to each of 37 600 subgroups stratified by country, sex, age and mode of transport. The 16 models were based on the ordinary least squares method with a log link function or a Bayesian forecasting method that Girosi and King developed,22 putting linear year as a required predictor and using squared year, log per capita GDP and educational attainment as optional predictors. The choices of the method from the two and of the three optional predictors resulted in 21+3=16 models in total. The following generalised linear equation represents a model that has all the three optional predictors with g being the log link function.

For countries whose GDP and/or educational attainment data were unavailable, the number of candidate models was four or eight. With the Bayesian forecasting method, we smoothed the forecasted mortality rates across the age groups so that adjacent age groups have relatively similar forecasted mortality rates.22
Selection of the best combination of candidate forecasting models
Since we did not know which candidate model was most accurate, we let the data choose the best combination of the models. For each of 1880 subgroups stratified by country, sex and mode of transport (age was excluded as a stratification variable because of smoothing across age group in the Bayesian method), we selected up to 5 models from the 16 candidate models, which produced 16C5+16C4+16C3+16C2+16C1=6884 combinations in total. For countries whose GDP and/or educational attainment data were unavailable, we selected up to three models from the four/eight candidate models, which produced 14 and 92 combinations, respectively. We used these combinations of up to five models because the combination of forecasting models produce less variable results than an individual model and because putting too many models in the combination compromises its accuracy in forecasting.23
To examine the accuracy of each combination of the models, we conducted a fixed-size, rolling window out-of-sample forecast,12 24 in which we used the mortality data for 1990–2002, 1991–2003 and 1992–2004 (fit periods) to forecast mortality rates in 2015, 2016 and 2017 (test periods), respectively. The test periods were 13 years ahead from the final year of the fit periods because we aimed to forecast mortality for 2030, which is 13 years ahead from 2017, the latest year in the GBD Study data. Using multiple fit and test periods is preferable to using a single fit and test period because it is less susceptible to a pattern specific to the arbitrary choice of the origin of the fit period.12
For each of the 1880 subgroups, we selected the best combination of models that minimised the difference between the forecasted mortality rates for the three 1-year test periods and the estimated mortality rates for these 3 years in the GBD Study, multiplied by the corresponding projected population for 2030 and summed across the age groups and the 3 years. We weighted the rates by the projected population for 2030 instead of the population estimates for the 3 years because 2030 is the year for which we aimed to forecast, and thus minimise the forecasting error. To quantify the accuracy of the forecasts in the test periods, we calculated the collective percentage difference between them by summing the weighted rates across the 1880 subgroups and the three 1-year test periods. We also calculated the percentage difference for each subgroup.
Forecasts of the mortality rate and the number of deaths for 2030
We forecasted the mortality rates for 2030 with the best combination of forecasting models, the mortality rate for 1990–2017, and the GDP and educational attainment data for 1990–2030. We obtained the forecasted number of deaths in each of the 1880 subgroups by multiplying the forecasted mortality rate and the projected population for 2030 and summing it across the age groups.
To avoid implausible abrupt changes in the mortality rate between 2017 and 2030, we truncated the change in each subgroup at the maximum and minimum values of the change in the mortality rate between 2004 and 2017 stratified by sex and mode of transport.
Presentation of the results
We displayed the global trend of the number and rate of RTI deaths in 1990–2017 and 2030, using the GBD Study data and our forecasts. We summarised the forecasted number and rate of deaths by mode of transport and the World Bank country income group and compared them to the corresponding estimated number of deaths in the GBD Study data for 2017. We also plotted the mortality rate by income group and six WHO regions (Africa, Americas, East Mediterranean, Europe, South-East Asia and Western Pacific) against the forecasted percentage change in the mortality rate. In this plot, we created one group for high-income countries across the regions. We also categorised low-income and lower-middle-income countries in each region as one group because they showed similar patterns of change between 2017 and 2030 and because some regions had few countries in either of the income groups.
All the statistical analyses were conducted with R V.3.4.4. We used the YourCast package to build the 16 forecasting models and the na.spline function of the zoo package to interpolate the average years of schooling.22 25 26
Results
In the test periods of 2015–2017, the forecasted mortality rates were higher than the estimated mortality rates by the GBD Study by 5.1% collectively after being multiplied by the projected population for 2030 and summed across the subgroups and the 3 years. The percentage differences of the 1880 subgroups ranged from −51.5% to 171.8%, with the median of 0.004%, the mean of 3.9% and the IQR of −0.02% and 1.0%. In 61 (3.2%) of the 1880 subgroups, the forecasted change in mortality rate between 2017 and 2030 was out of the boundaries of the maximum and minimum values of the change in the mortality rate between 2004 and 2017 stratified by sex and mode of transport; therefore, their values were truncated at the maximum or minimum value.
Our models forecasted 1.225 million RTI deaths or 14.3 deaths per 100 000 population in the 188 countries in 2030. Figure 1 shows the global trend of the number and rate of RTI deaths in 1990–2017 and 2030, using the GBD Study data and our forecasts. The number of deaths from RTI peaked at 1.294 million in 2009–2010 and decreased to 1.238 million in 2017. Our models forecasted the number will decrease by 1% in 2030. In contrast, the mortality rate remained at approximately 21 deaths per 100 000 population until 1995, after when it steadily decreased to 16.3 deaths per 100 000 population in 2017. It was forecasted to decrease by 12% by 2030.
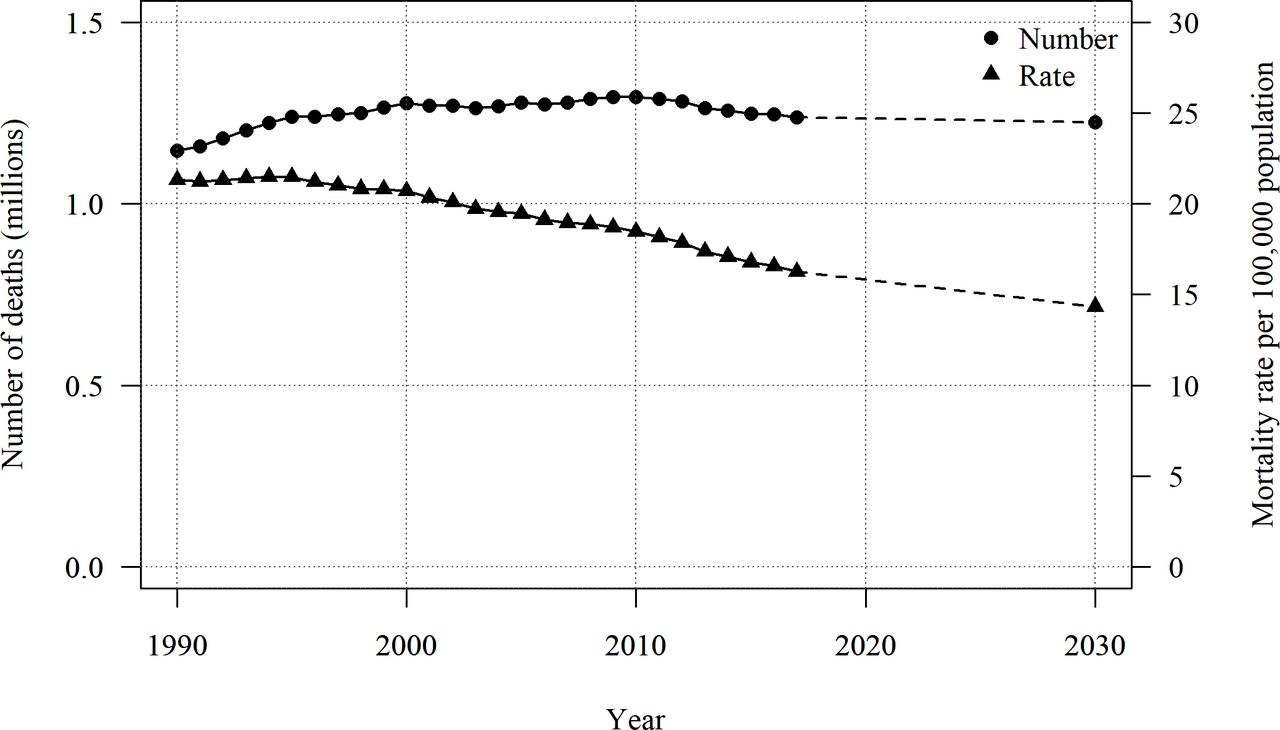
Trends of the number and rate of deaths from road traffic injuries in the world*. * Data between 1990 and 2017 are from the Global Burden of Disease Collaborative Network.1
Table 1 presents the forecasted number of RTI deaths by mode of transport. While the number was forecasted to increase by 11% and 9% between 2017 and 2030 among motorcyclists and cyclists, respectively, it was forecasted to decrease by 10% among pedestrians.
Forecasted numbers of deaths from road traffic injuries in 2030 by mode of transport
We examined the number and rate of deaths stratified by country income group (table 2). Between 2017 and 2030, the number of deaths was forecasted to increase from 131 731 to 147 205 (12% increase) in low-income countries and 492 486 to 547 843 (11% increase) in lower-middle-income countries. On the contrary, it was forecasted to decrease from 482 474 to 409 965 (15% decrease) in upper-middle-income countries and 130 985 to 119 488 (9% decrease) in high-income countries.
Number and mortality rate from road traffic injuries in 2017 and 2030 by country income group
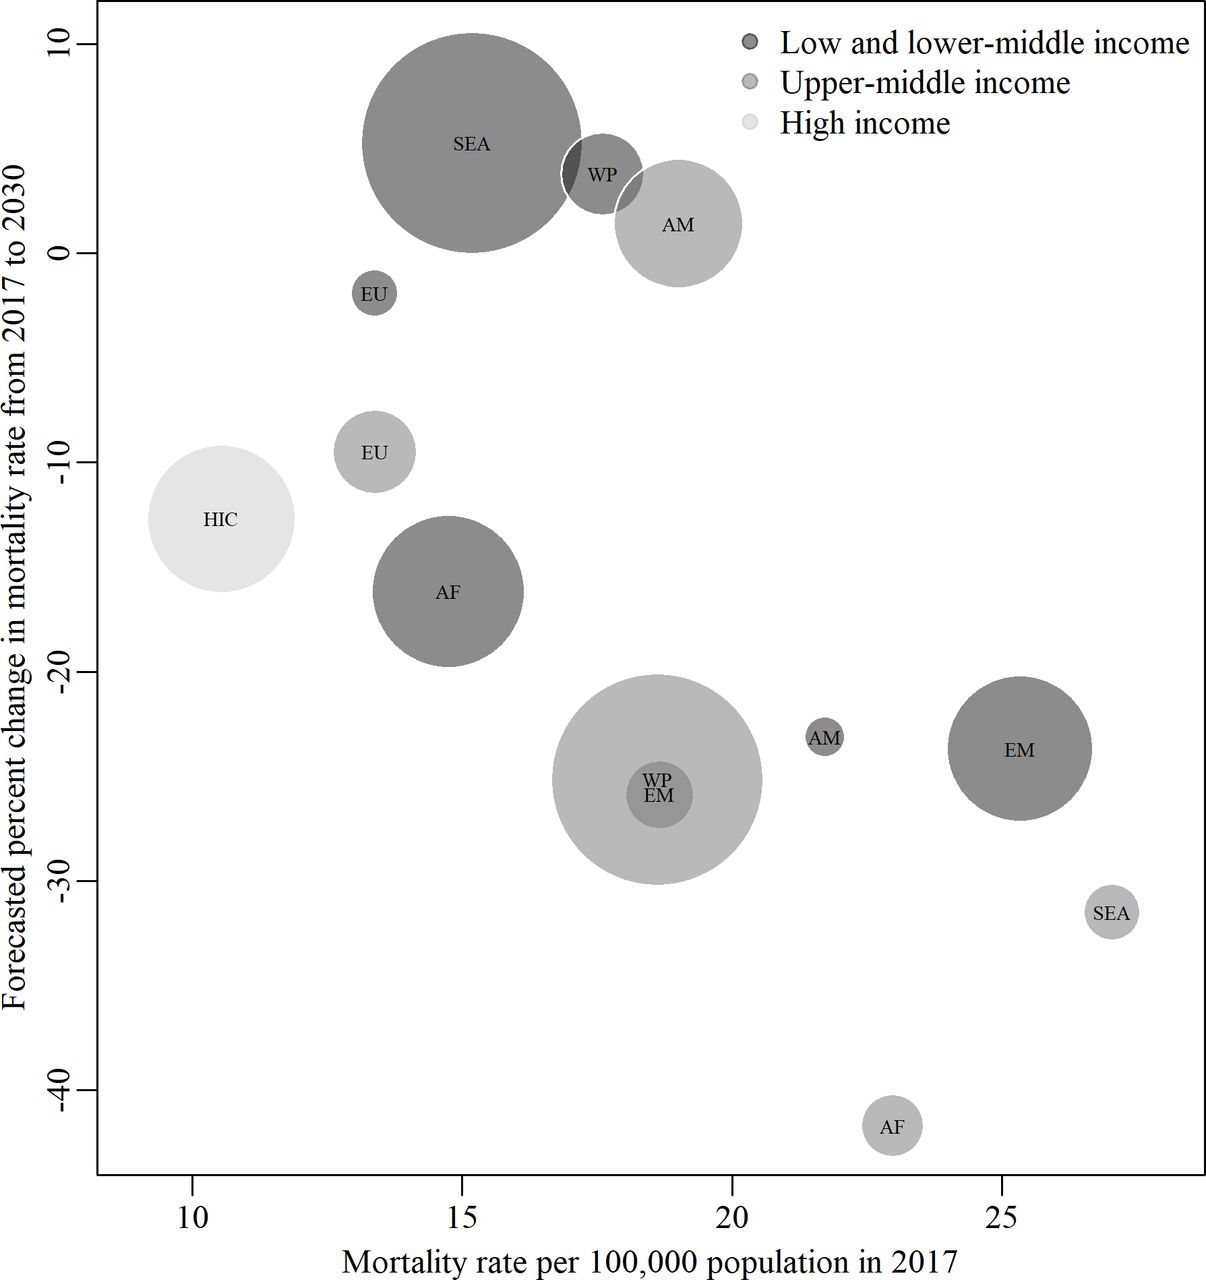
Figure 2 shows the relationship between the mortality rate in 2017 and the change in the mortality rate between 2017 and 2030 by country income group and WHO region. The rate was forecasted to increase among low-income and lower-middle-income countries in the South-East Asia and Western Pacific regions and upper-middle-income countries in the Americas region.
Mortality rate from road traffic injuries per 100 000 population in 2017 and its forecasted percentage change from 2017 to 2030 by country income status and region. The area of circle is proportional to the estimated number of road deaths in each group in 2017. AF, Africa; AM, Americas; EM, East Mediterranean; EU, Europe; HIC, high-income countries; SEA, South-East Asia; WP, Western Pacific.
Discussion
The current study forecasted 1.225 million RTI deaths and 14.3 deaths per 100 000 population in the world in 2030, which were 1% and 12% less than those in 2017, respectively. The number of deaths was forecasted to increase by approximately 10% among motorcyclists and cyclists, and decrease by 10% among pedestrians. While the number was forecasted to decrease by 15% and 9% in upper-middle-income and high-income countries, respectively, it was forecasted to increase by 12% and 11% in low-income and lower-middle-income countries, respectively. The overall global rate, without considering national income levels, was forecasted to decrease; however, it was forecasted to increase in low-income and lower-middle-income countries in the South-East Asia and Western Pacific regions and upper-middle-income countries in the Americas region.
The forecasted number of deaths was significantly smaller than the WHO’s latest forecast of 1.499 million deaths11; nevertheless, it was forecasted to remain almost constant between 2017 and 2030, and the goal of the Decade of Action for Road Safety to ‘stabilize and then reduce the forecast level of road traffic fatalities’ by 2020 is not likely to be achieved, at least in terms of the number of deaths. This also means that the SDG’s target of halving the number of RTI deaths by 2020 is far away and visionary even if the indicator is mortality rate and the target year is extended from 2020 to 2030. This analysis reiterates calls for focused global attention to the implementation of evidence-based interventions for RTI.
Our model is based on two untestable assumptions: One is that the RTI mortality rate for 2030 can be forecasted with data between 1990 and 2017, and the other is that the best combination of models to forecast mortality in the test periods remains the same to forecast mortality for 2030. These assumptions may not hold especially in high-income countries with the spread of highly innovative technologies, such as autonomous vehicles, and their potential to drastically reduce RTI; however, it is unlikely to affect the global number of deaths materially because over 90% of fatal RTI occur in low-income and middle-income countries,2 where autonomous vehicles are unlikely to be widely used by 2030. All forecasting studies are based on assumptions that are similar to these two assumptions, and they do not aim to predict what will happen in the future but aim to provide the best evidence based on past data. We hope our forecast will turn out to be grossly wrong with accelerated efforts.
A key strength of this study is that it provides a comprehensive forecast of RTI mortality in the world in 2030 stratified by country, sex and mode of transport. To do so, we chose the best combination of models for each subgroup from up to 6884 combinations based on fixed-size, rolling window out-of-sample forecasts with the three fit periods and test periods. In the test periods of 2015–2017, the bias of the forecast was reasonably small: It was higher than the estimates of the GBD Study by 5.1% collectively. We presented the results stratified by mode of transport, country income status and region, which would help us to identify and prioritise countries and populations for enhanced interventions.
A limitation of this study is that it does not directly address the uncertainty of forecasts; these include the inherent uncertainty in the estimation of RTI mortality rates in the GBD Study, the population projection, GDP per capita, average years of schooling and future changes in RTI mortality rates. The uncertainty is likely to be large: The forecasted number of RTI deaths by Foreman et al had a 95% uncertainty interval of 1.062 to 1.647 million.10 Another limitation of this study is that it does not consider potential autocorrelation of the residuals in the forecasting models. Doing so might decrease the bias of the forecast, but we consider that it would not change the results materially because the bias of the current forecasting model is reasonably small.
In conclusion, this study forecasted 1.225 million deaths and 14.3 deaths per 100 000 population from RTI in the world in 2030, which would be a 1% and 12% decrease from 2017, respectively. The international community needs to accelerate its efforts to achieve the goal of the Decade of Action for Road Safety and the target of the SDG. This will require concrete implementation of road safety interventions globally.
What is already known on the subject
By 2020, the United Nations Decade of Action for Road Safety 2011–2020 aims to ‘stabilize and then reduce the forecast level of road traffic fatalities’, and the Sustainable Development Goals aims to ‘halve the number of global deaths and injuries from road traffic accidents’.
Recent studies estimated the current number of road deaths at approximately 1.3 million and forecasted 1.499 million deaths in 2030 and 1.268 million deaths in 2040; however, these forecasts are based on models that are not adequately validated.
What this study adds
The forecasting model we developed estimated 1.225 million deaths and 14.3 deaths per 100 000 population in 2030, which would be a 1% and 12% decrease from 2017, respectively.
Neither the goal of the Decade nor the target of the Sustainable Development Goals is likely to be achieved, even if the terms are extended from 2020 to 2030.
Footnotes
Contributors AAH conceived the study. HI designed the study, conducted the statistical analyses with support from QL and drafted the manuscript. QL, AB and AAH reviewed the draft and provided comments that led to substantial revisions of the manuscript.
Funding The authors have not declared a specific grant for this research from any funding agency in the public, commercial or not-for-profit sectors.
Competing interests None declared.
Patient consent for publication Not required.
Ethics approval This study did not need an Institutional Review Board (ethics committee) review because it did not involve data about living people or contacts with any informants.
Provenance and peer review Not commissioned; externally peer reviewed.
Data availability statement Data are available in a public, open access repository.