Meta-Research: Gender inequalities among authors who contributed equally
- University of Connecticut, United States
- Johns Hopkins School of Public Health, United States
Abstract
We analyzed 2898 scientific papers published between 1995 and 2017 in which two or more authors shared the first author position. For papers in which the first and second authors made equal contributions, mixed-gender combinations were most frequent, followed by male-male and then female-female author combinations. For mixed-gender combinations, more male authors were in the first position, although the disparity decreased over time. For papers in which three or more authors made equal contributions, there were more male authors than female authors in the first position and more all-male than all-female author combinations. The gender inequalities observed among authors who made equal contributions are not consistent with random or alphabetical ordering of authors. These results raise concerns about female authors not receiving proper credit for publications and suggest a need for journals to request clarity on the method used to decide author order among those who contributed equally.
https://doi.org/10.7554/eLife.36399.001Introduction
In recent decades, the number of authors per publication has increased steadily (National Library of Medicine, 2018; Colledge et al., 2013). The causes for this trend include the higher production of scientific information by research teams (Wuchty et al., 2007) and an increase in the data content of published papers (Cordero et al., 2016; Fontanarosa et al., 2017), which in turn usually requires contributions by additional scientists. This increase in the number of authors per article has raised questions about credit allocation. Author order in an article byline is the major mechanism for assigning credit when there is more than one author. In the biomedical literature, the first author is usually the individual who has done most of the work and that individual traditionally receives most credit for the publication. This in turn has resulted in an increase of authors claiming equal credit in author byline positions, which has posed vexing questions as to how credit should be apportioned (Tscharntke et al., 2007; Moustafa, 2016). Papers listing equal contributions comprised less than 1% of publications in 2000, but by 2009 this figure had increased to between 1.0% and 8.6%, depending on the journal (Akhabue and Lautenbach, 2010). For the journal Gastroenterology, for example, 21% of the papers published in 2011 and 2012 indicated two or more authors contributing equally (Dubnansky and Omary, 2012). Hence, the inclusion of statements of equal contribution by two or more authors is an increasingly common mechanism for sharing credit as the size of research teams increase in the biomedical sciences.
The shared authorship phenomenon is an important issue to study because the ability of junior investigators to publish first author papers is usually a necessary step for securing positions, acquiring funding, and receiving credit. To date very little scholarly work has been done to understand the mechanisms used in sharing credit allocation. In particular, we were interested in trends involving the sharing of equal contributions among authors differing in gender, since inequities in distribution could translate into differences in gender recognition for scientific accomplishment. Numerous studies have documented underrepresentation of women in academic faculty and in scientific positions, especially at the more senior ranks (Awad et al., 2017; Sassler et al., 2017; John et al., 2016; Hill et al., 2015). Although the mechanisms for these trends are complex, one possibility is that they receive less credit for their scientific work (John et al., 2016). Several studies have documented gender differences in the frequency of first authors, with women less likely to occupy the first position (Fishman et al., 2017; Bonham and Stefan, 2017). A large study of Swedish scientists revealed that women are more likely to be middle authors and less likely to be senior authors (van den Besselaar and Sandström, 2017). Hence, the available evidence suggests that disparities exist in gender contribution and position to the author byline of scientific publications.
In this study, we analyzed the gender order of publications where two or more individuals shared the first author position by stating that they had contributed equally. The expectation from equal contribution is that the order of author gender will be equally distributed or perhaps follow some ordering convention such as alphabetical order. Instead, we found a predominance of male authors at the first author position irrespective of whether first authorship was shared by two or more scientists. Furthermore, male-male author pairings and all male authors sharing equal credit was far more frequent than corresponding female combinations. The finding of gender inequalities among authors who contributed equally suggests that inequities in credit sharing may be a contributing factor to the continuing gender imbalances reported for academic positions, grant funding, and awards. The results suggest a need for more clarity and transparency in stating how author position is selected when more than one author share equal credit.
Results
We analyzed 3034 scientific publications from 1995 to 2017 where two or more authors stated to have contributed equally. From this set, we identified the gender for each of the authors listed as contributing equally in 2898 publications, which provided our usable dataset (Table 1). Two authors were listed as contributing equally in 2406 (83%) publications, while 492 (17%) listed three or more (Table 1). We identified eight classes of author combinations claiming equal contribution: male-male, male-female, female-male, female-female, more than two all-male, more than two all-female and more than two with mixed gender having either a male or female listed first (Figure 1). For publications where two authors contributed equally, the most common gender pairing involved mixed gender, which was closely followed by male-male author pairings and female only author pairings were least frequent. These 2406 publications included 57 publications identified in an initial search to determine what could be expected in the literature, for which we only recorded gender order data. As such, they were removed from further data analysis, which gave us 2349 publications with two co-authors. Of these, 1377 papers had two authors of the same gender (mm or ff), leaving 972 with mixed gender authors claiming equal contribution, which consisted of 548 (56.38%) where the male author was listed first and 424 (43.62%) where the female author was listed first. Assuming that individuals of both genders contributed equally and that this author order was random, one would have expected roughly equal male-female and female-male author pairings. Comparing the expected and observed gender ratios yielded a Chi-square statistic of 15.8 (df = 1 and p<0.001).
Table 1
Summary of data on authors listed a contributing equally.
https://doi.org/10.7554/eLife.36399.002| Article statistics | Contributed equally = 2 | Contributed equally > 2 | |||||||||
|---|---|---|---|---|---|---|---|---|---|---|---|
| Journal title | Total | Unknown | Usable | mm | mf | ff | fm | m first | f first | all M | all f |
| Biophysical J | 101 | 2 | 99 | 60 | 17 | 5 | 9 | 5 | 0 | 3 | 0 |
| Cell Reports | 105 | 1 | 104 | 41 | 12 | 11 | 15 | 12 | 9 | 3 | 1 |
| Curr Biol | 103 | 4 | 99 | 41 | 23 | 14 | 12 | 2 | 4 | 2 | 1 |
| eLife | 90 | 2 | 88 | 25 | 18 | 15 | 11 | 5 | 6 | 8 | 0 |
| J Biol Chem | 300 | 28 | 272 | 99 | 52 | 35 | 48 | 15 | 11 | 6 | 6 |
| J Cell Bio | 101 | 3 | 98 | 22 | 35 | 14 | 17 | 4 | 4 | 2 | 0 |
| J Clin Invest | 121 | 6 | 115 | 42 | 19 | 11 | 19 | 12 | 6 | 6 | 0 |
| J Exp Med | 210 | 13 | 197 | 65 | 40 | 26 | 30 | 10 | 8 | 11 | 7 |
| J Immunol | 308 | 10 | 298 | 89 | 76 | 59 | 48 | 16 | 3 | 5 | 2 |
| mBio | 100 | 2 | 98 | 27 | 26 | 12 | 14 | 8 | 7 | 3 | 1 |
| Nature | 104 | 6 | 98 | 44 | 12 | 7 | 8 | 14 | 3 | 10 | 0 |
| PLOS Bio | 110 | 9 | 101 | 39 | 18 | 13 | 17 | 6 | 5 | 3 | 0 |
| PLOS Comp Bio | 95 | 2 | 93 | 45 | 14 | 6 | 11 | 3 | 4 | 10 | 0 |
| PLOS Genet | 186 | 8 | 178 | 52 | 26 | 16 | 23 | 20 | 35 | 6 | 0 |
| PLOS Negl Trop Dis | 105 | 6 | 99 | 32 | 13 | 21 | 19 | 8 | 4 | 2 | 0 |
| PLOS Pathogen | 179 | 7 | 172 | 35 | 39 | 33 | 25 | 20 | 9 | 7 | 4 |
| PNAS | 411 | 14 | 397 | 151 | 66 | 44 | 61 | 30 | 19 | 22 | 4 |
| Science | 128 | 11 | 117 | 34 | 15 | 21 | 25 | 7 | 9 | 6 | 0 |
| Initial search* | 57 | 0 | 57 | 0 | 35 | 0 | 22 | 0 | 0 | 0 | 0 |
| Misc† | 120 | 2 | 118 | 57 | 27 | 14 | 12 | 4 | 2 | 1 | 1 |
| 3034 | 136 | 2898 | 1000 | 583 | 377 | 446 | 201 | 148 | 116 | 27 | |
-
*These papers are from the early searches used to identify the variables in this study and only mf and fm numbers were recorded. These 57 papers were removed from subsequent analysis.
†Miscellaneous includes the following journals; the number of articles in which two or more authors made equal contributions is shown in parenthesis for each journal. American Journal of Pathology (1); Angewandte Chemie (17); Biochemical and Biophysical Research Communications (2); Blood (1); BMC Bioinformatics (1); BMC Proceedings (1); BMC Systems Biology (1); Brain Pathology (1); Cancer Research (2); Cell (6); EMBO Journal (4); European Journal of Immunology (1); FEBS Letters (27); Genes and Development (5); Genome Research (1); Hepatology (1); International Journal of Cancer (2); Journal of Bone and Mineral Research (2); Journal of Cell Science (2); Journal of Molecular Biology (1); Journal of Physiology (2); Memórias do Instituto Oswaldo Cruz (15); Nature Biotechnology (1); Nature Cell Biology (1); Nature Genetics (15); Nature Materials (1); Nature Medicine (4); PLOS One (1); Protein Science (1).
-
Table 1—source data 1
All data organized by journal, author/gender category, and year.
- https://doi.org/10.7554/eLife.36399.003
Figure 1 with 1 supplement see all
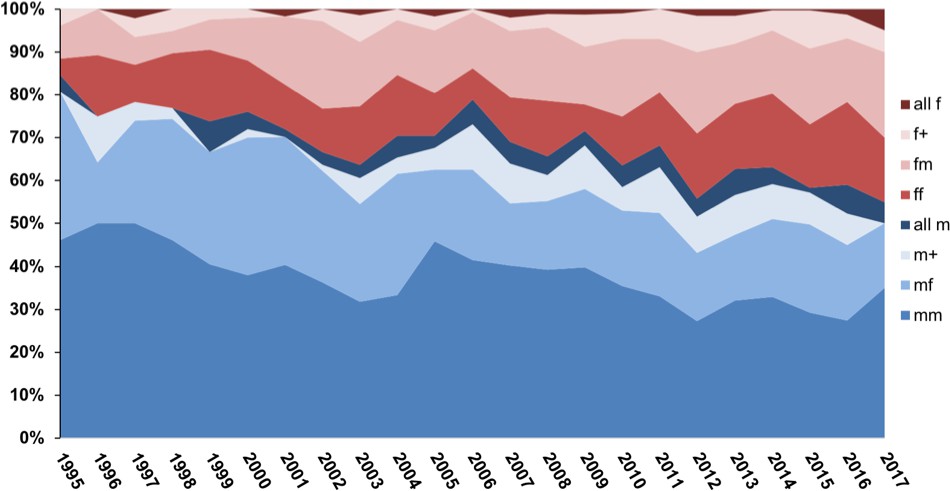
Proportion of various gender combinations among joint first authors in scientific papers published between 1995 and 2017.
We studied papers in which two or more authors shared the first author position: ‘fm’, ‘ff’, ‘mf’ and ‘mm’ represent papers in which two authors shared the first author position, with the actual order of the authors being female-male, female-female, male-female and male-male. For papers in which more than two authors shared the first author position, ‘all f’ means that all these authors were female, ‘all m’ means they were all male, and ‘f+’ or 'm+' means that the first author listed in a mixed-gender combination was female or male respectively. The plot shows that the proportion of combinations in which a male author is listed first (various shades of blue) is decreasing over time.
-
Figure 1—source data 1
Raw data for Figure 1.
Excel database of the papers examined in this study. Grey shaded rows indicate the papers excluded from analysis when gender identification was not able to be determined.
- https://doi.org/10.7554/eLife.36399.007
Dividing the mixed gender two author publications into those published 1995–2006 and 2007–2017 yielded 190 and 358 pairings for male-female author order, respectively, and 103 and 321 pairings with female-male author order, respectively. When these ratios were analyzed with the Chi-square statistic the difference between observed and expected ratios was significant in the 1996–2006 group (p<0.001), but not in the 2007–2017 group (p=0.156). Analysis of publications for gender order using a Generalized Linear Population-Average model with Binomial Distribution and Logit-link estimated with Generalized Estimating Equations (GEE) and robust variance provided an estimate for gender bias in first authorship as the dependent variable among papers with two equally contributing authors of different gender (N = 972). The Odds Ratio of Gender Bias in First Authorship (95% Confidence Interval) using year as a continuous variable was 0.958 (0.931–0.986), indicating an estimated 4.2% decrease in odds of preference for males in the first position per year considering all publications from 1995 to 2017, adjusted for country, (95% CI: from 1% to 7% decrease per year, p-value=0.003). The Odds Ratio comparing publications after 2007 to those in years 1995–2007 (95% confidence interval) using the year as a categorical variable and adjusting for country was 0.605 (0.443–0.828) with p=0.002. Hence, the preference for males in the first position was pronounced prior to 2007, but has since decreased (Figure 2).
Figure 2
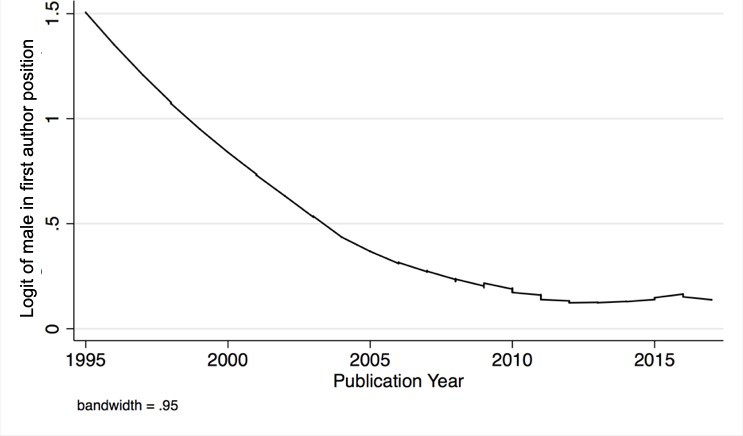
Gender bias in the first author position over time.
Temporal trend in gender bias among two equally contributing authors of different gender: the y-axis is log (p/(1 p)) where p is the probability of bias; the x-axis is publication year. In the absence of bias, log (p/(1 p)) would be zero.
-
Figure 2—source data 1
Data analysis tables used for Figure 2.
- https://doi.org/10.7554/eLife.36399.009
-
Figure 2—source data 2
Data analysis log.
- https://doi.org/10.7554/eLife.36399.010
-
Figure 2—source data 3
Data management file for data analysis.
- https://doi.org/10.7554/eLife.36399.011
For the 492 publications with three or more authors contributing equally, the most common form involved mixed gender contributions (349, 71%). Of these 349 publications, 201 (57.59%) listed a male author first while 148 (42.40%) listed a female author first. Comparing male author first versus female author first ratios observed versus expected values yielded p=0.005. Although lower numbers precluded a decadal analysis these numbers imply a preference for male authors in the first positions of a multi-author byline when three or more individuals contribute equally. Analysis of the frequency of publications with three or more authors as a function of publication year revealed a positive trend line with time, suggesting that these author combinations are becoming more frequent (Figure 3). Analysis of likelihood of male preference in the first author positions when three or more individuals contributed equally did not reveal any statistically significant associations with year of publication or country. The results of the Generalized Linear Population-Average model described above showed a 1% decrease in odds of gender bias per year among publications with more than two equally contributing authors (estimated Odds Ratio = 0.99, 95% confidence interval: 0.933, 1.051).
Figure 3

Percentage of papers with two or more authors contributing equally as a function of time.
Points denote the percentage of papers with where more than two authors claimed equal contribution. Trendline R2 value as 0.4857.
-
Figure 3—source data 1
Raw data for Figure 3.
- https://doi.org/10.7554/eLife.36399.013
-
Figure 3—source data 2
Data analysis log.
- https://doi.org/10.7554/eLife.36399.014
-
Figure 3—source data 3
Data management file for data analysis.
- https://doi.org/10.7554/eLife.36399.015
Analysis of the relative distribution of the eight types of author association as a function of continent from which the publication originated revealed similar patterns for Asia, North America and Europe (Figure 4). Patterns for Africa, Europe, and South America were different from those of Asia, North American and Australia groupings, but some of these categories contain fewer papers, which suggests a need for caution in comparing between these continental groupings. We considered analyzing temporal trends for various countries, but with the exception of the United States had too few per country for a meaningful analysis. Consequently, we divided the publications into three groups of origin, United States, Europe and Other. Analysis of the predicted probabilities of gender bias in first authorship by year and country among papers with two equally contributing authors of different gender showed a declining trend for each of the three world regions (Figure 4). In these analyses, there were no differences in gender bias by country.
Figure 4
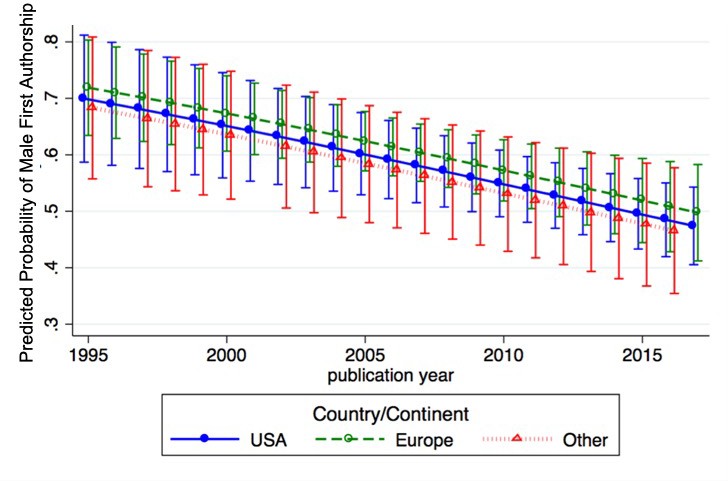
Gender bias in first authorship by year and geography.
Predicted probabilities of male first authorship by year for three geographical regions (USA: blue; Europe: green; Other: red) among papers with two equally contributing authors of different gender (N = 972).
-
Figure 4—source data 1
Data analysis tables used for Figure 4.
- https://doi.org/10.7554/eLife.36399.017
-
Figure 4—source data 2
Data analysis log.
- https://doi.org/10.7554/eLife.36399.018
-
Figure 4—source data 3
Data management file for data analysis.
- https://doi.org/10.7554/eLife.36399.019
We analyzed the frequency of alphabetical ordering for author sequences for all publications examined. Overall, 49.6% of all publications had the authors names ordered alphabetically. The percentages of author associations for which the author sequence was alphabetical were 49%, 49%, 48%, 55%, 22%, 41%, 26%, and 25% for male-male, male-female, female-male, female-female, three or more authors all male, three or more authors all female, three or more authors male author first, and three or more authors female author first, respectively. In comparing male vs, female author first position there was no significant difference between the frequencies of alphabetical versus no-alphabetical ordering. However, among those publications where the authors were ordered alphabetically male-female author combinations were more common than female-male author combinations (Chi-square statistic is 4.359; p=0.037).
Discussion
Male-male author combinations were the most common gender combination and this applied to combinations involving both pairs and association of more than two authors. Female-female author combinations were the least common gender combination comprising less than half the number of observed male-male author combinations. Male-Female and Female-Male author combinations were almost as common as male-male author combinations, but the frequency differed in gender order. Male-female author combinations were significantly more frequent than female-male author combinations, with a ratio of 1.3:1. However, analysis of the data as a function of time revealed that the effect was strongest for publications dating before 2007. In the past decade, the preference for male gender in the first author position among mixed-gender pairings declined such that there was no statistical difference between observed gender order pairings and those expected from random assignments. Whereas pairings of two authors sharing equal contribution for the first author position comprised the majority of combinations, we found a significant minority for author combinations involving three or more authors contributing equally. As with single pairings, the preference for males in the first author position also occurred with author combinations of three or more authors listed as contributing equally, with a ratio of 1.35:1. Male only combinations were also more common when three or more authors contributed equally such that there were almost four times more male only combinations than female only combinations.
Although we have no information on the mechanism for selection of these gender author assignments the disequilibrium between observed and expected ratios strongly suggests that these selections were not made randomly. In fact, only one of the publications we analyzed provided the rationale for the author order and indicated it was based on alphabetical ordering (see, for example, Bieberstein et al., 2012). In the biological sciences, the first author position is the person who is the most important contributor to the study and these are often students and postdoctoral fellows who are considered trainees. Hence, having first author publications is measure of success during the graduate and postdoctoral training years that can affect career trajectories. It is conceivable that some of the disequilibrium in gender ratio in the earlier years of this study reflects an inherent bias towards males that was a residual result of seniority differences at the time that the work was prepared for publication, as males have comprised a higher percentage of trainees until recent decades (National Research Council, 2000). However, such an explanation would not apply for most papers published in the 21st century as the proportion of women trainees in the biological sciences, which this data set reflects, has exceeded that of men since 2000 (Committee on Women in Science, Engineering, and Medicine, 2019).
Given the importance of the first author position in credit allocation for publications in the biomedical sciences, the disparity in frequency between male-female and female-male author combinations raises the possibility for unequal gender benefit among combinations sharing the first authorship despite these being designated as contributing equally. We note that information on equal contributions is often included as a footnote and for some publications it is stated only in the pdf and print versions and are thus absent from the online full text versions, which are increasingly the format readers access. Consequently, it is likely to that the author listed as contributing equally in the second position may be not benefit as much as the author listed first, which is usually recognized as the most important contributor in biomedical publications. Recognizing this issue, some journals are encouraging citations to indicate both authors in equally contributed publications, instead of the traditional ‘firstname et al.’ format (Drubin, 2014).
The finding of a disproportionate number of males in the first author position relative to expected numbers had these positions been selected randomly is consistent with several studies showing that female authors receive less credit recognition relative to their male author colleagues. A study of PhD students revealed that male graduate students were 15% more likely to be listed in publications than their female counterparts (Feldon et al., 2017). An analysis of male and female authorship patterns for publications in natural sciences, social sciences, and the humanities showed that a large predominance of male author over female authors in the first and last positions (West et al., 2013). Perhaps most relevant for our findings is the observation that women receive less credit than men for team work in academia (Sarsons, 2017). The finding that the preference for male first publications had declined in the past decade could reflect gains by women in academia in recent years. Nevertheless, given that authorship position in a scientific paper can have career altering consequences, choices made years ago could have long lasting effects that may still be a contributing factor to current gender inequities in academia.
We observed that male-only author pairings were more common in author combinations of two or more authors. This finding cannot be explained by larger numbers of male trainees, as women have exceeded men in PhD training since 2000 (Committee on Women in Science, Engineering, and Medicine, 2019). Again, without access to how these orderings were decided, or to the gender composition in the laboratories, we cannot infer the causes for this gender preference. Nevertheless this observation is consistent with the finding that males are more likely to share data with other men, which can lead to scientific discussions and collaborations that result in shared first author publications (Massen et al., 2017). The high prevalence of publications sharing first authorship among three or more males echoes the concern that male-exclusive networks exist in science (Massen et al., 2017).
The frequency of multi-author equal contributions dropped rapidly for combinations of more than three authors, but we observed at least two groupings of 11 authors (Dastani et al., 2012; Ohlsson et al., 2011). We noted a positive trend for the frequency of publications listing three or more authors contributing equally, suggesting that such author combinations may be increasing as a function of increased team science in biomedical research. We note that some have questioned whether statements of equal author contribution can ever be accurate given the problem of weighing the relative value of different contributions (Moustafa, 2016). A recent analysis of journal instructions for authors revealed that none addressed equal contribution statements (Resnik et al., 2016). Our findings of a disequilibrium between observed and expected male and female authorship positions among groups of authors that contributed equally suggests a need for explicit requirements that explain how the ordering is done.
The majority of publications analyzed came from the United States, reflecting the predominance of this country in contributing to the biomedical literature. Analysis of distribution of author combinations for the continent of origin produced similar patterns for Asia, Australia and North America, which may reflect similar practices in author order selection in the contributing countries. We note with interest that the patterns for Africa, Europe, and South America differed from the Asia, Australia, and North American groupings, but caution against drawing conclusions since for some of these continent groupings the number of publications analyzed may not be adequate to make direct comparisons. Nevertheless, the possibility that there are differences in author gender order and combinations depending on country of publication is an interesting area for future investigation.
We acknowledge some limitations in our study, which suggest caution in interpreting the data. The finding that the preferences for males and females in the first author position varied over time, suggests that variables contributing to these decisions may be changing rapidly. We noted differences between journals in the proportion of pairings, suggesting that that there may be differences between fields that could skew results depending on the source database. Limitations on the use of search engines are discussed in the Materials and Methods. Our findings should be complemented by subsequent studies, which may be able to analyze a larger number of publications across many disciplines through automated searches linked to gender image recognition software. In this regard, a recent study that examined papers published between 2005 and 2014 with co-first authors of different genders using online databases in addition to our method of website images, found that there was no difference in female versus male authors in the first position in basic science journals, which is consistent with our results, but that female co-first authors were less represented in the first position in clinical journals (Aakhus et al., 2018). As such, our finding that a disequilibrium exists in gender ratios among authors listed as contributing equally in the first position is sufficiently robust to raise concern on the fairness of shared credit contributions assignments in biomedical publications. At the very least, this study opens a window into a relatively unexplored area in the sociology of science that could have major consequences for current efforts to improve gender equity in academia.
In summary, our results provide evidence that the first position of author bylines involving mixed gender combinations contributing equally to a publication is more likely to have a male author. We note that the disequilibrium in gender ratios among authors who contributed equally has abated in the past decade. This is certainly good news and suggests that the problem may be going away. However, milestones in scientific careers such as hiring and promotion often occur many years after publications in graduate school and postdoctoral training when scientists are likely to be in the first authorship position. Consequently, it is possible that the effects of the disequilibrium measured in this study will linger for some time to come with disproportionately negative effects on women who shared first authorship and appeared second in the author byline. Given the importance of first authorship in biomedical publications and the increasing popularity of sharing authorship with the rise of team science a male preference could have consequences on hiring decisions, promotion and the distribution of resources such as grant funding. This information should be of interest to promotion and grant review committees as they consider the merit of applications who list papers stating that they contributed equally. The finding of gender inequalities among authors who contributed equally raises the possibility that some authorship decisions are vulnerable to conscious or unconscious biases and this suggests the need for journals to require statements of how author ordering was done in publications claiming equal contributions.
Materials and methods
The study was done in three stages. First, we undertook a cursory review of publications using the Google Scholar search engine with the keywords ‘contributed equally’ to familiarize ourselves with the variables involved and get a sense as to whether there were differences in how often males and females shared first author positions. This stage involved analyzing several hundred publications, which identified 57 publications that had one or more co-first authors (listed in Table 1 as results from ‘early searches’). This initial analysis revealed that whereas our initial interest was in gender positions among mixed gender pairs contributing equally there were many publications with more than two authors, suggesting the need for analyzing different journals. These 57 publications were not used in the statistical analysis. In the second stage, we undertook a search of papers using two search strategies. One strategy used Google Scholar to search for the keywords ‘contributed equally’ and a specific journal name.
The second strategy searched for the phrase ‘contributed equally’ in individual journal websites. After finding several hundred publications, we compared the results of the two search strategies and found discrepancies. Specifically, the Google Scholar search strategy was returning a higher frequency of male-female (M:F) orderings among those chairing first position than the in journal website search strategy. Inspection of the identified articles revealed that that the Google Scholar search strategy was returning more older papers suggesting a temporal variable to male-female author orderings, a finding that was subsequently confirmed at the conclusion of the study.
The third stage of the study involved adding more papers using both the Google Scholar search and journal website strategies with the searches targeting specific years for those years where few papers were initially identified. The journals selected in this study were chosen because they are widely known in the biomedical sciences: criteria for a journal being well known included sponsorship by a scientific society, a long history of publication and/or a significant journal impact factor (Supplementary file 1).
We note some caveats in the approach to search citations, which can affect the results depending on the method used. Using search engines such as Google Scholar facilitates searches since searching for the words ‘contributed equally’ in journal sites usually identifies many irrelevant publications where these words are in the text of the article. However, using the search engine introduces potential biases depending on how the algorithm prioritizes those publications containing the words ‘contributed equally’. Many of the results from those searches were not usable in this study because they related to shared internal and corresponding author contributions and to the use of the search phrase in the text of the paper. For some publications, authors were listed using first initials and it was not possible to assign gender. We could not reliably assign gender to authors from name alone in approximately 4% of publications. We note that the percentage of gender non-identification in our study compares favorably with the 5, 6 and 17% uncertainties reported in other studies using different methods (van den Besselaar and Sandström, 2017; West et al., 2013; Bendels et al., 2018).
One of the two coauthors inspected each article manually. Determination of author gender was done by searching for images of an individual’s name using the Google search engine, which was adequate to assign gender for 97% of papers examined. Searches were narrowed by including the name of the research institution or research subject among the search words. In many instances, we were able to locate the individual by finding the website for the laboratory producing the paper. For those individuals whose gender could not be identified the major cause for failing identification was the absence of a photograph on the web. For each paper, we recorded the country of origin based on the country of the corresponding author, the gender of individuals sharing the first authorship, the year of publication, and whether the order of authors sharing equal credit was alphabetical. We estimate that the analysis of each entry averaged approximately 5 min, since each publication needed manual inspection to confirm that the search engine was correct and this often necessitated inspecting the PDF version of the publication, as author contributor information was not often available for the online format versions.
At the beginning of this study, the Pubmed database had approximately 25,000,000 million entries. However, given that only 0.8% of all papers in PubMed have first authors that contribute equally (Dubnansky and Omary, 2012), this would reduce the size of the database of interest to approximately 200,000 publications. Hence, our database of 2898 usable publications represents about 1.45% of the available publications in this category. Chi-square analysis used the on-line calculator http://www.socscistatistics.com/tests/chisquare/Default2.aspx
Statistical method
Request a detailed protocolGender bias in first authorship was defined as first male author when all the authors contributed equally. Generalized linear population-average model with binomial distribution and logit link was used to estimate odds ratio of gender bias associated with country of origin and year of publication. The model was estimated using generalized estimating equations (GEE) and robust variance estimates. The analysis accounted for potential correlation among multiple publications by the same journal. The analysis was stratified by the number of authors: two versus more than two. Country of origin was modeled as a categorical variable with two indicator variables in the model and US as the reference category: Europe vs. US and Other vs. US. The publications that included multiple countries, such as European and the US, were classified as US-based. Year of Publication was modeled as a continuous linear term in the model as well as a two-category predictor: 2007–2017 vs 1995–2006. Analysis was performed using STATA version 15, StataCorp. 2017. Stata Statistical Software: Release 15. College Station, Texas: StataCorp LLC.
Data availability
Source data files for all figures have been provided along with the complete raw dataset.
References
-
Gender differences in promotions and scholarly productivity in academic urologyCanadian Journal of Urology 24:9011–9016.
-
MBoC improves recognition of co-first authorsMolecular Biology of the Cell 25:1937.https://doi.org/10.1091/mbc.e14-05-0954
-
Time-to-credit gender inequities of first-year PhD students in the biological sciencesCBE—Life Sciences Education 16:ar4.https://doi.org/10.1187/cbe.16-08-0237
-
Gender differences in scholarly productivity within academic gynecologic oncology departmentsObstetrics & Gynecology 126:1279–1284.https://doi.org/10.1097/AOG.0000000000001133
-
A gender-based comparison of promotion and research productivity in academic dermatologyDermatology Online Journal 22:13030/qt1hx610pf.
-
Sharing of science is most likely among male scientistsScientific Reports 7:12927.https://doi.org/10.1038/s41598-017-13491-0
-
Contributorships are not 'weighable' to be equalTrends in Biochemical Sciences 41:389–390.https://doi.org/10.1016/j.tibs.2016.03.001
-
BookAddressing the Nation's Changing Needs for Biomedical and Behavioral ScientistsWashington, DC: The National Academies Press.
-
Authorship policies of scientific journalsJournal of Medical Ethics 42:199–202.https://doi.org/10.1136/medethics-2015-103171
-
Gender differences in recognition for group workAmerican Economic Review 107:141–145.https://doi.org/10.1257/aer.p20171126
Decision letter
-
Peter A RodgersSenior and Reviewing Editor; eLife, United Kingdom
In the interests of transparency, eLife includes the editorial decision letter and accompanying author responses. A lightly edited version of the letter sent to the authors after peer review is shown, indicating the most substantive concerns; minor comments are not usually included.
Thank you for submitting your article "Disequilibrium in Gender Ratios among Authors who Contributed Equally" to eLife for consideration as a Feature Article. Your article has been reviewed by three peer reviewers, and the following individual involved in review of your submission has agreed to reveal her identity: Sandra Masur (Reviewer #1).
We would like to invite you to submit a revised manuscript that addresses the concerns raised by the reviewers – please see below.
Summary:
The authors assembled a data set of 3035 articles published between 1995 and 2017 in a variety of biomedical journals in which 2 or more authors were indicated as having contributed equally. They assigned genders to authors manually by finding online photos of authors for 97% of papers and compared rates of male first authors versus female first authors in a series of analyses. The authors are to be commended for tackling an important topic. There are, however, concerns about aspects of the study designs and the techniques used to analyse the data (see below). The manuscript also contains a surprising number of simple errors.
Essential revisions:
Study design and methods:
1) The authors refined and changed their hypotheses and analytical plan while examining data. This would be fine if they had treated the preliminary data as a pilot study from which they designed their study. However, they appear to have included the original data in their full data set.
2) The methods for assembling the data set are not well described, and from the available description, they seem far from systematic. Phases 1 and 3 are particularly problematic, especially Phase 3, as this came after the majority of data collection. The authors claim their search methods for Phase 2 were systematic but provide few details of the system used. Such necessary details would include: a) On what basis were journals selected? (The authors note that journals were selected because, "they are widely known in the biomedical sciences." Can they support this statement in any way?)b) Did the authors include all google scholar and journal website search results or only a certain number of articles or pages? c) How did they select included papers? Was this done by a single person (not recommended) or did they use two independent analysts (recommended)? If the latter, what was their kappa score?
The authors may wish to consult standard methods of a systematic review to gain a better understanding of what is typically expected for a search to qualify as systematic. (E.g., see: Cochrane Handbook Chapter 6.4, which is freely available online.)
Inferential statistics:
3) A number of the analyses in the manuscript are, unfortunately, unacceptable. I would suggest that the authors consult with a statistician or epidemiologist to help them consider their analytical options, including relatively simple methods such as logistic regression, or perhaps something like generalized estimating equations, to account for any instances of the same author(s) appearing multiple times. With such analyses, they could then include year of publication in the model. This would allow them to draw much more robust findings and conclusions that would strengthen their paper and the impact of all the work they have clearly put into this manuscript. (In my experience, many researchers in the biomedical sciences are not aware of the statistical services that are available at their own institution, so I include the following links in case that is the case here:https://www.jhsph.edu/research/centers-and-institutes/johns-hopkins-biostatistics-center/services/index.html;https://stat.uconn.edu/consulting-info/)
4) The authors have conducted multiple Chi-squared analyses without accounting for the ensuing inflated potential for Type I error. Also, they do not report the Chi-squared statistic and degrees of freedom, only the p-value.
5) The analyses do not account for overall gender composition of the pool of authors. If we only examine the 2-author papers and assume that each author is unique, there are 2*1000 + 581 + 447 = 3028 male authors compared to 2*377 + 581 + 447 = 1782 female authors. (Please also consult work by Sugimoto and Larivière for systematic analyses of male and female authorship patterns.) Is it really therefore surprising that more papers are led by male authors? The authors refer to the proportion of women trainees (citing reference 19) but provide no citation to support their implication that first authors may reasonably be assumed to be exclusively trainees.
6) The analyses do not account for the same person or people authoring multiple papers. Is this possible in this data set? If yes, this potential clustering effect could have been accounted for had they used a multilevel model for their analyses. See also point 3 above.
7) Changes in authorship credit allocation over time are accounted for in a very crude way by splitting the data set into two sets, dividing at 2007. This is not an appropriate way to account for change over time, and only adds to the problem of multiple hypothesis testing. See also point 3 above.
8) The authors have split the dataset into articles with 2 equally-contributing authors and those with more than 2. Like the time-based split, this is problematic. Do the authors have any basis for assuming that there is a difference between these types of credit-sharing such that they must be analyzed separately?
9) In the Results section, the authors note that they looked at the possibility for alphabetical order in a subsample of 2109 papers. Why this subsample? How was this selected?
10) The authors report a confidence interval in their methods but do not apply it in any way in their presentation of results. More worrisome is that the authors have not accounted for the fact that confidence intervals rely on the assumption that the sample population (i.e., the data analyzed) was sampled randomly from the population. This was emphatically not the case in this study. For this reason, the confidence interval calculation does not apply. (A minor point in relation: I was able to reproduce their estimate of a confidence interval of 2.38 using the website they used by leaving the default setting of 50%, which was not the result in their study. This suggests a potential lack of understanding of how to use these calculations.)
Descriptive statistics:
11) Four out of six continents lack sufficient sample size for it to be valid to look at distribution of shared authorship even descriptively. In addition, presenting these descriptive statistics in equally-sized pie charts inadvertently conveys that each continent has an equivalently-sized subsample in the data set.
Conclusions:
12) The data presented in this paper suggest that any gender bias in author order (which certainly appears to have been a legitimate issue in papers published 1995-2007) is no longer a problem in more recent papers. If this is true, this is excellent news and should be presented as such.
[Editors' note: further revisions were requested prior to acceptance, as described below.]
Thank you for submitting the revised version of your manuscript "Disequilibrium in Gender Ratios among Authors who Contributed Equally". The revised manuscript has been reviewed again by the referee who had the most specific concerns about the statistical analyses employed in the original version (Reviewer #2), and while they welcome many of the changes, they still have a number of concerns that you will need to address (please see below). There are also several editorial points I would like you to address (again, please see below). Although this might seem like a long list (24 points), most of them should be straightforward to address.
Reviewer #2:
The authors have nicely addressed some of my concerns (in particular the statistical analyses are improved-the authors are to be commended for their work to improve the robustness of their conclusions) but some concerns remain, and some minor new concerns arose pertaining to the new analyses. My main concerns remaining have to do with how the statistical analyses are presented.
1) First, for their new analyses, the authors have named their primary outcome variable "gender bias" and defined it as follows: "gender bias in first authorship was defined as first male author when all the authors contributed equally." This is problematic and does not align with how gender bias is defined in other literature. In an ideal world, there would be no gender bias, meaning that the optimal value of a variable named "gender bias" would be zero. Yet, presumably, the authors are not arguing that no man should ever be listed first under conditions of shared first authorship. By naming this variable "gender bias," this is what is currently implied. It would be more understandable to readers (and more in keeping with how this is usually done in studies of sex and gender in humans) to define this variable as something like, 'male author listed first' or perhaps 'm* authorship' in keeping with their notation used elsewhere in the paper. This makes it more intuitive to the reader that the ideal level for this variable is 0.5, not 0.0.
2) Second, it is standard practice to provide a table in the results showing odds ratios and confidence intervals (along with p-values, if one believes those are important, which the authors seem to) for each variable in the model. This would help readers who are familiar with these kinds of statistics more rapidly grasp the findings.
I list these two points first and second because being clearer about how the outcome variable is defined and the odds ratios for each variable in the model could help solve some the following problem.
3) In the Results section, the authors state, "The Odds Ratio of Gender Bias in First Authorship (95% Confidence Interval) using year as a continuous variable was 0.958 (0.931-0.986) with p < 0.01, indicating a significant preference for males in the first position considering all publications from 1995-2017." The statistics presented do not support the authors' statement here. Odds ratios under 1 mean that the outcome is less likely than the reference, not more likely. In other words, the odds ratio presented in this sentence indicates that the variable "gender bias" is less likely than the reference. The authors may want to check with their statistical consultants on this, because based on the raw data presented a few lines up (56% male author first vs. 44% female author first in the n=971 mixed-gender subsample) I would not be surprised to see an odds ratio and 95% confidence interval of 0.958 (0.931-0.986) for female first authorship in that subsample.
4) Re: the alphabetical subset. The authors have added in the manuscript, "This number differs from the larger data set used in the analysis because we began to record alphabetical ordering after the study had begun when we realized this could be an important variable." I appreciate that they have explained why this happened. However, for this to be a complete, robust study, why don't they just quickly go back and record alphabetical or non-alphabetical ordering for the relatively small proportion of early papers (about one quarter of their sample? The fact that they didn't do it at the time doesn't preclude them from doing it now. This is particularly important given the journal's requirement to support replicability. Nowhere in the materials is it clear which papers in the dataset are part of the 2109 for which alphabetical or non-alphabetical order was recorded and which are part of the 787 for which such data were not collected at first glance.
5) More details are needed regarding the data and analyses to ensure replicability. What statistical software (including version) was used? Typically, when writing about statistical analyses, we include the name of the software (e.g., SAS, Stata, SPSS, etc.) or statistical programming environment (R) and version number. This is because the same analyses run in different software could produce slightly different results.
6) Related to the above, is it possible to provide the script or code as an appendix along with the data? This is good practice for ensuring replicability.
7) Results section: The authors state, "Comparing the expected and observed gender ratios yielded a Chi-square statistic of p <0.00.1" A p-value is not a Chi-squared statistic. A Chi-squared statistic would look something like Chi-squared(degrees of freedom)=number like 2.7 or 0.3 or 34.2 or 976.
8) Results section: "estimated 4%" should say "estimated 4% per year" and "1 to 7% decrease" should read "1 to 7% decrease per year."
9) The source data for Figure 2 doesn't appear to match the Figure. The Figure looks like it was plotted using year of publication as a quasi-continuous variable (i.e., there's one point for each year in the data set) while the source data shows year as a categorized variable (pre-2007 and 2007+) along with country/group of countries as a categorized variable.
10) Point 11 noted, "Four out of six continents lack sufficient sample size for it to be valid to look at distribution of shared authorship even descriptively. In addition, presenting these descriptive statistics in equally-sized pie charts inadvertently conveys that each continent has an equivalently-sized subsample in the data set." The authors responded, "We agree with the reviewer's comment. Therefore, in our new analyses, we looked at the country as a three-category predictor: Europe, US and other. The results for these regions matches are comparable suggesting that the trends we are observing are occurring worldwide." The analysis in the revision has addressed this very well and we now have a very nice Figure 5. However, Figure 4 continues to present 6 continents. This means that Figure 4 continues to have the problem of inadvertently conveying equivalency, and, in addition, it now fails to reflect the analyses conducted. I recommend simply removing Figure 4.
11) The original review stated: "16) If grammatically possible, please refer to 'women' or 'female authors' rather than 'females', and 'men' or 'male authors' rather than 'males.'" The authors' response to this was: "Response: Agree. Done." Yet, there are 22 instances in the manuscript of using 'males' or 'females' when it would be completely grammatically possible to refer to 'male authors,' 'men,' 'female authors,' or 'women.' For example, the second sentence in the revised abstract begins, "For mixed gender pairs males were…" A correct rewording of this line would be, "For mixed-gender pairs, male authors were…" It is acceptable to refer to mice as 'males' and 'females' but it is not acceptable to refer to humans in this way in most English-speaking countries, nor in scientific literature describing studies that involve humans as subjects, objects, or participants (e.g., in clinical medicine, social sciences, etc.). Please correct all 22 uses of 'males' and 'females'.
12) Point 16 in the original review noted that in the original Introduction, the authors stated that, "Analysis of articles in 5 medical journals showed that whereas papers listing equal contributions comprised less than 1% of publications in 2000, by 2009 this trend had increased to 3.6-8.6% depending on the journal (8)." In fact, the paper referenced by Akhabue and Lautenbach reports rates from 1.0-8.6% in 2009 in the top 5 general medicine journals. The 1.0% rate is from the BMJ. This means that the rate of co-first authorship in 2009 was 1.0-8.6%, not 3.6-8.6% as claimed by the authors. The change that they made in their revision (removing the reference to the 5 top general medicine journals) has not fixed the problem that their paper makes a claim unsupported by the citation they are using. They need to change 3.6% to 1.0% in order to be accurate.
13) In the file with file name Table 1–source data 1 what does the grey colouring on some rows mean? This should be specified so that anyone aiming to build on or replicate this work can understand the data file.
Editorial points to address:
14) Please consider changing the title to the following:
“Gender Inequalities among Authors who Contributed Equally”
15) Please consider revising the abstract to read as follows:
“We analyzed 2898 scientific papers published in the period 1995-2017 in which two or more authors shared the first author position. For papers in which the first and second authors made equal contributions, mixed gender combinations were most frequent, followed by male-male and then female-female combinations. For the mixed gender combinations, there were more male authors than female authors in the first position, although the disparity was less in the second decade of the period studied. For papers in which three or more authors made equal contributions, there were more male authors than female authors in the first position, and more all-male than all-female combinations. We also show that the disequilibrium in gender ratios among authors who made equal contributions is not consistent with random or alphabetical ordering of these authors. These results raise concerns about female authors not receiving their fair share of credit for scientific papers, and suggest a need for journals to request clarity on the method used to decide author order among those who made equal contributions.”
16a) Please consider replacing the term "disequilibrium in gender ratios" with the term "gender inequalities".
16b) Please consider replacing the terms associations, author associations etc. with the terms combinations, author combinations.
17) Please reword the phrase "the person who does the actual work".
18) Re the sentence that starts: "It is conceivable that some of the disequilibrium in gender ratio in the earlier years…", is it worth mentioning here or somewhere else in the manuscript that, irrespective of the gender breakdown of the science workforce, when considering just those manuscripts with two first authors, one would expect mf to equal fm?
19) Please reword the following sentence to be more precise and/or avoid the word "predominated" (and similar words): "We observed that male-only pairings predominated in author combinations of two or more authors."
20) The sentence "The frequency of multi-author equal contributions dropped rapidly for associations of more than three authors but we observed at least two groupings of 11 authors [Bonham and Stefan, 2017; van den Besselaar and Sandstrom, 2017]." suggest that Bonham and Stefan, 2017 and van den Besselaar and Sandstrom, 2017 have 11 authors, but this is not the case: please clarify.
21) Please move the passage about the limitations caused by the use of Google Scholar ("The approach to search […] in the text of the paper.") to the Materials and methods section, and add a short sentence to the main text stating that this limitation is discussed in the Materials and methods section.
22) Please expand the caption for Figure 2 to better explain to the reader what is shown in this Figure. The revised caption should include a title sentence (in bold). Also, please explain in the caption what the ideal level of this logit function would be. Please also define p(bias).
23) Please expand the caption for Figure 3 to better explain to the reader what is shown in this Figure. The revised caption should include a title sentence (in bold).
24) Please expand the caption for Figure 4 to better explain to the reader what is shown in this Figure. The revised caption should include a title sentence (in bold). Please also explain how these values are predicted.
[Editors' note: further revisions were requested prior to acceptance, as described below.]
I am pleased to inform you that your article, "Gender Inequalities among Authors who Contributed Equally", has been accepted for publication in eLife, subject to addressing a small number of points raised by the referee.
Reviewer #2:
Thank you very much for the opportunity to re-review this paper. The authors have responded extremely well to nearly all my comments, and I believe the paper is substantially improved. There are just a few small corrections remaining:
1. Regarding this passage in the Discussion: “We noted differences between journals in the proportion of pairings…” […]. It's up to the authors, of course, but I think they are underselling their results at this point by calling their findings "preliminary". Also, software for gender identification often uses names as well as, or instead of, images. I would suggest changing, "Hence, our findings should be considered preliminary until confirmed by subsequent studies, which may be able to analyze a larger number of publications across many disciplines through automated searches linked to gender image recognition software," to something like, "Our findings should be complemented by subsequent studies, which may be able to analyze a larger number of publications across many disciplines through automated searches linked to gender recognition software."
2. In discussing their findings in the context of the broader literature, the authors may wish to refer to a similar study published in JAMA, in February 2018, that came across my radar recently: https://www.ncbi.nlm.nih.gov/pmc/articles/PMC5838607/
https://doi.org/10.7554/eLife.36399.024Author response
Essential revisions:
1) The authors refined and changed their hypotheses and analytical plan while examining data. This would be fine if they had treated the preliminary data as a pilot study from which they designed their study. However, they appear to have included the original data in their full data set.
In our new analysis, the data were treated as the reviewer suggested. We removed the preliminary data from analysis (indicated as ‘Initial Search’ in Table 1). We have adjusted the text to reflect how data were handled. The data from the pilot analysis are included in the table, but both figure/table legends and text indicate that they were removed for subsequent statistical testing. The text has been written more clearly in the methods and results to indicate how the data were treated. The removal of those early papers had no effect on the conclusions of the study.
2) The methods for assembling the data set are not well described, and from the available description, they seem far from systematic. Phases 1 and 3 are particularly problematic, especially Phase 3, as this came after the majority of data collection. The authors claim their search methods for Phase 2 were systematic but provide few details of the system used. Such necessary details would include:
a) On what basis were journals selected? (The authors note that journals were selected because, "they are widely known in the biomedical sciences." Can they support this statement in any way?)
These journals were selected because they are prominent in the biomedical sciences and are well known. Many are society journals. To address this point, we have provided impact factor, society sponsoring and date of first publication in Supplemental file 1. In addition, we have added a sentence to the methods explaining why these journals were chosen.
b) Did the authors include all google scholar and journal website search results or only a certain number of articles or pages?
Generally, we limited ourselves to a set number of publications – usually 100 although in some cases we did more. In particular, we went back to include articles from dates ranges that were underrepresented in our initial search to provide adequate representation across time.
c) How did they select included papers? Was this done by a single person (not recommended) or did they use two independent analysts (recommended)? If the latter, what was their kappa score?
All papers discovered were included. Both authors worked to generate the database but analyzed different journals. We cannot calculate a kappa score because both authors took on different journals.
The authors may wish to consult standard methods of a systematic review to gain a better understanding of what is typically expected for a search to qualify as systematic. (E.g., see: Cochrane Handbook Chapter 6.4, which is freely available online.)
We have reviewed the suggested approach in Cochrane Chapter 6.4 (http://handbook-5-1.cochrane.org/chapter_6/6_4_designing_search_strategies.htm). Our study includes many of the suggested steps including random selection of articles etc. However, we agree that when we began the study, we did not set out to do the work with all the recommendations. We feel that our methods remain valid. We have removed the word ‘systematic’ from the text.
3) A number of the analyses in the manuscript are, unfortunately, unacceptable. I would suggest that the authors consult with a statistician or epidemiologist to help them consider their analytical options, including relatively simple methods such as logistic regression, or perhaps something like generalized estimating equations, to account for any instances of the same author(s) appearing multiple times. With such analyses, they could then include year of publication in the model. This would allow them to draw much more robust findings and conclusions that would strengthen their paper and the impact of all the work they have clearly put into this manuscript. (In my experience, many researchers in the biomedical sciences are not aware of the statistical services that are available at their own institution, so I include the following links in case that is the case here:https://www.jhsph.edu/research/centers-and-institutes/johns-hopkins-biostatistics-center/services/index.html;https://stat.uconn.edu/consulting-info/)
We consulted biostatisticians affiliated with the Johns Hopkins Biostatistics Center and they conducted independent statistical analysis, including fitting statistical models to the data. In particular, generalized linear population-average models with binomial distribution and logit link were used to estimate odds ratios of gender bias in first authorship associated with country of origin and year of publication. The model was estimated using generalized estimating equations (GEE) and robust variance estimates. The analysis accounted for potential correlation of multiple publications within the samejournal. The analysis was stratified by the number of authors: two versus more than two. Country was modelled as a categorical variable with 2 indicator variables in the model and US as the reference category: Europe vs. US and Other vs. US. The publications that included multiple countries, such as European and the US, were classified as US-based. Year of Publication was modelled as a continuous linear term in the model as well as a two-category predictor: 2007-2017 vs 1995-2006, based on exploratory analysis of the data. The statistical method section of the paper has been updated accordingly.
4) The authors have conducted multiple Chi-squared analyses without accounting for the ensuing inflated potential for Type I error. Also, they do not report the Chi-squared statistic and degrees of freedom, only the p-value.
The analytic approach has been updated. We primarily present the results of generalized linear population-average models with GEE that show estimated odds ratios of gender-bias associated with the primary predictors: year of publication and country, after accounting for potential clustering by journal. We also show two chi-square goodness-of-fit tests: one for two-author and another for more than two-author publications. The results are as follows: for two-author publications, chi-square statistic is 15.1 (with 1 degree of freedom) and p-value < 0.001. For more than two-author publications, chi-square statistic is 7.77 (with 1 degree of freedom) and p-value = 0.005. We did not adjust for multiple testing due to preliminary nature of these analyses. However, even if highly conservative Bonferroni adjustment is applied, these results will still be significant at 0.05/2 level of statistical significance.
5) The analyses do not account for overall gender composition of the pool of authors. If we only examine the 2-author papers and assume that each author is unique, there are 2*1000 + 581 + 447 = 3028 male authors compared to 2*377 + 581 + 447 = 1782 female authors. (Please also consult work by Sugimoto and Larivière for systematic analyses of male and female authorship patterns.) Is it really therefore surprising that more papers are led by male authors? The authors refer to the proportion of women trainees (citing reference 19) but provide no citation to support their implication that first authors may reasonably be assumed to be exclusively trainees.
We agree that the number of authors can potentially confound our analyses. We accounted for this variable by stratifying the analyses into 2 categories: two- vs. more than two-author publications. In addition, the results of the goodness-of-fit test suggest that based on the observed distribution we reject the null hypothesis of equal split between male- vs. female first author publications at 0.05 level of statistical significance.
6) The analyses do not account for the same person or people authoring multiple papers. Is this possible in this data set? If yes, this potential clustering effect could have been accounted for had they used a multilevel model for their analyses. See also point 3 above.
We did not find instances of the same author combination authoring multiple papers.
7) Changes in authorship credit allocation over time are accounted for in a very crude way by splitting the data set into two sets, dividing at 2007. This is not an appropriate way to account for change over time, and only adds to the problem of multiple hypothesis testing. See also point 3 above.
In our new analyses, we explored the relationship between the logit of gender bias and year of publication. The results suggest that the logit of probability decreases almost linearly until about year 2007-2008, after which it is rather stable, see Figure 2. Therefore, Year of Publication was modelled in two different ways: as a continuous and a categorical variable in two different models. In the paper, we report the estimated odds ratio of gender bias per additional year and comparing 2007+ vs 1995-2006.
8) The authors have split the dataset into articles with 2 equally-contributing authors and those with more than 2. Like the time-based split, this is problematic. Do the authors have any basis for assuming that there is a difference between these types of credit-sharing such that they must be analyzed separately?
In the biological sciences first authorship is considered the most important position. The importance of contributions declines with author order such that the second is generally considered to have contributed more than the third. The last position is usually reserved for the senior author. We focused only on multiple authors sharing the first author position. We felt that first author designation decisions might be done differently depending on whether there are only 2 authors versus if there are more than two authors with different gender composition. However, since there were many more two author publications N = 2,348 vs. more than two-author publications, n = 491, we could not adjust for this variable as a continuous predictor in the model. Therefore, instead we decided to divide the publications into 2 categories: two- vs. more than two authors and stratify our analyses by this variable.
9) In the Results section, the authors note that they looked at the possibility for alphabetical order in a subsample of 2109 papers. Why this subsample? How was this selected?
Frankly, the decision to include alphabetical information was done as the two authors were collecting data and so the subsample is dependent on date (meaning that once we decided to begin recording that information it was continues for the remainder of the 2109 papers we examined).
10) The authors report a confidence interval in their methods but do not apply it in any way in their presentation of results. More worrisome is that the authors have not accounted for the fact that confidence intervals rely on the assumption that the sample population (i.e., the data analyzed) was sampled randomly from the population. This was emphatically not the case in this study. For this reason, the confidence interval calculation does not apply. (A minor point in relation: I was able to reproduce their estimate of a confidence interval of 2.38 using the website they used by leaving the default setting of 50%, which was not the result in their study. This suggests a potential lack of understanding of how to use these calculations.)
We agree with the reviewer and have removed the sample size calculation since our sample was not truly random and the formalism requires this criteria for the calculation.
11) Four out of six continents lack sufficient sample size for it to be valid to look at distribution of shared authorship even descriptively. In addition, presenting these descriptive statistics in equally-sized pie charts inadvertently conveys that each continent has an equivalently-sized subsample in the data set.
We agree with the reviewer’s comment. Therefore, in our new analyses, we looked at the country as a three-category predictor: Europe, US and other. The results for these regions matches are comparable suggesting that the trends we are observing are occurring worldwide.
12) The data presented in this paper suggest that any gender bias in author order (which certainly appears to have been a legitimate issue in papers published 1995-2007) is no longer a problem in more recent papers. If this is true, this is excellent news and should be presented as such.
We agree that the trends are in the right direction and that this excellent news. However, since the effect of publication on a scientific career can be lifelong we worry that imbalances that occurred even a decade ago would be felt in the present as these individuals progressed through promotion, etc. We have rewritten the Discussion section to make the conclusion clearer. However, the presented results should be interpreted in light of the limitations of our approach, which we also state in the Discussion section.
[Editors' note: further revisions were requested prior to acceptance, as described below.]
Thank you for submitting the revised version of your manuscript "Disequilibrium in Gender Ratios among Authors who Contributed Equally". The revised manuscript has been reviewed again by the referee who had the most specific concerns about the statistical analyses employed in the original version, and while they welcome many of the changes, they still have a number of concerns that you will need to address (please see below). There are also several editorial points I would like you to address (again, please see below). Although this might seem like a long list (24 points), most of them should be straightforward to address.
Reviewer #2:
The authors have nicely addressed some of my concerns (in particular the statistical analyses are improved-the authors are to be commended for their work to improve the robustness of their conclusions) but some concerns remain, and some minor new concerns arose pertaining to the new analyses. My main concerns remaining have to do with how the statistical analyses are presented.
1) First, for their new analyses, the authors have named their primary outcome variable "gender bias" and defined it as follows: "gender bias in first authorship was defined as first male author when all the authors contributed equally." This is problematic and does not align with how gender bias is defined in other literature. In an ideal world, there would be no gender bias, meaning that the optimal value of a variable named "gender bias" would be zero. Yet, presumably, the authors are not arguing that no man should ever be listed first under conditions of shared first authorship. By naming this variable "gender bias," this is what is currently implied. It would be more understandable to readers (and more in keeping with how this is usually done in studies of sex and gender in humans) to define this variable as something like, 'male author listed first' or perhaps 'm* authorship' in keeping with their notation used elsewhere in the paper. This makes it more intuitive to the reader that the ideal level for this variable is 0.5, not 0.0.
Change as requested. Interpretation is still discussed as bias if realized occurs greater than expected by pure chance.
2) Second, it is standard practice to provide a table in the results showing odds ratios and confidence intervals (along with p-values, if one believes those are important, which the authors seem to) for each variable in the model. This would help readers who are familiar with these kinds of statistics more rapidly grasp the findings.
Statistical information described above is provided in source files associated with figures and also presented where applicable in the text and figure legends.
I list these two points first and second because being clearer about how the outcome variable is defined and the odds ratios for each variable in the model could help solve some the following problem.
3) In the Results section, the authors state, "The Odds Ratio of Gender Bias in First Authorship (95% Confidence Interval) using year as a continuous variable was 0.958 (0.931-0.986) with p < 0.01, indicating a significant preference for males in the first position considering all publications from 1995-2017." The statistics presented do not support the authors' statement here. Odds ratios under 1 mean that the outcome is less likely than the reference, not more likely. In other words, the odds ratio presented in this sentence indicates that the variable "gender bias" is less likely than the reference. The authors may want to check with their statistical consultants on this, because based on the raw data presented a few lines up (56% male author first vs. 44% female author first in the n=971 mixed-gender subsample) I would not be surprised to see an odds ratio and 95% confidence interval of 0.958 (0.931-0.986) for female first authorship in that subsample.
Yes, this was a miscommunication – since the outcome variable is “bias” defined as first male author among two-, equally contributing author papers, an odds ratio below 1 indicates that with each year the odds of gender bias go down by an estimated 4.2% (95% CI: from 1.4% to 6.9% decline in odds per year). This estimate is adjusted for country of origin.
4) Re: the alphabetical subset. The authors have added in the manuscript, "This number differs from the larger data set used in the analysis because we began to record alphabetical ordering after the study had begun when we realized this could be an important variable." I appreciate that they have explained why this happened. However, for this to be a complete, robust study, why don't they just quickly go back and record alphabetical or non-alphabetical ordering for the relatively small proportion of early papers (about one quarter of their sample? The fact that they didn't do it at the time doesn't preclude them from doing it now. This is particularly important given the journal's requirement to support replicability. Nowhere in the materials is it clear which papers in the dataset are part of the 2109 for which alphabetical or non-alphabetical order was recorded and which are part of the 787 for which such data were not collected at first glance.
Done. We went through the entire database and collected author alphabetical information for all entries. Updated Supplementary file 1 has all the alphabetical information. Numbers in the text were adjusted accordingly.
5) More details are needed regarding the data and analyses to ensure replicability. What statistical software (including version) was used? Typically, when writing about statistical analyses, we include the name of the software (e.g., SAS, Stata, SPSS, etc.) or statistical programming environment (R) and version number. This is because the same analyses run in different software could produce slightly different results.
We added a reference to the statistical software program that was used to perform the analyses (STATA version 15, StataCorp. 2017. Stata Statistical Software: Release 15. College Station, TX: StataCorp LLC).
6) Related to the above, is it possible to provide the script or code as an appendix along with the data? This is good practice for ensuring replicability.
The log file and the STATA do.file are now included as source files.
7) Results section: The authors state, "Comparing the expected and observed gender ratios yielded a Chi-square statistic of p <0.00.1" A p-value is not a Chi-squared statistic. A Chi-squared statistic would look something like Chi-squared(degrees of freedom)=number like 2.7 or 0.3 or 34.2 or 976.
Chi-squared statistic added. The Chi-squared statistic with 1 degree of freedom is 15.1.
8) Results section: "estimated 4%" should say "estimated 4% per year" and "1 to 7% decrease" should read "1 to 7% decrease per year."
Done as suggested.
9) The source data for Figure 2 doesn't appear to match the Figure. The Figure looks like it was plotted using year of publication as a quasi-continuous variable (i.e., there's one point for each year in the data set) while the source data shows year as a categorized variable (pre-2007 and 2007+) along with country/group of countries as a categorized variable.
We corrected the link to Figure 2–source data 1. Previously linked file was in error and should have been linked to Figure 5. Figure 5– source data 1are predicted probabilities from the generalized linear population average model with Binomial distribution, logit link, and robust variance estimate estimated using Generalized Estimating Equations (GEE) with bias as the outcome and publication year and country as predictors. In this model “bias” is defined as first male author among two equally contributing authors of both genders.
10) Point 11 noted, "Four out of six continents lack sufficient sample size for it to be valid to look at distribution of shared authorship even descriptively. In addition, presenting these descriptive statistics in equally-sized pie charts inadvertently conveys that each continent has an equivalently-sized subsample in the data set." The authors responded, "We agree with the reviewer's comment. Therefore, in our new analyses, we looked at the country as a three-category predictor: Europe, US and other. The results for these regions match are comparable suggesting that the trends we are observing are occurring worldwide." The analysis in the revision has addressed this very well and we now have a very nice Figure 5. However, Figure 4 continues to present 6 continents. This means that Figure 4 continues to have the problem of inadvertently conveying equivalency, and, in addition, it now fails to reflect the analyses conducted. I recommend simply removing Figure 4.
Figure 4 removed as recommended by the reviewer.
11) The original review stated: "16. If grammatically possible, please refer to 'women' or 'female authors' rather than 'females', and 'men' or 'male authors' rather than 'males.'" The authors' response to this was: "Response: Agree. Done." Yet, there are 22 instances in the manuscript of using 'males' or 'females' when it would be completely grammatically possible to refer to 'male authors,' 'men,' 'female authors,' or 'women.' For example, the second sentence in the revised abstract begins, "For mixed gender pairs males were…" A correct rewording of this line would be, "For mixed-gender pairs, male authors were…" It is acceptable to refer to mice as 'males' and 'females' but it is not acceptable to refer to humans in this way in most English-speaking countries, nor in scientific literature describing studies that involve humans as subjects, objects, or participants (e.g., in clinical medicine, social sciences, etc.) Please correct all 22 uses of 'males' and 'females'.
Sorry about this. It was an oversight on our part as we thought we had changed all the ‘males’ and ‘females’. In the revised version all have been corrected.
12) Point 16 in the original review noted that in the original Introduction, the authors stated that, "Analysis of articles in 5 medical journals showed that whereas papers listing equal contributions comprised less than 1% of publications in 2000, by 2009 this trend had increased to 3.6-8.6% depending on the journal (8)." In fact, the paper referenced by Akhabue and Lautenbach reports rates from 1.0-8.6% in 2009 in the top 5 general medicine journals. The 1.0% rate is from the BMJ. This means that the rate of co-first authorship in 2009 was 1.0-8.6%, not 3.6-8.6% as claimed by the authors. The change that they made in their revision (removing the reference to the 5 top general medicine journals) has not fixed the problem that their paper makes a claim unsupported by the citation they are using. They need to change 3.6% to 1.0% in order to be accurate.
Done as suggested. Text now states 1.0-8.6%.
13) In the file with file name Table 1–source data 1 what does the grey colouring on some rows mean? This should be specified so that anyone aiming to build on or replicate this work can understand the data file.
Grey lines indicate the papers for which gender identification was not able to be determined, this has been indicated in the legend.
14) Please consider changing the title to the following:
“Gender Inequalities among Authors who Contributed Equally”
Done.
15) Please consider revising the abstract to read as follows:
“We analyzed 2898 scientific papers published in the period 1995-2017 in which two or more authors shared the first author position. For papers in which the first and second authors made equal contributions, mixed gender combinations were most frequent, followed by male-male and then female-female combinations. For the mixed gender combinations, there were more male authors than female authors in the first position, although the disparity was less in the second decade of the period studied. For papers in which three or more authors made equal contributions, there were more male authors than female authors in the first position, and more all-male than all-female combinations. We also show that the disequilibrium in gender ratios among authors who made equal contributions is not consistent with random or alphabetical ordering of these authors. These results raise concerns about female authors not receiving their fair share of credit for scientific papers, and suggest a need for journals to request clarity on the method used to decide author order among those who made equal contributions.”
Done, as suggested. We inserted the suggested abstract wording verbatim except for the phrase ‘disequilibrium in gender ratios’ since point 16 below recommends changing this wording. We also modified some ‘male’ to ‘male authors’ as recommended by reviewer 2, point 11.
16a) Please consider replacing the term "disequilibrium in gender ratios" with the term "gender inequalities".
Done as suggested.
16b) Please consider replacing the terms associations, author associations etc. with the terms combinations, author combinations.
Done as suggested.
17) Please reword the phrase "the person who does the actual work"
Done.
18) Re the sentence that starts: "It is conceivable that some of the disequilibrium in gender ratio in the earlier years…", is it worth mentioning here or somewhere else in the manuscript that, irrespective of the gender breakdown of the science workforce, when considering just those manuscripts with two first authors, one would expect mf to equal fm?
Sentence was rephrased.
19) Please reword the following sentence to be more precise and/or avoid the word "predominated" (and similar words): "We observed that male-only pairings predominated in author combinations of two or more authors."
Sentence was rephrased.
20) The sentence "The frequency of multi-author equal contributions dropped rapidly for associations of more than three authors but we observed at least two groupings of 11 authors [Bonham and Stefan, 2017; van den Besselaar, Sandstrom, 2017]." suggest that Bonham and Stefan, 2017 and van den Besselaar and Sandstrom, 2017 have 11 authors, but this is not the case: please clarify.
The references have been corrected. New references Massen et al., 2017 and Bendals et al., 2018 each lists 11 authors sharing the first position.
21) Please move the passage about the limitations caused by the use of Google Scholar ("The approach to search […] in the text of the paper.") to the Materials and methods section, and add a short sentence to the main text stating that this limitation is discussed in the Materials and methods section.
Done.
22) Please expand the caption for Figure 2 to better explain to the reader what is shown in this Figure. The revised caption should include a title sentence (in bold). Also, please explain in the caption what the ideal level of this logit function would be. Please also define p(bias).
Done.
23) Please expand the caption for Figure 3 to better explain to the reader what is shown in this Figure. The revised caption should include a title sentence (in bold).
Done.
24) Please expand the caption for Figure 4 to better explain to the reader what is shown in this Figure. The revised caption should include a title sentence (in bold). Please also explain how these values are predicted.
Figure 4 was removed as per the suggestion of reviewer 2.
[Editors' note: further revisions were requested prior to acceptance, as described below.]
Reviewer #2:
Thank you very much for the opportunity to re-review this paper. The authors have responded extremely well to nearly all my comments, and I believe the paper is substantially improved. There are just a few small corrections remaining:
1. Regarding this passage in the Discussion: “We noted differences between journals in the proportion of pairings…” […]. It's up to the authors, of course, but I think they are underselling their results at this point by calling their findings "preliminary". Also, software for gender identification often uses names as well as, or instead of, images. I would suggest changing, "Hence, our findings should be considered preliminary until confirmed by subsequent studies, which may be able to analyze a larger number of publications across many disciplines through automated searches linked to gender image recognition software," to something like, "Our findings should be complemented by subsequent studies, which may be able to analyze a larger number of publications across many disciplines through automated searches linked to gender recognition software."
2. In discussing their findings in the context of the broader literature, the authors may wish to refer to a similar study published in JAMA, in February 2018, that came across my radar recently: https://www.ncbi.nlm.nih.gov/pmc/articles/PMC5838607/
We appreciate the comment about underselling the results and amended the text as suggested. We also incorporated the recent study above within this context, since this study had similar results using both out method and some additional databases. The relevant text now reads:
“In this regard, a recent study that examined papers from 2005-2014 with co-first authors of different genders using online databases in addition to our method of website images, found that while there was no difference in female versus male authors in the first position among basic science journals, consistent with our results (Aakhus et al., 2018). However, they found that female co-first authors were less represented in the first position among clinical journal. As such, our finding that a disequilibrium exists…”
https://doi.org/10.7554/eLife.36399.025Article and author information
Author details
Nichole A Broderick

Funding
Johns Hopkins Bloomberg School of Public Health
- Arturo Casadevall
University of Connecticut
- Nichole A Broderick
The funders had no role in study design, data collection and interpretation, or the decision to submit the work for publication.
Acknowledgements
We are very grateful to Ms Abanti Sanyal and Dr Gayane Yenokyan of the Johns Hopkins Biostatistics Center for statistical analysis and advice on revising this paper.
Publication history
- Received: March 5, 2018
- Accepted: January 9, 2019
- Version of Record published: January 30, 2019 (version 1)
Copyright
© 2019, Broderick and Casadevall
This article is distributed under the terms of the Creative Commons Attribution License, which permits unrestricted use and redistribution provided that the original author and source are credited.
Metrics
-
- 10,471
- Page views
-
- 516
- Downloads
-
- 54
- Citations
Article citation count generated by polling the highest count across the following sources: Scopus, Crossref, PubMed Central.
Download links
A two-part list of links to download the article, or parts of the article, in various formats.
Downloads (link to download the article as PDF)
Open citations (links to open the citations from this article in various online reference manager services)
Cite this article (links to download the citations from this article in formats compatible with various reference manager tools)
Meta-Research: Gender inequalities among authors who contributed equally
eLife 8:e36399.
https://doi.org/10.7554/eLife.36399

Further reading
-
The research community needs to do more to support scientists from underrepresented groups.
-
In a paper with several joint first authors, male authors are more likely than female ones to appear first.


