Global Monitoring of Water Supply and Sanitation: History, Methods and Future Challenges

 ,
,
Abstract
:1. Introduction

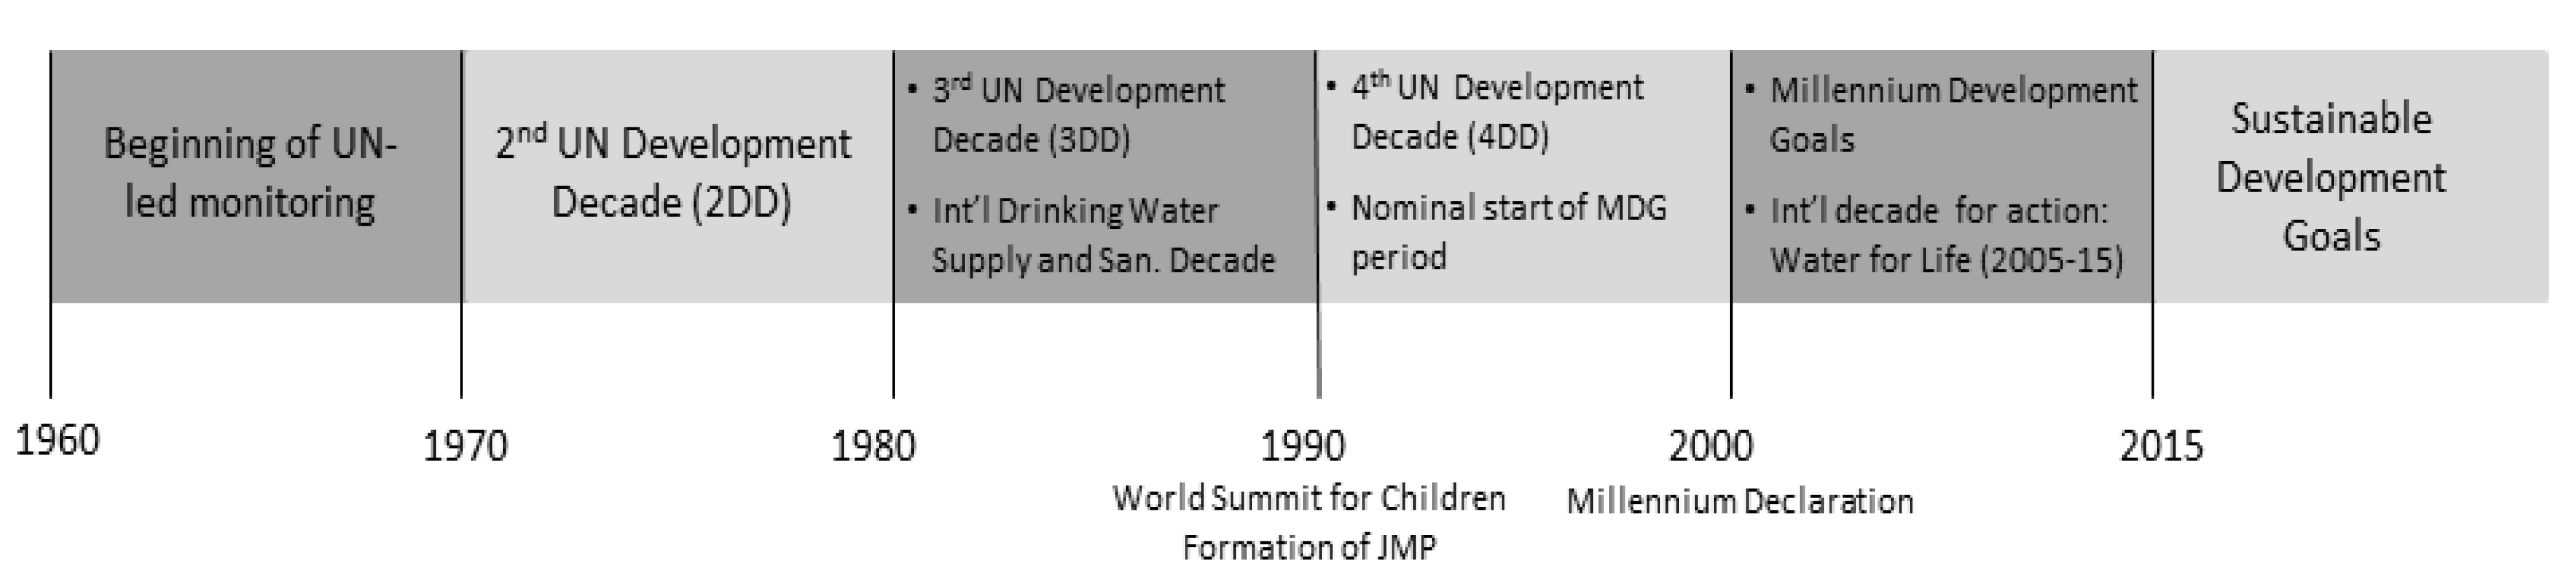
2. Background
2.1. History of International Drinking Water and Sanitation Monitoring

| (1a) Drinking Water | ||
| Drinking water core questions (1) | ||
| What is the main source of drinking water for members of your household? Where is that water source located? How long does it take to go there, get water, and come back? Who usually goes to this source to collect the water for your household? Do you do anything to the water to make it safer to drink? (Introduced 2005) What do you usually do to make the water safer to drink? (Introduced 2005) | ||
| MDG Categorisation of Households (2) | JMP Disaggregated Categorisation of Households | Underlying Questionnaire Responses |
| Not using an improved drinking water source | Collection of water from a surface water source | Surface water (river, dam, lake, pond, stream, canal, irrigation channel) |
| “Other unimproved sources” | Unprotected dug well Unprotected spring Cart with small tank or drum Tanker truck (3) Bottled water where other water source is classified as unimproved (4) | |
| Piped drinking water into dwelling, plot or yard | Piped water into dwelling, yard or plot | |
| (1b) Sanitation | ||
| Sanitation core questions (1) | ||
| What kind of toilet facility do members of your household usually use? Do you share this facility with others who are not members of your household? With how many households do you share this facility? The last time (Name of Child U5) passed stools, what was done to dispose of the stools? | ||
| MDG Categorisation of Households (2) | JMP Disaggregated Categorisation of Households | Underlying Questionnaire Responses |
| Not using improved sanitation | open defecation | No facilities, bush or field, open water bodies(open defecation) |
| Unimproved | Flush or pour-flush to elsewhere (that is, not to piped sewer system, septic tank or pit latrine) Pit latrine without slab, or open pit Bucket Hanging toilet or hanging latrine | |
| Shared use of a facility otherwise classified as ‘improved’ | Use of facilities listed below where shared by more than one household | |
| Using improved sanitation | Improved sanitation | Flush or pour-flush to piped sewer or septic tank or latrine pit Ventilated improved pit (VIP) latrine Pit latrine with slab Composting toilet |
| (1c) Hygiene | ||
| Hygiene core question (5) | ||
| Can you please show me where members of your household most often wash their hands? (Observe presence of soap, water) Do you have any soap or detergent (or other locally used cleansing agent) in your household for washing hands? (MICS only) | ||
| MDG Categorisation of Households (2) | JMP Disaggregated Categorisation of Households | Underlying Questionnaire Responses |
| Using adequate hygiene | Adequate hygiene supplies | Presence of soap and water for handwashing |
| Not using adequate hygiene | Inadequate hygiene supplies | Absence of soap, water, or both in handwashing process |
2.2. International Targets and Agreements on Drinking Water and Sanitation
- The original wording addressed only drinking water; sanitation was added to the target after the 2002 World Summit for Sustainable Development [28].
- Reference to “sustainable access” was edited in and out and eventually retained.
- The formulation of “halving the proportion of the un-served” was consistently used.
2.3. Use of International Drinking Water and Sanitation Monitoring Data
3. Methods
3.1. Sampling and Data Collection Methods
| Survey or Data Source | Supported By (1) | Initiated (Year) | Total Number of Surveys in JMP Database (to End–2012) | Scale | Source Reference for Method Description |
|---|---|---|---|---|---|
| Demographic and Health Surveys (DHS) | USAID | 1985 | 259 | Conducted in 7000—30,000 households in each of 85–90 countries, typically at 5 year intervals, more frequently in some countries | [70] |
| Multiple Indicator Cluster Surveys (MICS) | UNICEF | 1995 | 172 | Conducted in 5000—15,000 households in each of 85–90 countries initially at 5-year intervals now at 3-year intervals | [64] |
| World Health Surveys (WHS) | World Health Organization | One round in 2003; Beginning in 2010, WHO initiated Study on global Ageing and adult health (SAGE, [71]) considered to be the second round of WHS | 45 surveys in the developing countries with WASH data | Conducted in 5000–15,000 households | [72] |
| Living Standards Measurement Study (LSMS) | World Bank | 1985 | 80 | Approximately 5 surveys per year across 36 developing countries | [73] |
| National censuses | Variable | n/a | 252 | Every 5–10 years; most censuses target all households | [74] |
| Other household surveys | Variable | n/a | 655 | Variable | Following similar methodology as DHS and MICS above |
| Developed country coverage reports | National authorities, often the line ministries, validated by national statistical offices | n/a | 334 | Usually conducted yearly | n/a |
3.2. Categorisation of Households by Drinking Water and Sanitation Facilities Used
| Survey/Census Class | JMP Classes | Countries and Territories for Which One or More Surveys Have Been Adjusted |
|---|---|---|
| Well | Protected well Unprotected well | 106 |
| Spring | Protected spring Unprotected spring | 80 |
| Piped water | Piped into dwelling, plot or yard Public tap or standpipe | 53 |
| Traditional latrine Latrine Pit latrine Pit Simple pit Shallow pit | Pit latrine with slab Pit latrine without slab Ventilated pit latrine Open pit | 112 |
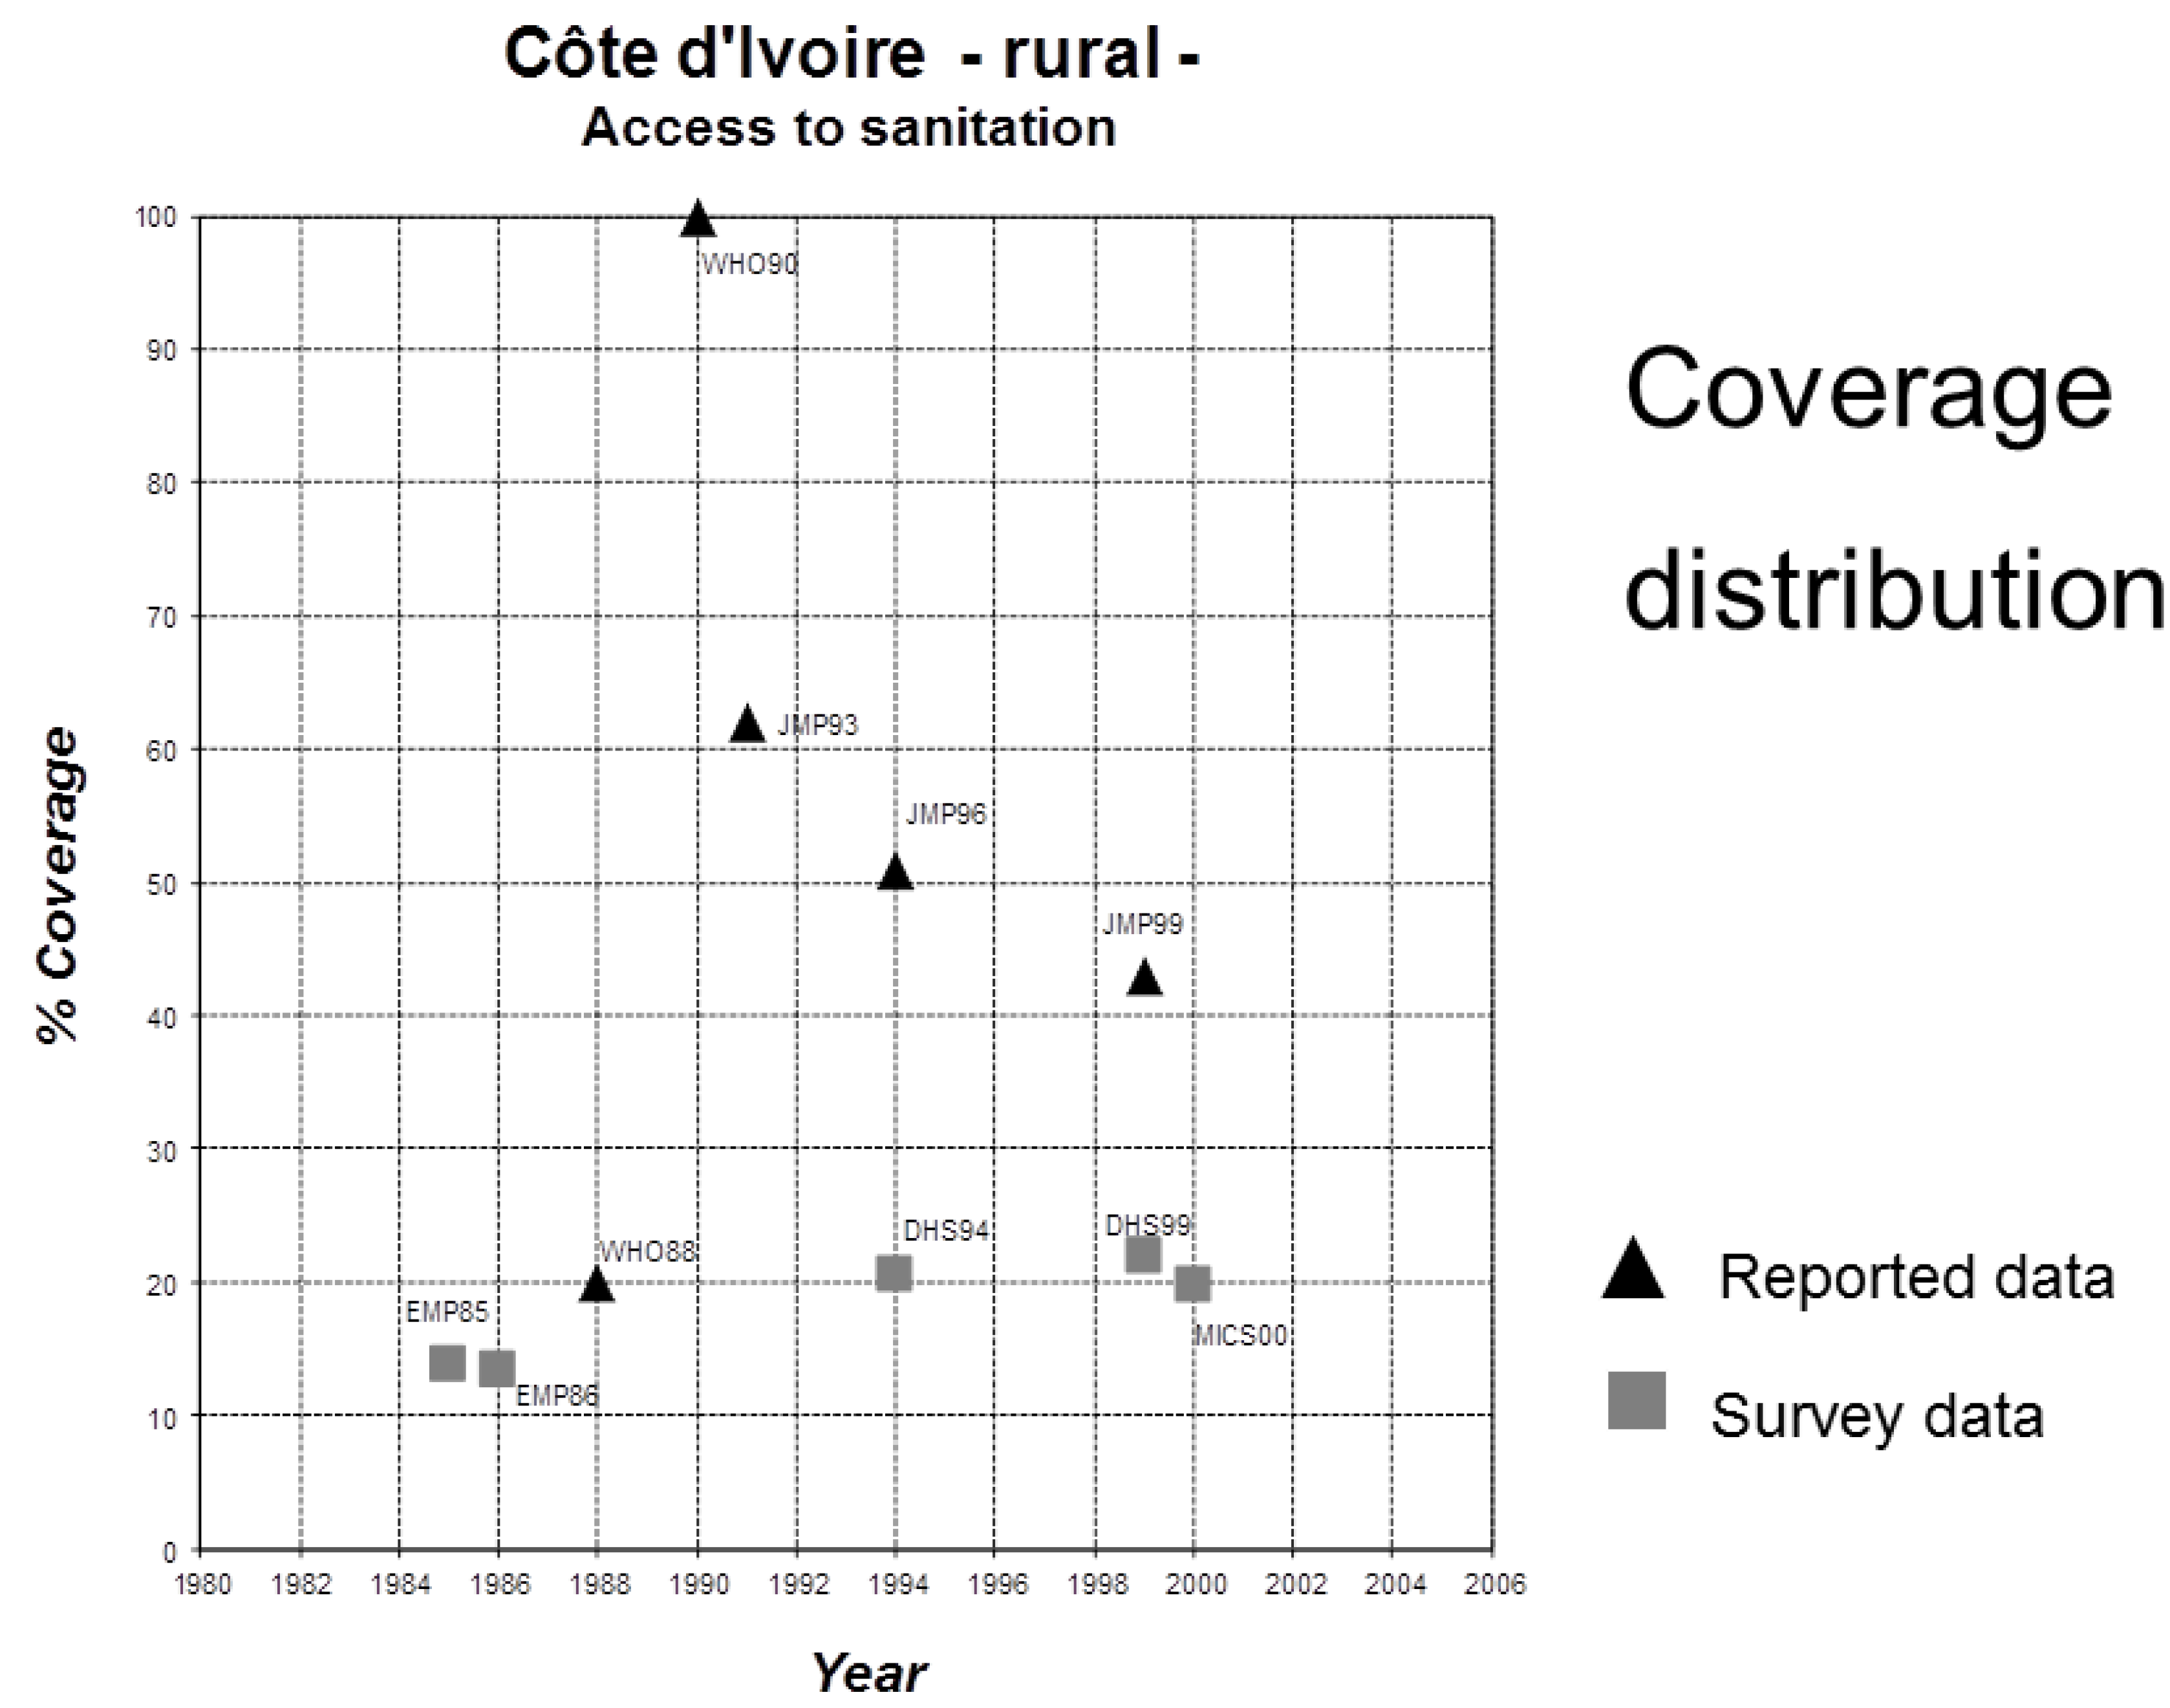
3.3. Statistical Analysis of Data to Estimate Status and Identify Trends

4. Reporting
| Reporting Year | Use of Improved Drinking Water | Use of Basic Sanitation | ||||
|---|---|---|---|---|---|---|
| 1990 Baseline | 2015 Target | 1990 Baseline | 2015 Target | |||
| With Access | Without Access | With Access | Without Access | |||
| 2000 | 79 | 21 | 11 | 55 | 45 | 23 |
| 2004 | 77 | 23 | 12 | 49 | 51 | 26 |
| 2006 | 78 | 22 | 11 | 49 | 51 | 26 |
| 2008 | 77 | 23 | 12 | 54 | 46 | 23 |
| 2010 | 77 | 23 | 12 | 54 | 46 | 23 |
| 2012 | 76 | 24 | 12 | 49 | 51 | 26 |
| 2013 | 76 | 24 | 12 | 49 | 51 | 26 |
| 2014 | 76 | 24 | 12 | 49 | 51 | 26 |
5. Evolution of the JMP Method
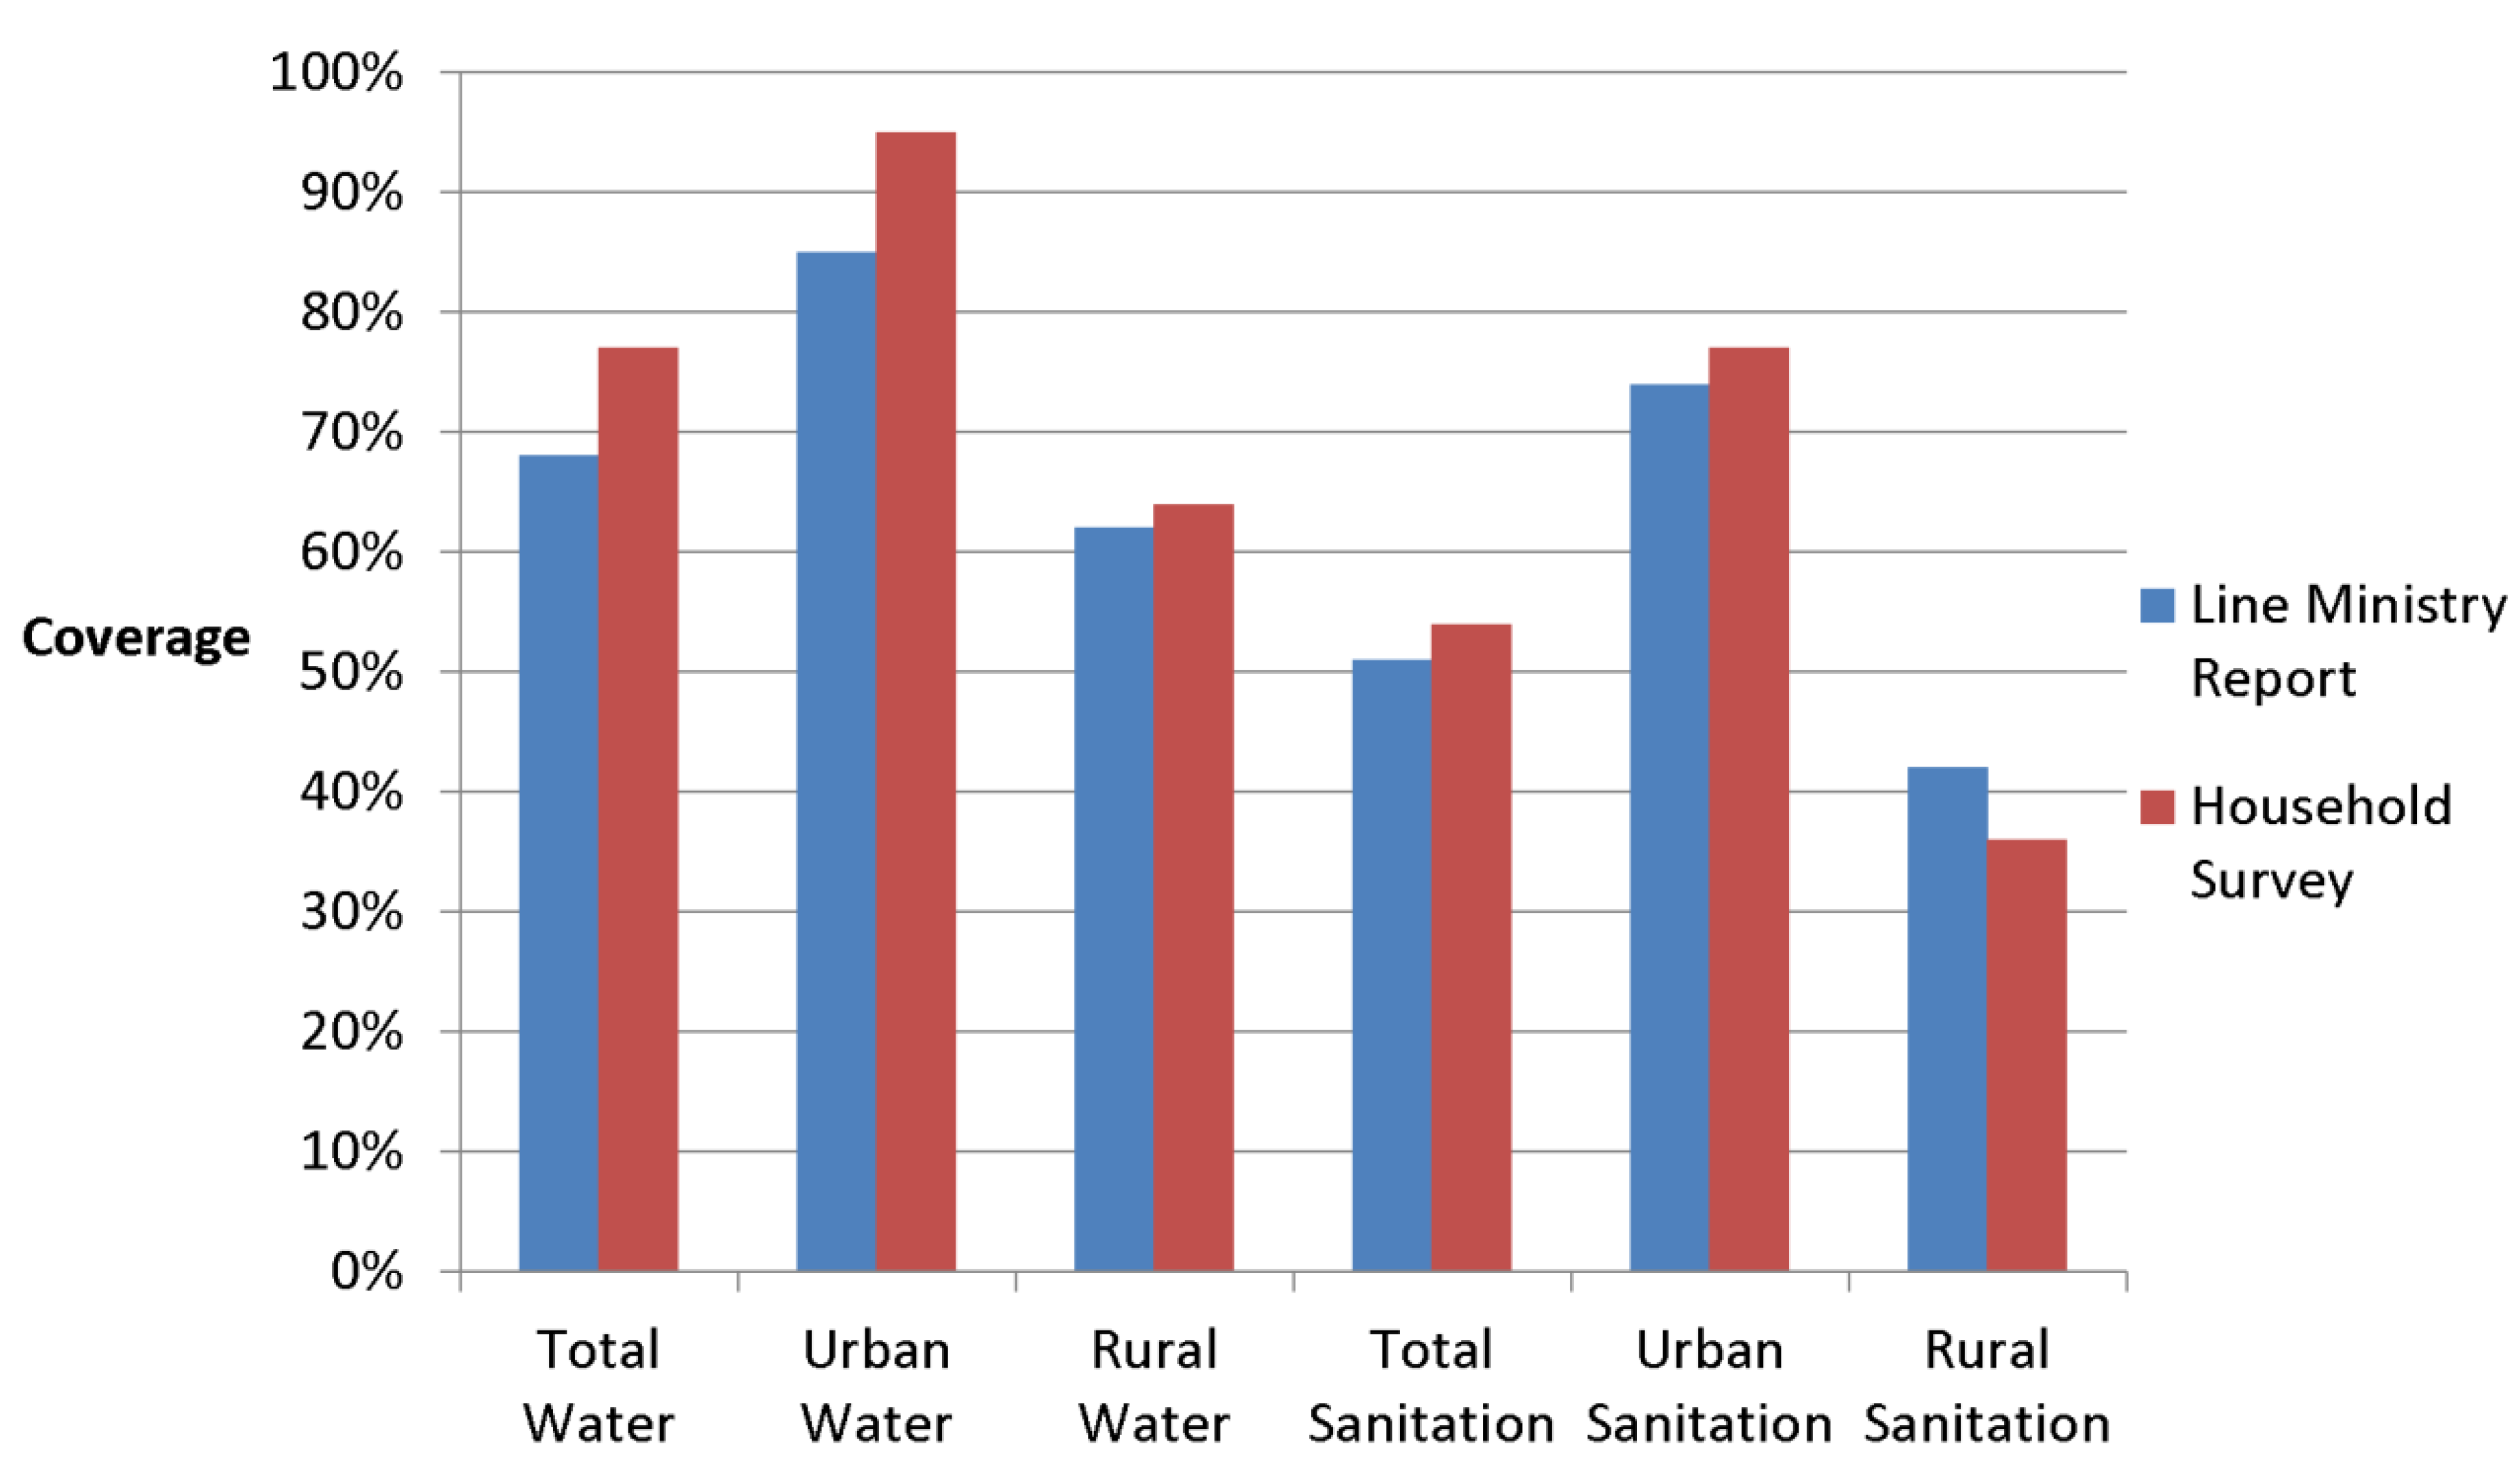
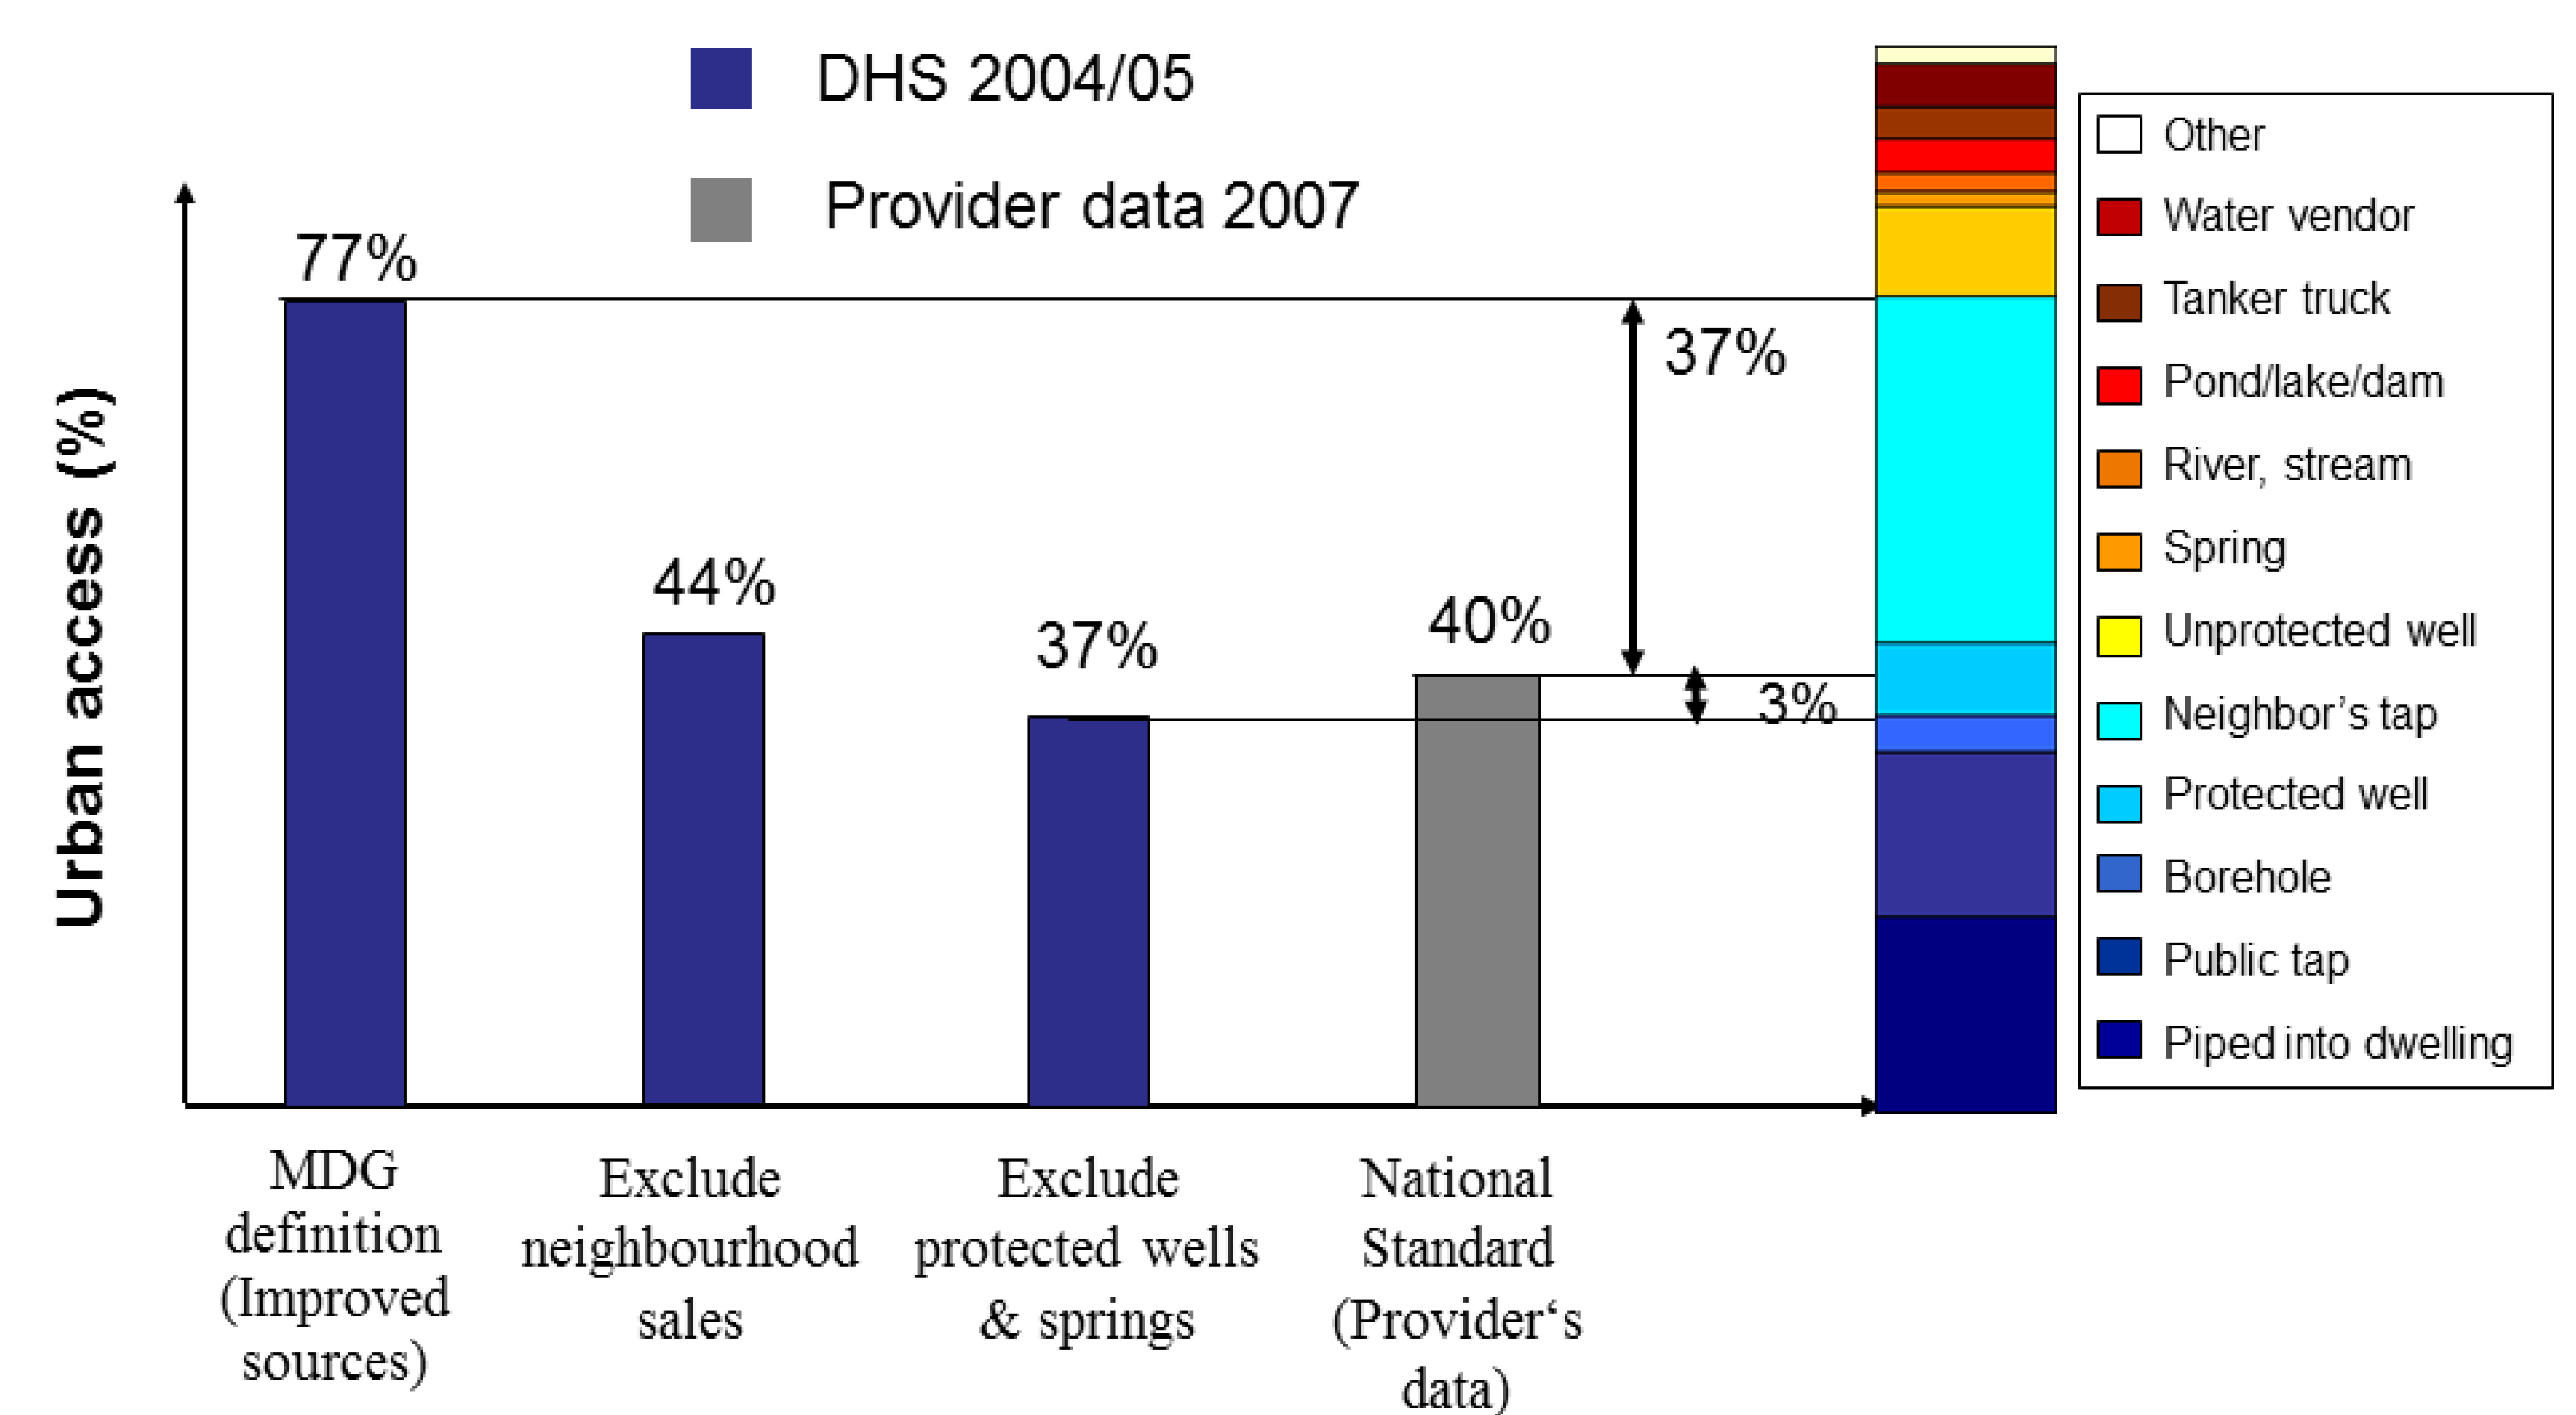
5.1. Change from Provider to User Orientation

| Data Type | Rural | Urban | ||
|---|---|---|---|---|
| Line Ministry Reporting (1) | Household Survey Based (2) | Line Ministry Reporting (1) | Household Survey Based (2) | |
| Water | 68% | 62% | 85% | 95% |
| Sanitation | 51% | 28% | 74% | 76% |

5.2. Standardisation of Survey Questions on Drinking Water and Sanitation
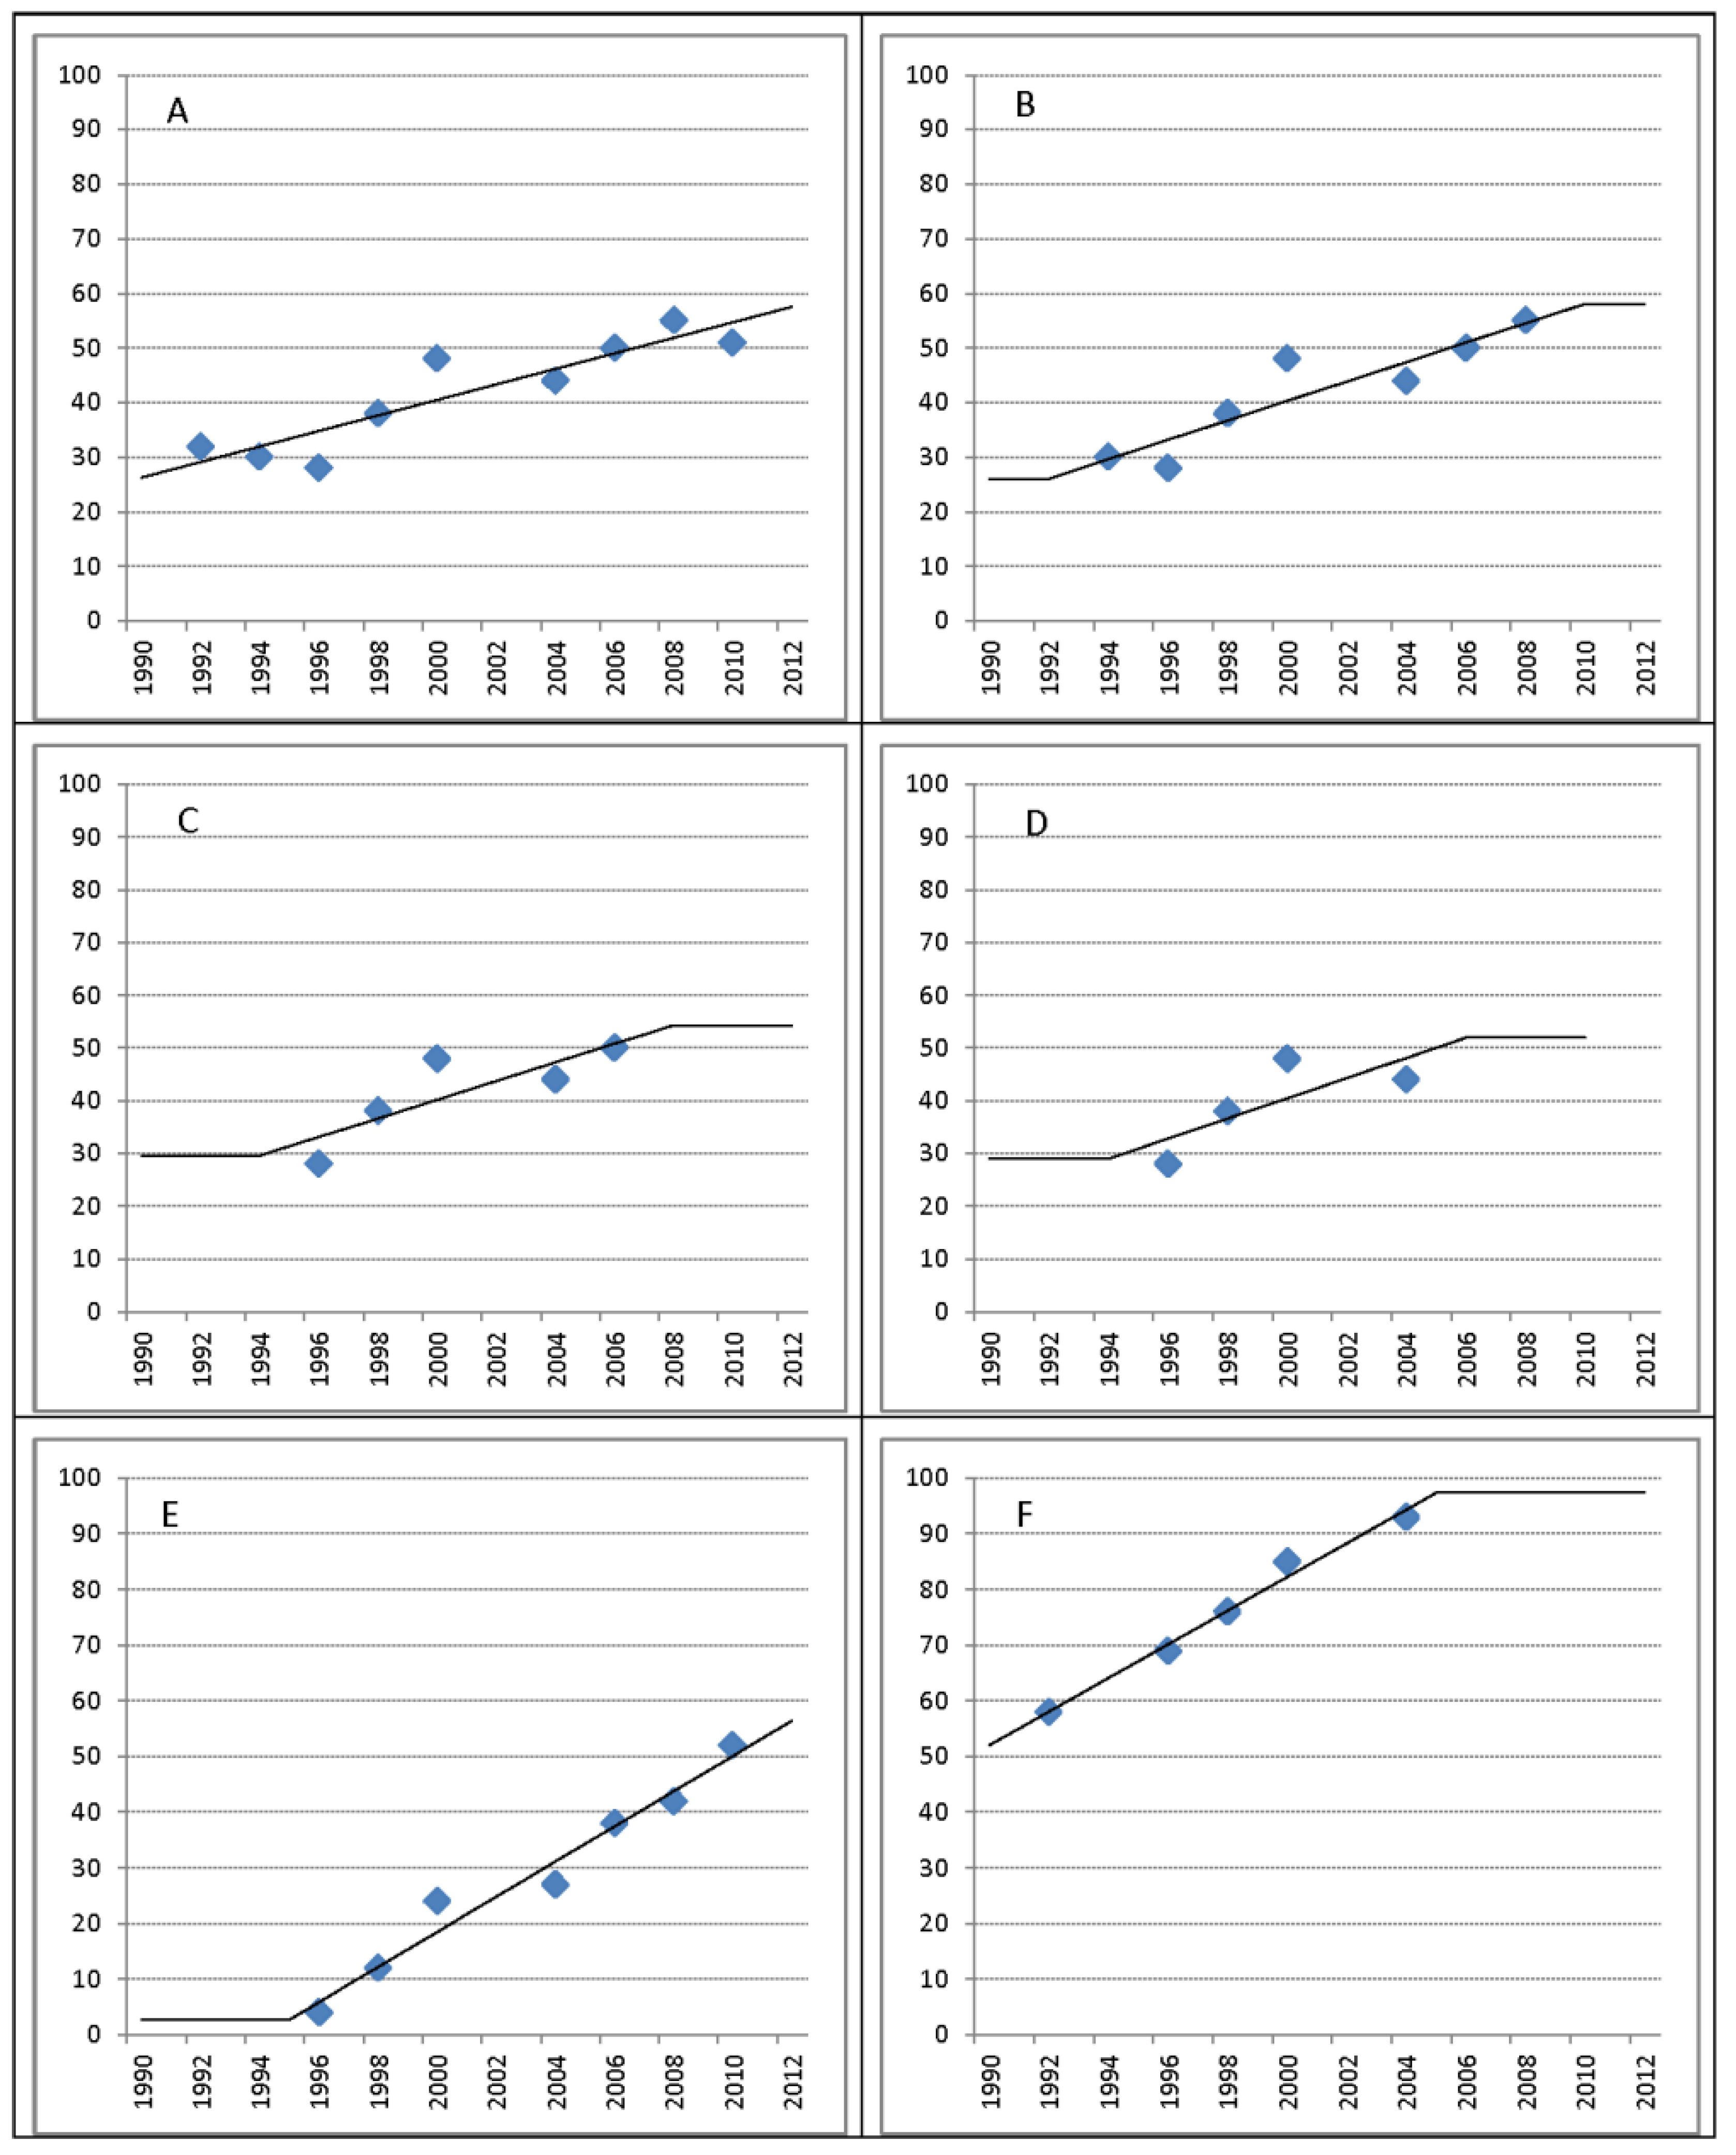
5.3. Alternatives to Linear Regression
6. Discussion
6.1. Accuracy of Current Methods in Representing the Global Coverage Situation

6.2. Future Monitoring Needs
7. Conclusions
Acknowledgements
Author Contributions
Conflicts of Interest
References
- Fukuda-Parr, S. Are the MDGs Priority in Development Strategies and Aid Programmes? Only Few Are! International Poverty Centre: Brasilia, Brazil, 2008. [Google Scholar]
- Meier, B.M.; Kestenbaum, J.G.; Kayser, G.L.; Amjad, U.Q.; Bartram, J. Examining the practice of developing human rights indicators to facilitate accountability for the human right to water and sanitation. J. Hum. Rights Pract. 2014, 6, 159–181. [Google Scholar] [CrossRef]
- World Declaration on the Survival, Protection and Development of Children; UNICEF: New Your, NY, USA, 1990.
- United Nations General Assembly. United Nations Millennium Declaration; United Nations General Assembly: New York, NY, USA, 2000. [Google Scholar]
- International Decade for Action. “Water for Life”, 2005–2015; United Nations General Assembly: New York, NY, USA, 2004.
- International Year of Sanitation 2008; United Nations General Assembly: New York, NY, USA, 2008.
- World Population Prospects: The 2012 Revision; Population Division, Department of Economic and Social Affairs, United Nations: New York, NY, USA, 2013.
- Progress on Drinking Water and Sanitation: 2014 Update; World Health Organization and United Nations Children’s Fund: Geneva, Swizerland and New York, NY, USA, 2014.
- Montgomery, M.A.; Elimelech, M. Water and sanitation in developing countries: Including health in the equation. Environ. Sci. Technol. 2007, 41, 17–24. [Google Scholar] [CrossRef] [PubMed]
- Prüss, A.; Kay, D.; Fewtrell, L.; Bartram, J. Estimating the burden of disease from water, sanitation, hygene at a global level. Environ. Health Perspect. 2002, 110, 537–542. [Google Scholar] [CrossRef] [PubMed]
- Bartram, J. Improving on haves and have-nots. Nature 2008, 452, 283–284. [Google Scholar] [CrossRef] [PubMed]
- Bartram, J.; Brocklehurst, C.; Luyendijk, R.; Hossain, R.; Fisher, M.B.; Wardlaw, T.; Gordon, B. Global monitoring of water supply and sanitation: Critical commentary and future perspectives. Future Perspect. 2014, in press. [Google Scholar]
- Borowy, I. The League of Nations Health Organization: From European to Global Health Concerns? Available online: http://www.academia.edu/798208/The_League_of_Nations_Health_Organisation_from_European_to_Global_Health_Concerns (accessed on 10 July 2014).
- Dieterich, B.H.; Henderson, J.M. Urban Water Supply Conditions and Needs in Seventy-Five Developing Countries; WHO: Geneva, Swizerland, 1963. [Google Scholar]
- Pineo, C.S.; Subrahmanyam, D.V. Community Water Supply and Excreta Disposal Situation in the Developing Countries: A Commentary; WHO: Geneva, Swizerland, 1975. [Google Scholar]
- WHO/UNICEF. Core Questions on Drinking Water and Sanitation for Household Surveys; World Health Organization and United Nations Children’s Fund: Geneva, Switzerland and New York, NY, USA, 2004. [Google Scholar]
- Official List of MDG Indicators; United Nations: Geneva, Swizerland, 2008.
- MICS4 Household Questionnaire, Version 3.0; UNICEF: New York, NY, USA, 2012.
- Demographic and Health Surveys Methodology. Questionnaires: Household, Woman’s, and Man’s; ICF International: Calverton, MD, USA, 2011.
- WHO/UNICEF. WHO/UNICEF Joint Monitoring Programme (JMP) for Water Supply and Sanitation. Available online: http://www.wssinfo.org/ (accessed on 19 April 2014).
- Global Water Supply and Sanitation Assessment 2000 Report; WHO and UNICEF: Geneva, Swizerland and New York, NY, USA, 2000.
- Proclamation of the International Drinking Water Supply and Sanitation Decade; United Nations General Assembly: New York, NY, USA, 1980.
- Najlis, P.; Edwards, A. The international drinking water supply and sanitation decade in retrospect and implications for the future. Nat. Resour. Forum 1991, 15, 110–117. [Google Scholar] [CrossRef]
- UNICEF. Plan of Action for Implementing the World Declaration on the Survival, Protection and Development of Children in the 1990s; Annex: New York, NY, USA, 1990. [Google Scholar]
- UNICEF Multiple Indicator Cluster Survey (MICS). Available online: http://www.unicef.org/statistics/index_24302.html (accessed on 19 April 2014).
- “Road Map” of Millennium Summit Goals Sets Out Blueprint, Timetable for Future Implementation; United Nations: New York, NY, USA, 2001.
- 2005 World Summit Outcome; United Nations General Assembly: New York, NY, USA, 2005.
- Report of the World Summit on Sustainable Development; World Summit on Sustainable Development, United Nations: Johannesburg, South Africa, 2002.
- Integrated and Coordinated Implementation of and Follow-Up to the Outcomes of the Major United Nations Conferences and Summits in the Economic and Social Fields B; United Nations General Assembly: New York, NY, USA, 2003.
- United Nations General Assembly, Follow-up to the outcome of the Millennium Summit and integrated and coordinated implementation of and follow-up to the outcomes of the major United Nations conferences and summits in the economic and social fields. New York, NY, USA, 2004; Vol. A/RES/58/291.
- The Dublin Statement on Water and Sustainable Development. In Proceedings of the International Conference on Water and the Environment, Dublin, Ireland, 31 January 1992.
- Economic and Social Council. Substantive Issues Arising in the Implementation of the International Covenant on Economic, Social and Cultural Rights; United Nations: Geneva, Swizerland, 2003. [Google Scholar]
- The Human Right to Water and Sanitation; General Assembly, United Nations: New York, NY, USA, 2010; Vol. A/RES/64/292.
- Human Rights and Access to Safe Drinking Water and Sanitation; Human Rights Council, United Nations: New York, NY, USA, 2010; Vol. A/HRC/RES/15/9.
- MDG Mid-Term Assessment Report; WHO and UNICEF: Geneva, Swizerland and New York, NY, USA, 2004.
- Progress on Sanitation and Drinking-Water: 2010 Update; WHO and UNICEF: Geneva, Swizerland and New York, NY, USA, 2010.
- Progress on Sanitation and Drinking-Water: 2012 Update; WHO and UNICEF: Geneva, Swizerland and New York, NY, USA, 2012.
- Proposal for Consolidated Drinking Water, Sanitation and Hygiene Targets, Indicators and Definitions; World Health Organization and United Nations Children’s Fund: Geneva, Switzerland and New York, NY, USA, 2013; Vol. 2013.
- SACOSAN. Proceedings of SACOSAN 2003; Ministry of Local Government Rural Development and Cooperatives, Government of the People’s Republic of Bangladesh: Dhaka, Bangladesh, 2003. [Google Scholar]
- Water. In Proceedings of AFRICASAN 2008 2nd African Conference on Sanitation and Hygiene, Durban, South Africa, 18–21 February 2008.
- Proceedings of East Asia Ministerial Conference on Sanitation and Hygiene 2007 (EASan); WHO: Beppu, Japan, 2007.
- Declaracion de Cali. In Proceedings of Latin-American Sanitation Conference LATINOSAN, Cali, Colombia, 19 April 2007.
- Report of the High-level Committee on Programmes at Its Sixth Session; United Nations: Rome, Italy, 2003.
- UN Water. UN Water Terms of Reference. Available online: http://www.un.org/waterforlifedecade/pdf/terms of reference-unwater.pdf (accessed on 19 April 2014).
- UK Department for International Development. UK Recognises the Right to Water as Hilary Benn Launches Call for Global Action Plan to Solve Water Crisis. Available online: http:/www.dfid.gov.uk/news/files/pressreleases/human-dev-report06.asp (accessed on 17 June 2013).
- Global Analysis and Assessment of Sanitation and Drinking-Water (GLAAS); WHO: Geneva, Swizerland, 2012.
- Sanitation and Water for All: A Global Framework for Action; UNICEF: Washitongton, DC, USA, 2010.
- OECD International Development Statistics (IDS) Online Databases on Aid and Other Resource Flows. Available online: http://www.oecd.org/dac/stats/international-development-statistics.htm (accessed on 4 May 2014).
- Conference Statement on Sanitation and Hygiene in Africa; AfricaSan: Johannesburg, South Africa, 2002.
- Declaration on Sanitation and Hygiene in East Asia; EASAN: Nusa Dua‐Bali, Indonesia, 2012.
- Human Development Report 2013. The Rise of the South: Human Progress in a Diverse World; UNDP: New York, NY, USA, 2013.
- Human Development Report 2006. Beyond Scarcity: Power, Poverty and the Global Water Crisis; UNDP: New York, NY, USA, 2006.
- The United Nations World Water Development Report 4: Managing Water under Uncertainty and Risk; WWAP: Paris, Franch, 2012.
- Ibrahim Index of African Governance: Summary Report; Mo Ibrahim Foundation: London, UK, 2012.
- The Challenge of Slums: Global Report on Human Settlements; UN-Habitat: London, UK, 2003.
- Eisenberg, J.N.; Scott, J.C.; Porco, T. Integrating disease control strategies: Balancing water sanitation and hygiene interventions to reduce diarrheal disease burden. Amer. J. Public Health 2007, 97, 846–852. [Google Scholar] [CrossRef]
- Prüss-Üstün, A.; Bos, R.; Gore, F.; Bartram, J. Safer Water, Better Health: Costs, Benefits and Sustainability of Interventions to Protect and Promote Health; WHO: Geneva, Switzerland, 2008. [Google Scholar]
- Prüss-Üstün, A.; Kay, D.; Fewtrell, L.; Bartram, J. Unsafe water, sanitation and hygiene. In Comparative Quantification of Health Risks: Global and Regional Burden of Disease due to Selected Major Risk Factors; WHO: Geneva, Switzerland, 2004; Volume 2. [Google Scholar]
- Hutton, G.; Haller, L.; Bartram, J. Global cost-benefit analysis of water supply and sanitation interventions. J. Water Health 2007, 5, 481–502. [Google Scholar] [CrossRef] [PubMed]
- Hutton, G. Global costs and benefits of reaching universal coverage of sanitation and drinking-water supply. J. Water Health 2013, 11, 1–12. [Google Scholar] [CrossRef] [PubMed]
- Clasen, T.F. Household water treatment and the millennium development goals: Keeping the focus on health. Environ. Sci. Technol. 2010, 44, 7357–7360. [Google Scholar] [CrossRef] [PubMed]
- Easterly, W. How the millennium development goals are unfair to Africa. World Develp. 2009, 37, 26–35. [Google Scholar] [CrossRef]
- Sachs, J.D. From millennium development goals. Lancet 2012, 379, 2206–2211. [Google Scholar] [CrossRef] [PubMed]
- UNICEF. Multiple Indicator Cluster Survey (MICS). Available online: http://www.unicef.org/statistics/index_24302.html (accessed on 18 June 2013).
- USAID. Measure DHS Demographic and Health Surveys. Available online: http://www.measuredhs.com/ (accessed on 18 June 2013).
- Training Field Staff for DHS Surveys; ICF Internetional: Calverton, MD, USA, 2009.
- MICS4 Manual: Instructions for Supervisors, Editors and Measurers; UNICEF: New York, NY, USA, 2009.
- DHS Methodology. Available online: http://www.dhsprogram.com/What-We-Do/Survey-Types/DHS-Methodology.cfm#CP_JUMP_16156 (accessed on 15 April 2014).
- UNICEF. MICS4 Manual: Designing and Selecting the Sample. Available online: http://www.childinfo.org/files/MICS4_Manual-Designing_and_Selecting_the_Sample.doc (accessed on 4 August 2014).
- The International Household Survey Network. Available online: http://www.surveynetwork.org (accessed on 12 June 2013).
- Study on Global AGEing and Adult Health (SAGE); WHO: Geneva, Switzerland, 2013.
- World Health Survey. WHO: Geneva, Switzerland, 2013.
- World Bank LSMS Living Standards Measurement Study. Available online: http://econ.worldbank.org/WBSITE/EXTERNAL/EXTDEC/EXTRESEARCH/EXTLSMS/0,,contentMDK:21610833~pagePK:64168427~piPK:64168435~theSitePK:3358997,00.html (accessed on 18 June 2013).
- IPUMS Integrated Public Use Microdata Series. Available online: http://www.ipums.org (accessed on 12 June 2013).
- Gunther, I.; Fink, G. Water, Sanitation and Children’s Health: Evidence from 172 DHS Surveys; The World Bank: Washington, DC, USA, 2010. [Google Scholar]
- Groundwater Studies for Arsenic Contamination in Bangladesh. Phase 2: National Hydrochemical Survey; Department of Public Health Engineering: Dhaka, Bangladesh, 2000.
- Johnston, R.B.; Sarker, M.H. Arsenic mitigation in Bangladesh: National screening data and case studies in three upazilas. J. Environ. Sci. Health A 2007, 42, 1889–1896. [Google Scholar] [CrossRef]
- Bangladesh National Drinking Water Quality Survey of 2009; Bangladesh Bureau of Statistics, UNICEF: Dhaka, Bangladesh, 2011.
- World Population Prospects: The 2010 Revision; Population Division, Department of Economic and Social Affairs, United Nations: New Youk, NY, USA, 2011.
- A Snapshot of Drinking Water and Sanitation in Africa—2012 Update; WHO/UNICEF: Cairo, Egypt, 2012.
- The Drinking Water and Sanitation Situation in the Arab States, 2006; WHO/UNICEF: Geneva, Switzerland and New York, NY, USA, 2008.
- Principles and Recommendations for Population and Housing Censuses. Revision 2; Statistics Division, United Nations: New York, NY, USA, 2008.
- United Nations Demographic Yearbook; Statistics Division, United Nations: New York, NY, USA, 2005.
- Progress on Sanitation and Drinking-water: Special Focus on Sanitation; WHO/UNICEF: Geneva, Switzerland and New York, NY, USA, 2008.
- Drinking Water Equity, Safely and Sustainability: JMP Thematic Report on Drinking Water; WHO/UNICEF: Geneva, Switzerland and New York, NY, USA, 2011.
- Proposal for Consolidated Drinking Water, Sanitation and Hygiene Targets, Indicators and Definitions; WHO/UNICEF: Geneva, Switzerland and New York, NY, USA, 2013; Vol. 2013.
- Hossain, R.; Luyendijk, R. JMP and Data Reconciliation; WHO and UNICEF: Bangkok, Thailand, 2009. [Google Scholar]
- The International Drinking Water Supply and Sanitation Decade: End of Decade Review; WHO: Geneva, Switzerland, 1992.
- Wolf, J.; Bonjour, S.; Prüss-Ustün, A. An exploration of multilevel modeling for estimating access to drinking-water and sanitation. J. Water Health 2013, 11, 64–77. [Google Scholar] [CrossRef] [PubMed]
- Yerg, A.; Bartram, J. Modeling and forecasting drinking-water and sanitation access: A new approach, to be submitted.
- Mortel, T.F.V.D. Faking it: Social desirability response bias in self-report research. Aust. J. Adv. Nurs. 2008, 25, 40–48. [Google Scholar]
- Christenson, E.; Bain, R.; Wright, J.; Aondoakaa, S.; Hossain, R.; Bartram, J. Examining the influence of urban definition when assessing relative safety of drinking-water in Nigeria. Sci. Total Environ. 2014, 490, 301–312. [Google Scholar] [CrossRef] [PubMed]
- Nnaji, C.C.; Eluwa, C.; Nwoji, C. Dynamics of domestic water supply and consumption in a semi-urban Nigerian city. Habitat Int. 2013, 40, 127–135. [Google Scholar] [CrossRef]
- Heijnen, M.; Cumming, O.; Peletz, R.; Chan, G.K.-S.; Brown, J.; Baker, K.; Clasen, T. Shared sanitation vs. individual household latrines: A systematic review of health outcomes. PLoS One 2014, 9. [Google Scholar] [CrossRef]
- Onda, K.; LoBuglio, J.; Bartram, J. Global access to safe water: accounting for water quality and the resulting impact on MDG progress. Int. J. Environ. Res. Public Health 2012, 9, 880–894. [Google Scholar] [CrossRef] [PubMed]
- Dar, O.A.; Khan, M.S. Millennium development goals and the water target: Details, definitions and debate. Trop. Med. Int. Health 2011, 16, 540–544. [Google Scholar] [CrossRef] [PubMed]
- Pullan, R.L.; Freeman, M.C.; Gething, P.W.; Brooker, S.J. Geographical inequalities in use of improved drinking water supply and sanitation across Sub-Saharan Africa: Mapping and spatial analysis of cross-sectional survey data. PLoS Med. 2014, 11. [Google Scholar] [CrossRef]
- Luh, J.; Baum, R.; Bartram, J. Equity in water and sanitation: Developing an index to measure progressive realization of the human right. Int. J. Hyg. Environ. Health 2013, 216, 662–671. [Google Scholar] [CrossRef] [PubMed]
- Bain, R.; Cronk, R.; Wright, J.; Yang, H.; Slaymaker, T.; Bartram, J. Fecal contamination of drinking-water in low-and middle-income countries: A systematic review and meta-analysis. PLoS Med. 2014, 11. [Google Scholar] [CrossRef]
- Rapid Assessment of Drinking Water Quality (RADWQ) in Jordan, Tajikistan, India, Nicaragua, Nigeria, and Ethiopia; WHO/UNICEF Joint Monitoring Program: Geneva, Switzerland and New York, NY, USA, 2014.
- Howard, G. Water Supply Surveillance: A Reference Manual; Water Engineering and Development Centre, Loughborough University: Loughborough, UK, 2002. [Google Scholar]
- Bartram, J.; Lloyd, B.J. Surveillance solutions to microbiological problems in water quality control in developing countries. Water Sci. Technol. 1991, 24, 61–75. [Google Scholar]
- Cronk, R.; Bartram, J.; Slaymaker, T. Monitoring drinking water, sanitation, and hygiene in non-household settings: Priorities for policy and practice, to be submitted.
© 2014 by the authors; licensee MDPI, Basel, Switzerland. This article is an open access article distributed under the terms and conditions of the Creative Commons Attribution license (http://creativecommons.org/licenses/by/3.0/).
Share and Cite
Bartram, J.; Brocklehurst, C.; Fisher, M.B.; Luyendijk, R.; Hossain, R.; Wardlaw, T.; Gordon, B. Global Monitoring of Water Supply and Sanitation: History, Methods and Future Challenges. Int. J. Environ. Res. Public Health 2014, 11, 8137-8165. https://doi.org/10.3390/ijerph110808137
Bartram J, Brocklehurst C, Fisher MB, Luyendijk R, Hossain R, Wardlaw T, Gordon B. Global Monitoring of Water Supply and Sanitation: History, Methods and Future Challenges. International Journal of Environmental Research and Public Health. 2014; 11(8):8137-8165. https://doi.org/10.3390/ijerph110808137
Chicago/Turabian StyleBartram, Jamie, Clarissa Brocklehurst, Michael B. Fisher, Rolf Luyendijk, Rifat Hossain, Tessa Wardlaw, and Bruce Gordon. 2014. "Global Monitoring of Water Supply and Sanitation: History, Methods and Future Challenges" International Journal of Environmental Research and Public Health 11, no. 8: 8137-8165. https://doi.org/10.3390/ijerph110808137