Article Text

Abstract
Introduction Maps of malaria risk are important tools for allocating resources and tracking progress. Most maps rely on cross-sectional surveys of parasite prevalence, but health facilities represent an underused and powerful data source. We aimed to model and map malaria incidence using health facility data in Uganda.
Methods Using 24 months (2019–2020) of individual-level outpatient data collected from 74 surveillance health facilities located in 41 districts across Uganda (n=445 648 laboratory-confirmed cases), we estimated monthly malaria incidence for parishes within facility catchment areas (n=310) by estimating care-seeking population denominators. We fit spatio-temporal models to the incidence estimates to predict incidence rates for the rest of Uganda, informed by environmental, sociodemographic and intervention variables. We mapped estimated malaria incidence and its uncertainty at the parish level and compared estimates to other metrics of malaria. To quantify the impact that indoor residual spraying (IRS) may have had, we modelled counterfactual scenarios of malaria incidence in the absence of IRS.
Results Over 4567 parish-months, malaria incidence averaged 705 cases per 1000 person-years. Maps indicated high burden in the north and northeast of Uganda, with lower incidence in the districts receiving IRS. District-level estimates of cases correlated with cases reported by the Ministry of Health (Spearman’s r=0.68, p<0.0001), but were considerably higher (40 166 418 cases estimated compared with 27 707 794 cases reported), indicating the potential for underreporting by the routine surveillance system. Modelling of counterfactual scenarios suggest that approximately 6.2 million cases were averted due to IRS across the study period in the 14 districts receiving IRS (estimated population 8 381 223).
Conclusion Outpatient information routinely collected by health systems can be a valuable source of data for mapping malaria burden. National Malaria Control Programmes may consider investing in robust surveillance systems within public health facilities as a low-cost, high benefit tool to identify vulnerable regions and track the impact of interventions.
- malaria
- geographic information systems
- epidemiology
Data availability statement
Data are available in a public, open access repository. The datasets generated and/or analysed during the current study, in addition to sample code for model fitting, are available in the github repository, https://github.com/aeepstein/uganda_risk_map.
This is an open access article distributed in accordance with the Creative Commons Attribution Non Commercial (CC BY-NC 4.0) license, which permits others to distribute, remix, adapt, build upon this work non-commercially, and license their derivative works on different terms, provided the original work is properly cited, appropriate credit is given, any changes made indicated, and the use is non-commercial. See: http://creativecommons.org/licenses/by-nc/4.0/.
Statistics from Altmetric.com
WHAT IS ALREADY KNOWN ON THIS TOPIC
Understanding the spatial distribution of malaria is critical for targeting control efforts and keeping track of burden. Today’s maps have inadequate operational utility for local decision-making because they are low in resolution and rely on poor indicators such as parasite prevalence.
One underused but potentially powerful source of data for malaria risk mapping is information collected at public health facilities.
WHAT THIS STUDY ADDS
This study demonstrates the potential value of health facility data for risk mapping. Model validation, including out-of-sample prediction, indicated that accuracy was high, particularly in areas where health facilities were clustered more closely together. With an average distance of 170 km between health facilities, out-of-sample predictions were accurate—nearly as accurate as in-sample predictions.
HOW THIS STUDY MIGHT AFFECT RESEARCH, PRACTICE OR POLICY
These findings indicate that creating a network of sentinel health facilities with extra quality control measures may be a worthwhile investment for National Malaria Control Programmes, while remaining more inexpensive and clinically relevant than other surveillance efforts, such as cross-sectional surveys conducted every 3–5 years. Risk maps generated using enhanced health facility data have the potential to be an essential tool for high burden countries as they aim to achieve targets towards control and elimination.
Background
Understanding the spatial distribution of malaria burden is critical for identifying high transmission areas, evaluating local effectiveness of control efforts, and targeting future interventions to areas of greatest need.1 2 However, most existing maps of malaria risk have inadequate operational utility for local decision-making because they are low in resolution and rely on poor surveillance indicators such as parasite prevalence collected with limited geographical and temporal representativeness.3–7 Health management information system (HMIS) data collected routinely through the public health system are an underused source of rich information on counts of malaria cases that could be used for high-resolution risk maps of malaria incidence.8 9 These data typically have limitations including poor case ascertainment, inadequate reporting rates, reporting of aggregate case data and ambiguous population denominators around health facilities.4 10 11 However, HMIS data exhibit important strengths: they provide a direct measure of morbidity, are collected continuously over time, cover a broad geographical range and are relatively inexpensive to collect.8 9
Uganda is a country that could benefit greatly from high resolution maps of malaria burden. Malaria remains one of the leading health problems of Uganda despite rigorous efforts to improve vector control and case management over the past several decades.2 12 The burden of malaria is heterogeneous across the country; in some areas, burden is low due to geographical and climate variation, and in others due to the successful deployment of vector control measures such as indoor residual spraying (IRS).13 14 High-resolution maps of malaria risk could be used by the country’s National Malaria Control Division (NMCD) to best target its resources; for example, from 2019 to 2020, funding was only available to cover 14 of the 135 districts in the country with IRS. In addition, these maps could be used to evaluate the impact of interventions—a crucial step towards maximising the limited resources available and allowing Uganda to meet its targets established by the by the WHO’s Global Technical Strategy for malaria, including reducing malaria incidence from 2015 by at least 90% by 2030.15
In this analysis, we used enhanced health facility surveillance data to measure and map malaria incidence in Uganda in 2019–2020. First, we generated high-resolution monthly estimates of malaria incidence using data from 74 high volume public health facilities across the country by modelling catchment area populations around facilities. Second, we built a spatio-temporal prediction model for malaria incidence using sociodemographic, environmental and intervention covariates. Third, we used this model to map malaria risk across Uganda. Fourth, we compared estimates from our model to other measures used by the NMCD and modelled counterfactual vector control intervention scenarios.
Methods
Enhanced health facility data
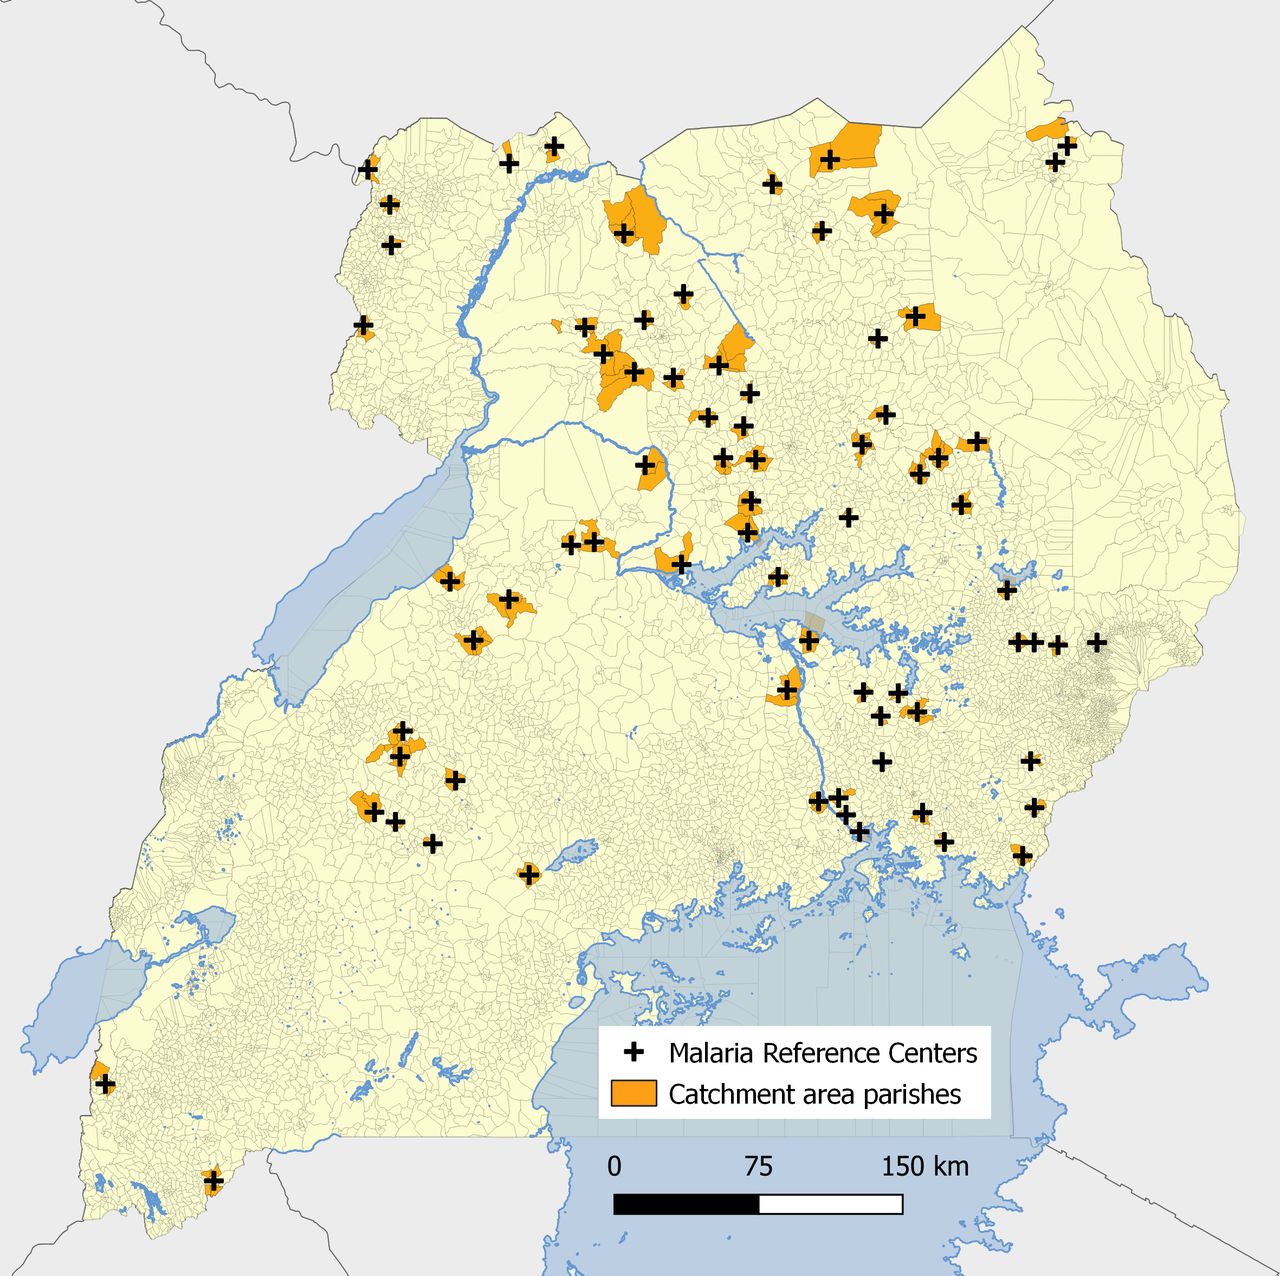
The Uganda Malaria Surveillance Programme (UMSP) has been conducting enhanced outpatient malaria surveillance in selected high volume level III and IV public health facilities in Uganda, called malaria reference centres (MRCs), since 2006.16 At each MRC, individual-level data are entered into an electronic Microsoft Access database for all individuals presenting to the outpatient department using a standardised format. Information collected on outpatients includes demographics (sex, age and village/parish of residence), results of laboratory tests (rapid diagnostic test or microscopy), diagnoses given and treatments prescribed. UMSP provides laboratory support and quality control training to ensure high-quality diagnostic testing, adherence to recommended case management and data completeness. This analysis used 2 years (24 months) of health facility-based surveillance data from 74 UMSP MRCs (figure 1), from January 2019 to December 2020. This study window was selected to maximise the number of UMSP MRCs operating during the analytic period as 49 new UMSP sites were opened in 2019 and 2020. For information on the number of months each site contributed to the analysis, see online supplemental table 1.
Supplemental material

Map of malaria reference centres and parishes within the catchment area of each health facility.
Estimation of malaria incidence outcome
To quantify malaria incidence in each parish, estimates of the care-seeking population living in the catchment area of each health facility are needed to serve as a denominator. Since these estimates are not available and the catchment areas of health facilities are not clearly defined, we modelled catchment area populations using a method previously described.17 In brief, we calculated village-level travel times to each MRC using Malaria Atlas Project’s (MAP) friction surface 2015 raster file.18 This friction surface provides Uganda-specific travel times associated with road types or, in the absence of roads, walking times. Using information on each outpatient’s village of residence (the highest resolution information on patient residence available in the UMSP database), we estimated a care-seeking model for the relationship between travel time and probability of attending the MRC using non-linear Poisson generalised additive models with non-linearity modelled with splines, restricting to villages for which the MRC was the nearest health facility. This relationship was estimated among outpatients not suspected of having malaria because their probability of attendance was less likely to be directly correlated with malaria incidence across villages. This model implicitly assumed that differences in care-seeking for outpatients not suspected of having malaria over space was driven exclusively by travel time to the health facility and that the probability of seeking care among those living in the village where the MRC is located was 100%; results derived from this method, therefore, represent the relative probability of attendance for each village. With this care-seeking model, we generated relative probabilities of attending the health facility for each village around the MRC. These probabilities were then used to down-weight village-level population estimates derived from the WorldPop Project19 to generate catchment area populations and estimate malaria incidences for each village. Catchment area borders were defined by restricting to villages residing in parishes for which the closest health facility was the MRC. WorldPop population denominators were estimated for 2020 and were constrained to areas with human settlements detected by satellite.
For spatio-temporal modelling, we aggregated monthly malaria case counts and down-weighted care-seeking population estimates to the parish level (administrative level 6).20 We opted to fit the model to parish-level estimates of malaria incidence to reduce statistical noise; malaria incidence estimates were more stable at lower resolution (eg, parish vs village) and model fit was substantially improved. Monthly incidence was defined as the count of laboratory-confirmed malaria cases from each parish within an MRC’s catchment divided by the down-weighted parish-level population estimate. The numerator of this estimate (of laboratory-confirmed malaria cases) was estimated as a count without adjustment for missingness or testing rates given the quality of the UMSP database, with low (less than 5%) missingness of key variables and high (greater than 99%) diagnostic testing of patients with malaria suspected.
Covariate data
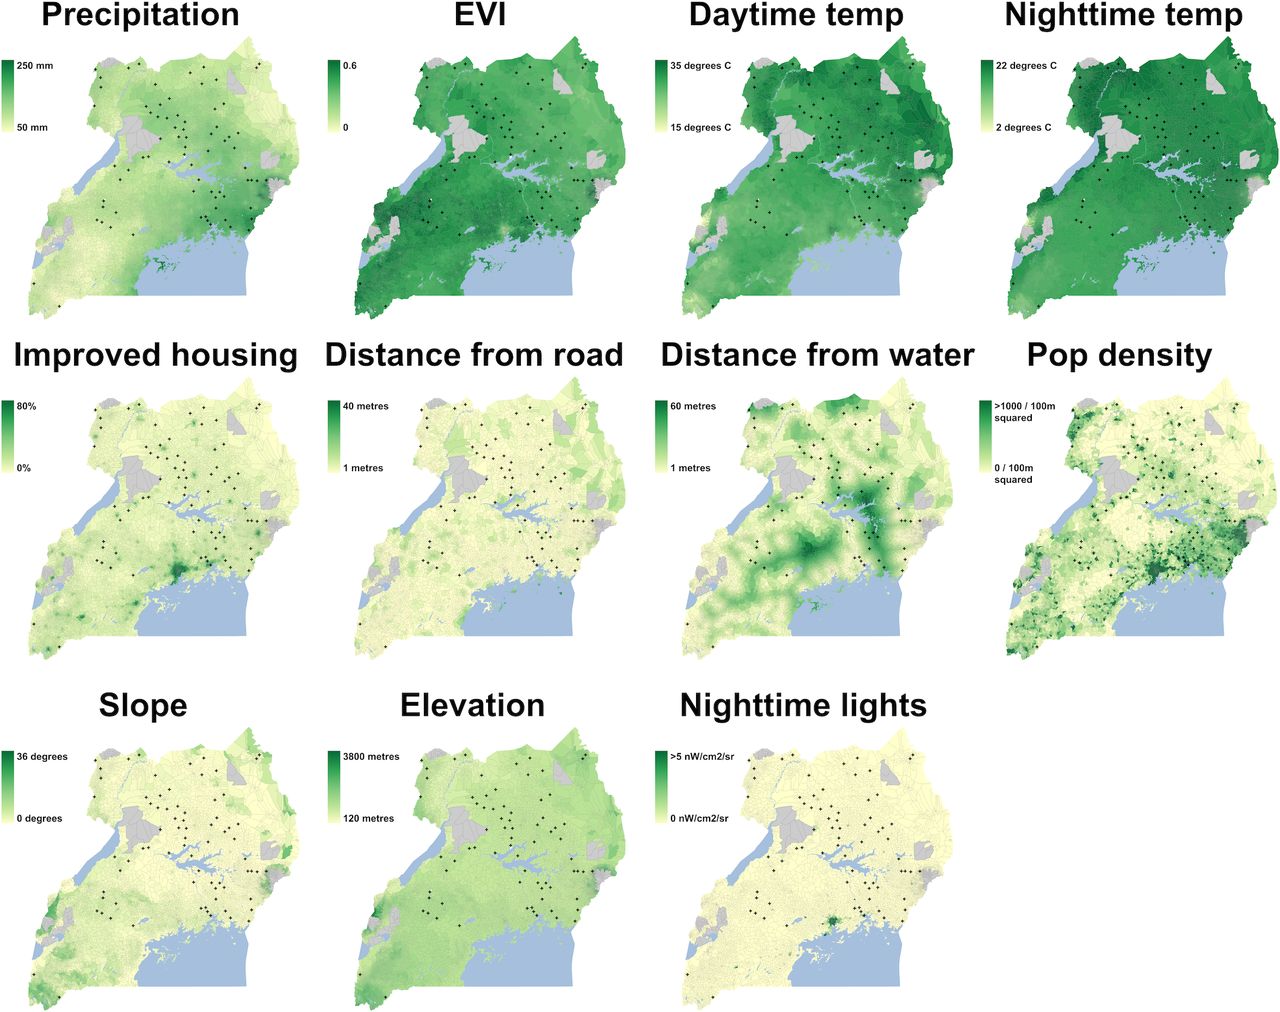
A set of environmental and sociodemographic variables known to be associated with malaria burden21 were considered as candidate predictors for model selection (table 1). Dynamic covariates, including precipitation,22 daytime and night-time land surface temperature,23 and Enhanced Vegetation Index (EVI),24 were aggregated to monthly measures. A series of lags (0, 1, 2 and 3 months prior to the month of outcome data) were considered in models, given the potential for delayed impacts of environmental variables and malaria outcomes. Moderate Resolution Imaging Spectroradiometer (MODIS) products (temperature and EVI) underwent gap-filling using a random forest model to adjust for gaps due to cloud cover (code available at https://github.com/disarm-platform/gapfilling_rasters).
Candidate covariates for spatio-temporal generalised additive model
Static covariates included elevation measured through the Shuttle Radar Topography Mission,25 slope,26 population density,27 distance to major roads and to major waterways,27 the prevalence of improved housing28 and the presence of night-time lights.29
We also included district-level variables representing vector control interventions. These included the number of months since the most recent long-lasting insecticide treated bednet (LLIN) distribution and the number of months since the latest IRS campaign.
Spatial aggregation of covariates
To aggregate raster data to the parish level, we calculated a weighted mean, weighing by raster values by human population estimates from WorldPop within each parish, due to the fact that malaria transmission occurs in human-dominated areas.19 Prior to model specification, all covariates were normalised to have a mean of 0 and an SD of 1. For variables with a long-tailed distribution such as night-time lights and distance from road, log transformation was performed prior to normalisation.
Spatio-temporal generalised additive model
The number of positive cases in parish v at month t ( ) was modelled via a negative binomial generalised additive regression model (GAM) with spatio-temporal smooths accounting for a spatial latent process varying with time.30 Parish-level population denominators derived from the care seeking model (
 ) were included as an offset term in the incidence model. A non-linear temporal trend was included with a smoothing function on month,
  . Spatio-temporal smooths were estimated using Gaussian Markov random fields (GMRF)
  , allowing smooths to differ flexibly over space (parish) and time. GMRF are used to account for spatio-temporal autocorrelation when spatial data are measured over discrete polygons.31 All environmental, sociodemographic and intervention variables were modelled with restricted cubic splines in
  .
.


Covariate selection was conducted via a two-step process. First, collinearity among all candidate covariates was assessed by calculating variance inflation factors (VIF) using a linear model including all covariates. A stepwise selection of variables with VIF<10 was then conducted, sequentially removing the variable with the highest VIF (if the VIF≥10) until all VIF<10.32–34 Second, during GAM specification, regularisation was used to integrate model selection into the model fitting step by adding an extra penalty to each term. This allows coefficients for covariates to be penalised to zero, meaning that splines can be kept minimal if the data do not support flexibility and covariates can essentially be removed from the model if their inclusion is not useful.30
Using the final model, malaria incidence aggregated to the 2-year study window was predicted at the parish level for all parishes in Uganda (n=7569). Parish-level estimated incidence was then mapped, in addition to upper and lower bounds of 95% CIs and mean standard errors across the 24-month period.
Counterfactual scenarios of malaria incidence in the absence of IRS campaigns were estimated by setting the binary covariate representing whether a district received IRS during the study window to 0 and predicting malaria incidence at the parish level. These estimates were then compared with predicted malaria incidence in the original model to estimate the impact of these campaigns in terms of cases averted and their 95% CIs.
Evaluation of predictive accuracy
Model performance was evaluated through four levels of 10-fold cross-validation: (1) random selection of health facilities; (2) random selection of health facilities in the middle of the country where the density of sites was high (mean distance 170 km), excluding 10 facilities whose mean distance from other health facilities was 310 km (see online supplemental figure 2 for a map of the high density sites); (3) 200 km spatial blocks (see online supplemental figure 3 for spatial fold distribution35) and (4) by time. Furthermore, we assessed model performance in models including only spatial smooths, in addition to the full model (with spatial smooths and covariates). Predictive accuracy was assessed by comparing the predicted log counts of cases to in-sample and out-of-sample observed log counts graphically by calculating goodness-of-fit measures including root mean squared error, mean absolute error and R2.
Reflexivity
The international research team included early career and senior researchers from both the Global North and Global South. A structured reflexivity statement can be found in online supplemental appendix S1.
Results
MRC data overview and quality
From 2019–2020, a total of 1 923 530 patients were seen across the 74 MRCs, 779 290 of whom tested positive for malaria. Diagnostic testing rates were high (99.6% of patients suspected of having malaria were tested), and missingness of key variables was near-zero (0.12% missingness for age, 0.07% for sex and 4.25% missingness for village of residence in 2019–2020).
Catchment areas
Across the 74 sites, catchment areas included between 1 and 8 parishes. The median catchment area population size was 8054 individuals (IQR 4451–14 048). Online supplemental table 1 contains site-level information on the number of parishes included in each catchment area, in addition to the population estimate of each catchment area using estimates from WorldPop and estimates of malaria incidence across the 24-month study period. Online supplemental figure 1 shows the number of months each parish contributed to the dataset.
Distribution of outcome and predictor variables
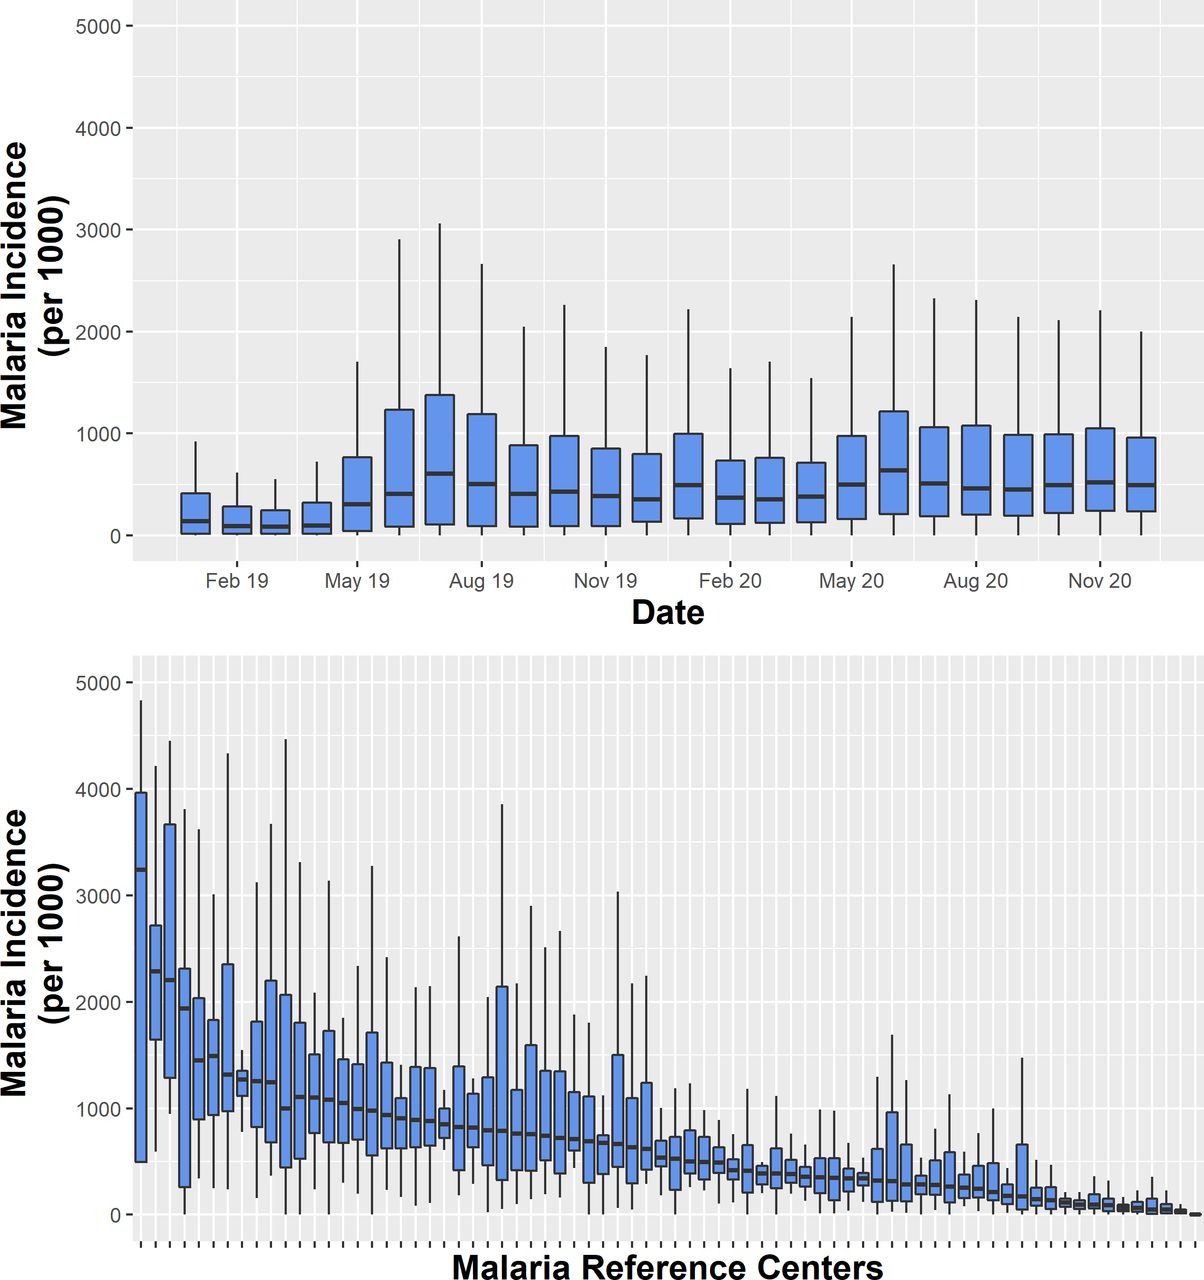
Figure 2 shows the distribution of parish-level malaria incidence by month and by MRC. There was substantial variation in malaria incidence over the 24-month period, with monthly medians across all parishes of 85 cases per 1000 person-years to 640 cases per 1000 person-years. There was also substantial variation between sites, ranging from a median of 0 cases per 1000 person-years across the 24 months to 3203 cases per 1000 person-years.

Distribution of outcome (malaria incidence) over time (top) and between sites (bottom).
Spatial distributions of predictor variables at the parish level across Uganda are shown in figure 3, with dynamic covariates averaged over the 24-month period.

Spatial distribution of spatial covariates. Dynamic covariates are averaged over the 24-month period. Greyed out areas represent national parks.
Model results and predictive performance
To estimate the relationship between predictor variables and malaria incidence, we specified a spatio-temporal GAM with GMRF smooths to account for spatial autocorrelation. Smoothed relationships from the final spatio-temporal GAM are shown in online supplemental figure 4.36 Of the potential dynamic variables and their lags we considered, the final model included precipitation and night-time temperature at 0, 1, 2 and 3 months lags, daytime temperature at 0 and 3 months lags, and EVI at 0, 1 and 3 months lags, selected by excluding highly collinear variables as described in the methods section. Overall, malaria incidence increased over the 24-month study period as indicated by the monthly temporal smooth. EVI at 0 and 1-month lags were positively associated with incidence in this dataset—higher EVI was associated with increases in malaria incidence—while EVI at a 3-month lag displayed a negative association, with increases in EVI associating with lower malaria incidence. Overall, once accounting for other covariates, precipitation did not appear to be associated with incidence in this dataset. Sociodemographic covariates such as improved housing, distance from road, and distance from water, night-time lights, and population density all demonstrated significant non-linear associations with incidence, as did elevation and slope, in addition to both intervention variables (months since LLIN and IRS campaigns).
Model diagnostics were satisfactory (online supplemental figure 5), with normality of residuals. Predictive performance both in-sample and out-of-sample is presented in table 2. The in-sample predictive performance of our model was good, indicated by an R2 of 0.73 when predicting over time and space (parish-months, n=4567), 0.85 when predicting over space (parishes, n=310) and 0.99 when predicting over time (months, n=24). As expected, the out-of-sample predictive performance was lower for all rounds of out-of-sample cross-validation (random selection of sites, random selection of high density sites, spatial blocks and temporal blocks). The largest drop was observed for spatial block cross-validation (when predicting at the parish level as was done for the maps in this analysis, R2 reduced from 0.85 in-sample to 0.56). When sites were randomly selected, both across all sites and among high density sites, performance was better (eg, when predicting at the parish level, R2 was 0.73 and 0.75, respectively). Models performed well when predicting to out-of-sample temporal blocks (R2=0.83 when aggregated to parishes). When covariates were excluded from the model, performance remained relatively high, particularly when health facilities were randomly selected among high density sites. Covariates improved model fit when predicting further away (as demonstrated through spatial block cross-validation) and when predicting temporal trends.
Model performance indicators (R2) for in-sample and out-of-sample cross-validated predictions
Model results
Figure 4 shows the parish-level map of malaria incidence resulting from the spatio-temporal GAM. Estimated malaria incidence was generally highest in the north, except for an area in the Northeast that was undergoing sustained IRS since 2014 (outlined in green), which demonstrated substantially lower incidence. An estimated 14.8% of parishes had incidence below 100 cases per 1000, 49.8% of parishes fell between 100 and 500 cases per 1000, 22.3% between 500 1000 cases per 1000 and 13.2% greater than 1000 cases per 1000 population. As expected, estimates had greater certainty (narrower CIs) in areas with more MRCs, particularly in the north of the country, where predictions are more stable as they were informed by nearby parishes through spatial smoothing and covariates reflecting similar environments. Estimates were much less precise in the southwest, where the environment was somewhat distinct and only 2 MRCs were present (figure 4B).

(A) Parish-level estimated incidence per 1000 over the study window; (B) mean SE on the log scale and locations of malaria reference centres; (C) lower and (D) upper bound of the 95% CI. Districts receiving indoor residual spraying campaigns are outlined in green in A, C and D.
Comparison of estimates to other estimates of malaria incidence
A comparison of case counts reported by the Ugandan HMIS to modelled case counts at the district level in 2019 and 2020 is plotted and mapped in figure 5A,C. In sum, the model estimated 40 166 418 cases of malaria across 24 months; 27 707 794 cases were reported by the HMIS in the same period. There was moderate correlation between modelled and reported case counts for each district (Spearman’s r=0.68, p<0.0001). In most districts, predicted case counts were higher than HMIS-reported counts (figure 5C); however, in some areas, particularly in areas in the Northwest of the country, HMIS cases were higher than modelled cases.
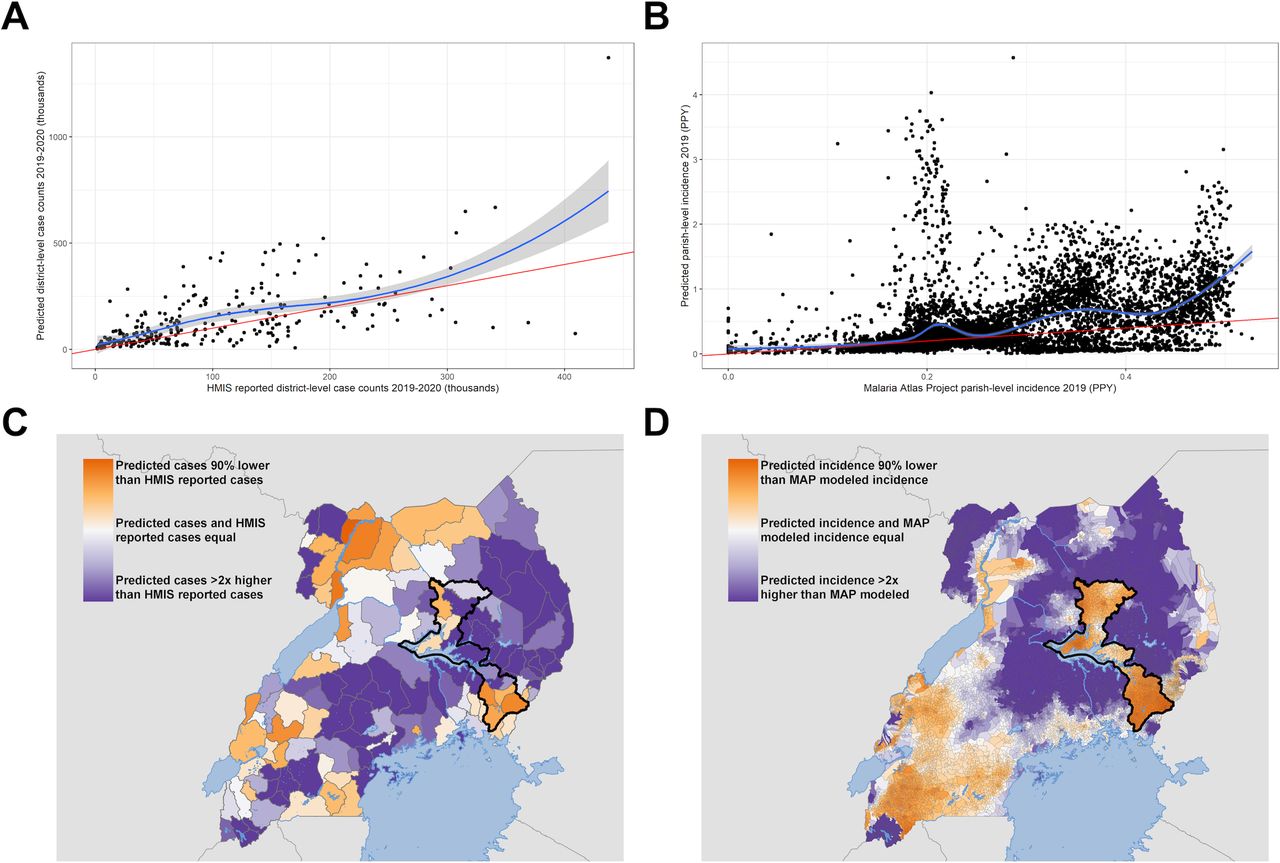
(A) Comparison of district-level case counts reported by the Ugandan health management information system (HMIS) to estimated district-level case counts in thousands in 2019 and 2020; (B) comparison of parish-level average malaria incidence modelled by the Malaria Atlas Project (MAP) to estimated parish-level incidence in 2019; (C) mapped district-level differences in case counts reported by the Ugandan HMIS to estimated district-level case counts in thousand in 2019 and 2020; (D) mapped parish-level differences in average malaria incidence modelled by the MAP to estimated parish-level incidence in 2019. The identity line in A and B is indicated in red and a lowess smooth is indicated in blue. PPY; per person-year.
We also compared parish-level incidence in 2019 modelled by the MAP37 (by calculating the population-weighted average mapped incidence within each parish) to parish-level incidence resulting from our model (figure 5B,D). The mean parish-level incidence across Uganda was 440 cases per 1000 population from our model and 268 cases per 1000 population from MAP. The Spearman correlation between these measures is 0.46 (p<0.0001). Across most of the higher burden North and East of Uganda, our modelled incidence was higher than MAP incidence (figure 5D). One key exception is the parishes undergoing IRS in the Northeast of the country (outlined in black), where MAP incidence, which does not directly incorporate up-to-date intervention data aside from static modelled surfaces indicating coverage of LLINs and IRS, was higher than our modelled incidence. In the lower burden Southwest of the country, our modelled incidence was lower than MAP incidence.
Estimating the impact of interventions
One potential use case for locally accurate risk maps of malaria incidence is the estimation of the impact of malaria control interventions by modelling counterfactual scenarios. An example of this is shown in figure 6, where we predicted what the malaria incidence would have been in 2019–2020 in the 14 districts (with an estimated population of 8 381 223) that have undergone sustained IRS since 2014, had they not received this intervention. The model predicted 1 062 216 cases (95% CI 696 620 to 1 660 893] in the IRS scenario and 7 235 816 cases (95% CI 4 862 569 to 10 963 248] in the modelled non-IRS scenario, suggesting approximately 6.2 million cases (95% CI 4.2 million to 9.3 million) were averted across the 24-month period. The difference between the estimated counterfactual incidence and estimated incidence under IRS was greater in districts in the north, where incidence is higher.

Predicted malaria incidence in 14 districts undergoing indoor residual spraying in 2019–2020 under (A) true IRS conditions and (B) counterfactual IRS conditions with no IRS. IRS, indoor residual spraying; PY, person-years.
Discussion
This study used routinely collected data from 74 health facilities to estimate, model and map malaria incidence and its uncertainty in Uganda. Our findings indicate that individual-level, high-quality patient data collected at a limited number of sentinel health facilities across a geographical area represent a viable avenue for generating high resolution maps of malaria risk with the potential for operational utility. Model performance in out-of-sample prediction was good, especially when predicting to health facilities in nearby parishes, as demonstrated through random cross-validation. As expected, the model performed less well at predicting to more distant locations with different environments, as demonstrated through spatial block cross-validation. This suggests that the maps we generated are less informative in areas distant and/or environmentally distinct from sentinel surveillance sites and that estimates are more accurate and precise in areas with a higher density of sites, particularly in the north and northeast of Uganda. The findings from this analysis underscore the potential that high-quality health facility data have for generating accurate, high-resolution maps of malaria risk efficiently and at a relatively low cost.
Over the past several years, the steady decline of malaria cases and deaths that has taken place since the 1990s has stalled, particularly in high burden countries such as Uganda.2 Given this, in combination with the heterogeneous nature of malaria transmission, NMCDs must have high-quality information to maximise limited resources by targeting vector control approaches and other interventions such as novel vaccines and chemoprevention and evaluating their impact. Contemporaneous maps of malaria risk represent a potential source of this information. At present, most malaria risk mapping is done using cross-sectional surveys capturing parasite prevalence, such as Malaria Indicator Surveys or Demographic and Health Surveys. These surveys are conducted infrequently (typically, every 3–5 years) and are limited in geographical scope. Furthermore, while parasite prevalence as a metric may be related to malaria burden, it has less programmatic relevance than more direct indicators such as malaria incidence.6 To compensate for this, methods to estimate incidence using cartographic tools linking parasite prevalence to incidence have been recently developed by the MAP.38 39 While these methods improve the operational utility of risk maps by converting prevalence to a more meaningful surveillance measure, they can lack both accuracy and precision because of the sparsity of underlying data and because the relationship between prevalence and incidence is poorly defined and inconsistent, especially in areas where transmission intensity is high.2 For this reason, a recent push by the WHO’s High Burden to High Impact initiative has focused on leveraging HMIS for surveillance and risk mapping.2 However, this comes with its own challenges. First, quality surveillance requires accurate diagnosis, yet only 38% of febrile children brought for care at a public health facility in sub-Saharan Africa received a diagnostic test in 2015–2019.2 Second, once cases are identified, they must be reported through the HMIS, yet reporting rates vary significantly and cases are often reported in aggregate, limiting the utility of the data because geographical information on the location of cases is lost.2 Third, even under conditions of high-quality HMIS data, translating raw case numbers into meaningful indicators of disease burden is challenging because catchment areas around health facilities are not well defined.
This study proposes potential solutions for each of these challenges. First, our dataset had high spatial and temporal resolution for much of Uganda, particularly in comparison with cross-sectional surveys typically used for risk mapping purposes. We continuously collected incidence data from 310 of the 7569 parishes across the country over a period of 2 years, representing 1 308 228 outpatients, 904 595 of whom were tested for malaria. The most recent (2018–19) Malaria Indicator Survey in Uganda, in contrast, was a one-time survey conducted in 320 clusters, testing malaria parasite prevalence status among 6626 children under 59 months.40 Second, we leveraged a network of enhanced HMIS sentinel sites that addresses many of the limitations associated with standard HMIS systems: data are at the individual patient level, diagnostic testing rates are high, and missingness of key variables is near-zero. While these improvements required some initial investment in training and quality control, maintaining this quality is relatively economical and ultimately the costs are low given the large gains in information. Finally, we translated these individual-level case data to accurate measures of monthly malaria incidence by using information on patients’ places of residence to estimate catchment area populations.17 Compared with modelling incidence as a function of parasite prevalence, this method is more direct and relies on fewer assumptions.
Our findings indicate that on a country-level, malaria burden may be under-reported by the HMIS: the model estimated approximately 12.5 million more cases in 2019–2020 than those reported by HMIS. There are several factors that may drive this discrepancy, including gaps in reporting by health facilities to the routine HMIS system. Furthermore, this comparison was for laboratory-confirmed diagnosis, which is remarkably high at MRCs but is likely much lower in other public health facilities. Countrywide estimated malaria incidence from our model was also higher than that estimated by the MAP, which relies on parasite prevalence surveys to estimate incidence. Given the prevalence-incidence relationship is especially unstable in high transmission settings such as Uganda, incidence from the MAP may be an underestimate.
While this study focused on Uganda, this method has the potential to improve malaria surveillance at an operational level in malaria endemic settings globally. Because malaria incidence is measured directly, continuously and locally at health facilities, barriers NMCDs face to obtain relevant estimates are lower than relying on a complex mathematical model built on sparse and expensive prevalence data. Measures of incidence can then be combined with publicly available remotely sensed data in order to extend these estimates to areas where sentinel sites are not present. The greater spread and higher density of sentinel surveillance sites that are included the more precise these estimates would be, since the model would be able to leverage spatial interpolation and rely less on extrapolation to distant and perhaps ecologically distinct regions. For example, we found that with an average distance of 170 km between high density sites, out of sample predictions were high and did not rely much on spatial covariates to maintain high accuracy. Harnessing sentinel site data to generate maps of risk has the added operational benefit of high temporal resolution, meaning that NMCDs can use these maps to track changes in burden over time and estimate the impact of control interventions by modelling counterfactual scenarios.
While sentinel surveillance may have substantial untapped potential, there are limitations in these data and the analysis presented here which are important to consider. First, health facility data are limited to information recorded for patients that visit that health facility. While our incidence estimates do adjust for relative care-seeking as a function of distance to the facility, we do not adjust for probabilities of care-seeking for reasons other than distance. However, if this were of interest, these data could be combined with survey data on care-seeking. For example, we conducted cross-sectional surveys in randomly selected households around 64 of these MRCs from November 2021 to March 2022. Of 4737 individuals that were treated for malaria in the last 6 months, 81% went to the MRC. Because these villages were very close to the MRC (and therefore travel time should be negligible), we could apply an additional assumption that our model captures only 81% of true cases in Uganda. This would further increase the gap between estimated cases and cases reported by the HMIS, suggesting that HMIS data may be substantially underestimating burden. Similarly, the beginning of the COVID-19 pandemic and the resulting lockdowns occurred during the study window, which may have impacted care-seeking, and therefore, underestimated cases captured at health facilities during the second half of the study period. However, an analysis from 2021 assessing the potential effect of the first year of the COVID-19 pandemic at UMSP sites found no association between the pandemic and malaria cases and non-malarial visits at health facilities.41 Second, despite being substantially less expensive than cross-sectional surveys, sentinel surveillance systems do require some investment compared with standard HMIS data, including additional time and labour associated with inputting individual-level patient data to a digital database. Furthermore, an initial investment is needed to accurately record where patients reside and to link these areas of residence to places on a map. Third, we rely on modelling assumptions that may be incorrect. For example, we rely on data from 74 health facilities in combination with covariate information to extrapolate malaria burden to the rest of the country, meaning that in areas with lower density of MRCs, our estimates had greater uncertainty. However, the relatively low cost of adding more sentinel surveillance sites could greatly diminish reliance on these modelling assumptions and vastly improve these maps across the entire country. Some MRCs contributed as few as 4 months of data; estimates derived from these catchments were likely to be less precise than others with more data but reflect the realities of practical implementation; for example, a programme may benefit from using such data a few months after initiation of data collection versus relying on less temporally and geographically relevant data. Finally, there is inherent uncertainty in the spatial layers used in this analysis. For example, the friction surface used to derive care-seeking probabilities requires underlying assumptions about modes of transportation and travel speeds in the population of interest. However, while absolute travel times may be incorrect, relative travel times (comparing one village to another) are likely stable and therefore can be used to estimate probabilities of seeking care.
Conclusions
This proposed risk mapping method may be of interest to NMCDs given the benefits of measuring and mapping malaria incidence locally and continuously. To establish a robust system to estimate and map malaria burden, local stakeholders could establish a network of high-quality HMIS surveillance sites. Although a larger number of sites would have greater operational benefit, local NMCDs may select the number and distribution of sites based on local need and factors influence decision-making (eg, if vector control interventions are typically implemented at the district level, 1 or 2 sites per district may suffice). At these sites, individual-level data on a few key indicators including demographics, place of residence and malaria diagnostics—all of which are standard patient information in many public health facilities—could be collected. Using information on patient residence, population denominators accounting for care-seeking may be estimated, or, alternatively and more simply, catchment areas could be defined including patients living immediately around the health facility where care-seeking can be assumed to be maximal. With this information, enhanced HMIS surveillance data can be used to generate high-quality measures of malaria incidence that can then be extrapolated to other areas of the country through simple spatial smoothing or by combining this information with spatial covariates. This proposed methodology represents a ‘best of both worlds,’ allowing for high-quality, local surveillance data to be collected and mapped contemporaneously at a low cost with minimal additional labour required. Risk maps generated using this method have the potential to be an essential tool for high burden countries around the globe as they aim to achieve targets towards control and elimination.
Data availability statement
Data are available in a public, open access repository. The datasets generated and/or analysed during the current study, in addition to sample code for model fitting, are available in the github repository, https://github.com/aeepstein/uganda_risk_map.
Ethics statements
Patient consent for publication
Ethics approval
This study involves human participants but this study is exempt from ethical review; all data are routinely collected and deidentified. This study uses data from health facilities routinely collected on outpatients.
Acknowledgments
We would like to thank the administration and staff at the Infectious Diseases Research Collaboration, and the HMIS officers and in-charges at each of the Malaria Reference Centers.
Supplementary materials
Supplementary Data
This web only file has been produced by the BMJ Publishing Group from an electronic file supplied by the author(s) and has not been edited for content.
Footnotes
Handling editor Alberto L Garcia-Basteiro
Contributors AE conceived of the study with input from BG, IR-B and SB. JFN led data collection, supported by IN and EVK, and with input from GD and MRK. IN and EVK managed the database with input from GD and JFN. AE led the analysis supervised by BG and IR-B, with additional statistical guidance from HS and SB. AE drafted the manuscript with support from BG and IR-B. All authors contributed to interpretation of the results and edited the manuscripts. All authors read and approved the final manuscript. AE is the guarantor and accepts full responsibility for the work and/or the conduct of the study, had access to the data, and controlled the decision to publish.
Funding This work was supported by the National Institutes of Health as part of the International Centers of Excellence in Malaria Research (ICMER) programme (U19AI089674). Funding for this work was also supported by the National Institute of Allergy and Infectious Diseases (F31AI150029).
Map disclaimer The inclusion of any map (including the depiction of any boundaries therein), or of any geographic or locational reference, does not imply the expression of any opinion whatsoever on the part of BMJ concerning the legal status of any country, territory, jurisdiction or area or of its authorities. Any such expression remains solely that of the relevant source and is not endorsed by BMJ. Maps are provided without any warranty of any kind, either express or implied.
Competing interests None declared.
Patient and public involvement Patients and/or the public were not involved in the design, or conduct, or reporting, or dissemination plans of this research.
Provenance and peer review Not commissioned; externally peer reviewed.
Author note The reflexivity statement for this paper is available in online supplemental appendix S1.
Supplemental material This content has been supplied by the author(s). It has not been vetted by BMJ Publishing Group Limited (BMJ) and may not have been peer-reviewed. Any opinions or recommendations discussed are solely those of the author(s) and are not endorsed by BMJ. BMJ disclaims all liability and responsibility arising from any reliance placed on the content. Where the content includes any translated material, BMJ does not warrant the accuracy and reliability of the translations (including but not limited to local regulations, clinical guidelines, terminology, drug names and drug dosages), and is not responsible for any error and/or omissions arising from translation and adaptation or otherwise.