Article Text

Abstract
Introduction The scope of the challenge of overweight and obesity (OAO) has not been fully realised globally, in part because much of what is known about the economic impacts of OAO come from high-income countries (HICs) and are not readily comparable due to methodological differences. Our objective is to estimate the current and future national economic impacts of OAO globally.
Methods We estimated economic impacts of OAO for 161 countries using a cost-of-illness approach. Direct and indirect costs of OAO between 2019 and 2060 were estimated from a societal perspective. We assessed the effect of two hypothetical scenarios of OAO prevalence projections. Country-specific data were sourced from published studies and global databases.
Results The economic impact of OAO in 2019 is estimated at 2.19% of global gross domestic product (GDP) ranging on average from US$20 per capita in Africa to US$872 per capita in the Americas and from US$6 in low-income countries to US$1110 in HICs.
If current trends continue, by 2060, the economic impacts from OAO are projected to rise to 3.29% of GDP globally. The biggest increase will be concentrated in lower resource countries with total economic costs increasing by fourfold between 2019 and 2060 in HICs, whereas they increase 12–25 times in low and middle-income countries. Reducing projected OAO prevalence by 5% annually from current trends or keeping it at 2019 levels will translate into average annual reductions of US$429 billion or US$2201 billion in costs, respectively, between 2020 and 2060 globally.
Conclusion This study provides novel evidence on the economic impact of OAO across different economic and geographic contexts. Our findings highlight the need for concerted and holistic action to address the global rise in OAO prevalence, to avert the significant risks of inaction and achieve the promise of whole-of-society gains in population well-being.
- Health policy
- Health economics
- Public Health
Data availability statement
Data are available upon reasonable request. Data requests to be made to the corresponding author.
This is an open access article distributed in accordance with the Creative Commons Attribution Non Commercial (CC BY-NC 4.0) license, which permits others to distribute, remix, adapt, build upon this work non-commercially, and license their derivative works on different terms, provided the original work is properly cited, appropriate credit is given, any changes made indicated, and the use is non-commercial. See: http://creativecommons.org/licenses/by-nc/4.0/.
Statistics from Altmetric.com
WHAT IS ALREADY KNOWN ON THIS TOPIC
The prevalence of overweight and obesity is rising rapidly around the world, leading to increases in non-communicable diseases along with high treatment costs and early mortality.
We previously identified dozens of studies on the economic impacts of overweight and obesity; however, most estimates are from high-income countries and use a health system perspective.
There are very few cross-country analyses and the existing country studies vary considerably in methodology, which makes it difficult to compare across countries.
WHAT THIS STUDY ADDS
This study provides the first country-specific global estimates of the economic impacts of overweight and obesity across heterogeneous contexts using a modelling framework with comparable and easily interpretable results.
The economic impact of overweight and obesity is significant across different geographic and economic contexts and is estimated to be an average of 2.19% of gross domestic product (GDP) across the 161 countries in the study.
If current trends continue, the economic impact is projected to rise to about 3.29% of projected GDP on average in 2060, with the biggest increase concentrated in lower resource countries.
Investments and targeted systemic actions to prevent and reduce overweight and obesity can have considerable effect in reducing the economic impact.
HOW THIS STUDY MIGHT AFFECT RESEARCH, PRACTICE OR POLICY
This study’s findings provide empirical support for strengthening global advocacy and mobilising stakeholder support for this urgent public health challenge.
These impact estimates—which can be updated over time—highlight the need to address the root causes of overweight and obesity through systemic solutions, rather than focusing on individual responsibility, and provide the impetus to encourage policy action.
Introduction
Globally, nearly two in five adults are now living with overweight and obesity (OAO).1 There is a common misconception that OAO is a public health challenge only for high-income countries (HICs).2 However, many of the countries with the highest rates of adult OAO are middle-income countries and the average annual increase in prevalence of OAO was over twice as high in low and middle-income countries (LMICs) as in HICs (2.1% and 1.0%, respectively) between 2000 and 2016.1
The rapidly growing prevalence of OAO is especially concerning because of its contribution to numerous non-communicable diseases (NCDs), including cardiovascular disease, cancer, Alzheimer’s disease and diabetes.3 There are over 5 million deaths each year from NCDs that are attributable to OAO, with 77% occurring in LMICs and over half occurring below the age of 70.4 OAO can also lead to poor outcomes from infectious diseases and as the world began to grapple with the spread of the SARS-CoV-2 virus, it quickly became clear that those living with OAO were at higher risk for severe disease, hospitalisation and death.5
OAO is a chronic, progressive and relapsing disease that presents a risk to health and is influenced by numerous environmental factors in addition to food and physical activity.6 There are several ways to assess OAO in individuals and populations. Body mass index (BMI) is commonly used for adults for whom overweight is defined as a BMI of 25 to 29.9 and obesity as a BMI of 30 and above. For children, overweight is defined as one to two SDs above the median weight for age and obesity as over two SDs above the median weight for age.1 OAO is more complex than simply exceeding a BMI threshold. Its causes include genetic risk, poor healthcare access, weight stigma, food and beverage marketing, sleep behaviour and more.7
The growing prevalence and chronic, multifactorial nature of OAO leads to far-reaching economic impacts that are felt in countries of all income levels around the world. Yet, much of what is known of these economic impacts come from HIC contexts with few cross-country analyses. Quantifying the magnitude of OAO’s economic impact helps to support prioritisation and resource allocation efforts and provides a crucial tool for national and international advocates to better communicate the scope of the challenge and to urge policymakers to respond with effective policies.8 Additionally, cross-country analyses of the economic impacts of OAO provide a more global picture and can help shift the narrative about the prevalence and causes of OAO and to understand the factors that can reduce it. For this reason, we developed a modelling framework to estimate the current and future economic impacts of OAO that can be applied to different national contexts around the world and be updated over time. We previously published the methodology and results for eight countries, with estimates for 2019 ranging from 0.8% of gross domestic product (GDP) in India to 2.4% in Saudi Arabia.9
This study expands on that earlier work by applying our modelling framework to 161 countries. This is the first country-specific global estimate of the economic impacts of OAO. The rising prevalence of OAO, its complex and chronic nature and its widespread health and economic impacts require a level of political and social commitment, funding and action that has not yet been demonstrated. These global estimates of the economic impacts of OAO highlight the need to address root causes through systemic solutions, rather than focusing on individual responsibility and will provide impetus for policy action.
Methods
We expanded and updated our initial estimates of the economic impacts of OAO from eight to 161 countries using a cost-of-illness approach.9 A full description of the methodology has been published previously and is provided in online supplemental appendix 1.9 Similar to our analysis of eight countries, we included the 28 OAO-related diseases (online supplemental appendix 1 table 1) from the Global Burden of Disease (GBD) Study with evidence of high BMI risk linkages.10 We estimate direct and indirect costs from a societal perspective (figure 1). Direct costs include medical costs and non-medical costs.11 12 Non-medical direct costs are economic costs, resulting from the process of seeking formal healthcare such as the cost of travel. We include the cost of travel for both patients and informal caregivers. Indirect costs include economic loss from premature mortality (deaths that could have been averted), missed days of work (absenteeism) and reduced productivity while at work (presenteeism). Our timeline of estimation begins in 2019 (the most recent year with available global OAO-attributable mortality data from the GBD study) and extends to 2060.
Supplemental material
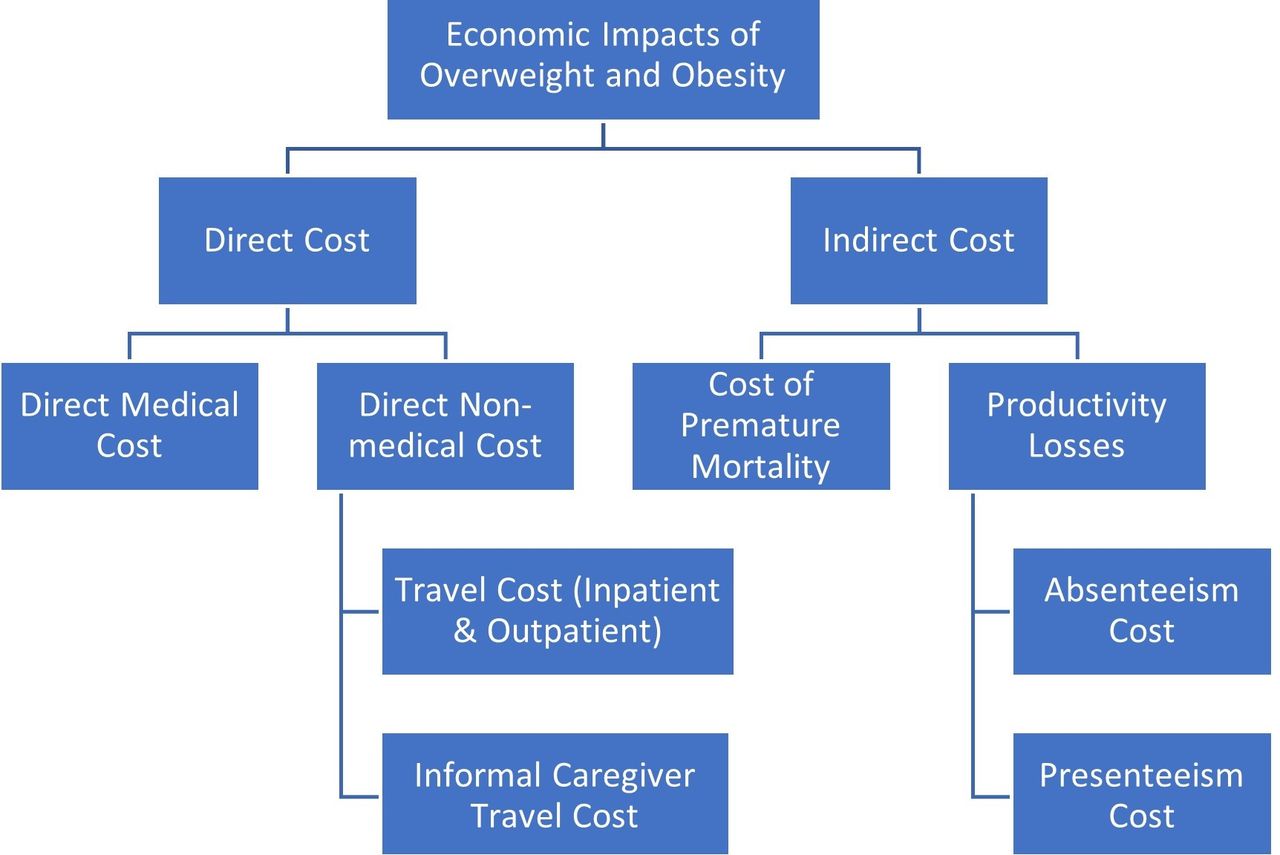
Cost components framework.
Country selection and data sources
Data availability is a key challenge in estimating the economic impact of OAO globally. We began with the 218 countries and territories identified in the World Bank’s income classification database. Thirty-one countries were excluded due to lack of morbidity and mortality data. Fifteen countries were excluded because they had implausible or no wage or macroeconomic data, five due to lack of employment data, three due to no GDP data, two due to no exchange rate data and one due to no healthcare expenditure data. Data for parameters used in the model were drawn from publicly available global databases and peer-reviewed literature and are listed in table 1.
Model summary: parameters and data sources
Data on OAO prevalence and OAO attributable deaths were drawn from the NCD Risk Factor Collaboration study13 and 2019 GBD Study,14 respectively. Data on national healthcare expenditure were drawn from the WHO Global Health Expenditure Database.15 Wage data were sourced from the International Labor Organization while GDP and employment rates were sourced from World Bank’s World Development Indicators database.16 17 Parameters such as population, life expectancy and background death rates were drawn from the United Nations Population Division.18 Model parameters including average inpatient visits, outpatient visits, absenteeism days and presenteeism rate for the population with OAO compared with healthy weight population were sourced from a scoping review of peer-reviewed studies. Country-specific data for these parameters were limited to a few countries. We explain in the relevant sections how we used the existing country-specific data for these parameters to estimate values for all other countries.
We aggregated the economic costs by country income group using the World Bank’s fiscal year 2021 classifications—HICs, upper middle-income countries (UMICs), lower middle-income and low-income countries (LICs) (see online supplemental appendix 2 table 1) and by WHO regions: Africa (AFR), the Americas (AMR), South-East Asian, Europe (EUR), Eastern Mediterranean (EMR) and Western Pacific (WPR) (see online supplemental appendix 2 table 2). The baseline year for estimating current impacts is 2019, the most recent year with available global OAO-attributable mortality data from the GBD study.
Estimation of direct costs at baseline (in 2019)
We calculated medical costs by multiplying the total health expenditure (THE) of a country in 2019 by the proportion of health expenditures attributed to OAO (the OAO-attributable fraction [OAF]). THE data were drawn from the Global Health Expenditure Database. The OAFs were drawn from an Organisation for Economic Co-operation and Development (OECD) study, which reports average OAFs between 2020 and 2050 for 52 countries. The 52 countries accounted for about 95% of global health expenditures in 2018. To estimate OAFs for countries not included in the OECD study and for future projections, a simple linear regression of OAFs on average OAO prevalence between 2020 and 20509 was conducted using the 52 countries in the OECD study. There is a significant positive association between OAF and OAO prevalence (β=0.121, F=21.74, p value<0.001). We opted to run the regression through the origin as the constant term was not significantly different from zero. The regression coefficient from the estimated equation OAF=0.1268395*OAO-prevalence was used to estimate the OAFs for all countries at baseline. We also apply the regression outputs to estimates of projected obesity prevalence to calculate OAFs in future years as explained subsequently. We then apply the OAF to THE to calculate OAO-related direct medical costs (DMC), as shown in Equation 1.
 (1)
(1)
The non-medical direct costs included in our estimates are travel costs for inpatient and outpatient visits and travel costs of informal caregivers (ICG) for inpatient care. Travel costs for inpatient (hospitalisation) and outpatient care were calculated by multiplying the average transport cost (ATC) per trip by the population with OAO and by the additional number of inpatient and outpatient visits experienced by the population with OAO, as shown in Equations 2 and 3.
 (2)
(2)
 (3)
(3)
where ATC is the average travel cost to and from health facilities;  and
and  are the average number of inpatient and outpatient consultations by the population with OAO compared with the healthy weight population, respectively; and Population with OAO = OAO Prevalence × Total Population. Informal Caregiver (ICG) Travel Costs were estimated for inpatient care and calculated the same as inpatient travel cost.
Where country-specific data was not available for the number of inpatient and outpatient visits, we applied the average number of visits from countries of the same income group. ATC was assumed to be the cost of gasoline to drive to a health facility in a private vehicle. This was calculated by taking the country-specific data for price per litre of gasoline from the World Bank’s World Development Indicators database and fuel economy from the International Energy Agency and assuming a distance of five kilometres to a health facility.19 The data on length of hospital stay by population with OAO compared with healthy weight population was limited and mixed, hence we included only the travel cost for informal caregivers to accompany hospitalised patients but excluded their lost income.
Estimating indirect costs at baseline (in 2019)
Economic losses from premature mortality are calculated as the number of years of potential life lost by individuals who died from OAO multiplied by the economic value of a life year. We estimate how many people in each age and sex cohort would have been alive in future years (based on life expectancy) if they had not died from OAO, while taking into account background death rates from other causes.20 We used GDP per capita as a proxy for the economic value of a life year. While other proxies have been used in estimating the cost of premature mortality, our choice of GDP per capita is driven by an intention to value the economic contribution of every individual in the society across the life course irrespective of employment status. As part of a sensitivity analysis for the upper bound of premature mortality cost, we adjust GDP per capita with a GDP multiplier for the gains in health or life expectancy that would have occurred in the absence of OAO-attributable deaths as developed by the Lancet Commission on Investing in Health.21 [online supplemental appendix 3] The economic cost of OAO-attributable mortality for each sex (S) and age (A) cohort included in the model is calculated (Equation 4) as the sum of annual costs from age of death (i=0) to remaining life expectancy (RLE) when no persons from the cohort would remain alive if they had not died from OAO, where VLY is the value of a life year proxied by GDP per capita in model year DY (death year) and Peoplei is the number of people who would have still been alive in year i had they not died of OAO.
 (4)
(4)
All future costs are assigned to the year in which death occurred, discounted at a rate of 3% per year to obtain the net present value, and summed up to give the total economic cost of OAO-attributable premature mortality.
Productivity losses due to absenteeism occur when employees miss work due to illness or health conditions related to OAO. To calculate lost productivity due to additional absenteeism among the working population with OAO we multiplied the employed population with OAO by the number of additional days of absenteeism experienced by those living with OAO and by the average daily wage (Equation 5).
 (5)
(5)
where Employed Pop. with OAO = Employment Rate × Working Age Pop. × OAO Prevalence; Additional Days Absent = Average number of additional days of absenteeism by working population with OAO compared with healthy weight working population.
Productivity losses due to additional presenteeism refers to reduced productivity while at work due to OAO-related impairment and disability. We calculate the cost of lost productivity due to additional presenteeism by multiplying the working population with OAO by the average daily wage and the rate of reduced productivity among employees with OAO compared with employees with healthy weight. The formula for presenteeism is the same as Equation 5, except using the rate of reduced productivity among employees with OAO instead of the additional days of absenteeism.
For countries without estimates of presenteeism and absenteeism, we assume that these parameters can be proxied by the level of labour protections in the country. To obtain this, we categorised countries into six groups based on their score on the six-point International Trade Union Confederation’s (ITUC) Global Rights Index, which examines worker protections.22 We took the interquartile range of existing estimates, divided this into six values, and then applied these values to the countries with the corresponding ITUC score. We assumed that countries with the highest score for worker protections will have higher absenteeism and lower presenteeism due to workers’ ability to take leave when ill. See Appendix 3 for more detail. We assume the same employment rates by BMI status due to mixed and inconclusive evidence on the differences in employment between population with OAO and healthy weight population.23–30
Estimating future costs
The projections of OAO’s economic impacts are an extension of the modelling approach used in the baseline estimation. We project the different model parameters up to 2060. Online supplemental appendix 1 table 3 shows the secondary sources of data for parameters for which existing long-term projections were found. Some parameters (number of inpatient and outpatient visits, absenteeism days, and presenteeism rate) were assumed to stay constant. While these parameters may vary over time, there is not adequate data to construct trends to predict future values. Instead, we conducted a sensitivity analysis calculating a lower bound using the lowest value identified and an upper bound using the highest value identified for absenteeism days, presenteeism rates, inpatient visits, and outpatient visits for all countries. We adjusted travel costs for inflation in the future using GDP deflator projections.
We modelled future estimates for parameters with no existing long-term projections (GDP, annual wages, OAO prevalence, OAF of health expenditures and OAO-attributable mortality). For future GDP, we extrapolated available historical average annual GDP growth rate to 2060. We applied a dampening effect to average annual growth rates to account for the expected slowing in GDP growth as countries grow their economies. The dampening factor was calculated as the difference in projected mean GDP growth rates for high-income, middle-income and LIC groups between 2010–2050 and 2050–2100 according to expert forecasts.31 For future wages, we applied average regional wage growth rates (computed by averaging country-specific annual rates of change [from historical wage data] of countries in the same World Bank region groups) to countries in the same region. Future estimates for obesity prevalence, obesity-attributable fraction of health expenditures and obesity-attributable mortality were modelled as described below.
Future OAO prevalence: we employed a regression-based approach to estimate future OAO prevalence globally. We used the historical trend of country-level OAO prevalence estimates from 1975 to 2016 from the NCD Risk Collaboration group.32 The data set provides estimates separately for adult (above 20) men, adult women, boys under 20 years of age and girls under 20. Our projections are done for these four groups separately. Following the approach of Ward et al,33 we used multinomial regressions to predict the prevalence of BMI categories for each group. This ensures that the sum of the prevalence of all categories does not exceed 100%, allows for estimation on non-linear trends and movement of individuals between BMI categories. For adults, the BMI categories modelled were healthy weight, overweight, moderate obesity and severe obesity. For those below age 20, modelled BMI categories were underweight, healthy weight, OAO. We assume that trends in other variables such as urbanisation and population changes (that change with time) are implicitly controlled for by having time as the predictor variable. Online supplemental appendix 2 table 3 shows the OAO prevalence estimates for 2019 and 2060.
Future OAF of health expenditure: to predict the future OAF of health expenditures, as earlier explained, we ran a simple linear regression of the 52 OAFs identified in the OECD study on OAO prevalence.34 The regression coefficient together with projected OAO prevalence estimates was then used to generate future estimates of OAFs.
Future OAO-attributable mortality: we calculated all-cause mortality (total deaths) from 2020 to 2060 using the annualised rate of change of projections for OAO-related disease mortality drawn from Foreman and colleagues.35 We then used relative risks sourced from the GBD study36 and projected OAO prevalence to calculate the population attributable fraction (PAF) of OAO mortality for each future year by sex, cause and age group. OAO-attributable deaths for projected years by sex, age group and cause were calculated by multiplying the PAFs by projected all-cause mortality.
Hypothetical scenarios: we also estimated the economic impact of OAO based on two hypothetical scenarios of lower OAO prevalence. The two hypothetical scenarios are: (1) a 5 percentage point reduction in projected obesity prevalence (by sex and age group) for each year and (2) holding obesity prevalence (by sex and age group) constant at 2019 levels. These hypothetical scenarios are based on the evidence that no country has been able to reduce obesity prevalence37 and there have been indications of stabilisation in only a handful of countries.34
Currency conversions
All costs are in 2019 constant US dollars. Data for GDP per capita, wages and travel costs were collected in local currency units where possible, adjusted for inflation to 2019 values, and converted to USD using average annual exchange rates. Purchasing power parity (PPP) costs were also calculated, using PPP conversion factors drawn from the World Bank World Development Indicators Database.16 38 Results in PPP are available in online supplemental appendix 2 tables 4 and 5.
Role of the funding source
Novo Nordisk, who provided the unrestricted educational grant received by World Obesity Federation that supported this work, had no role in the study design, data collection, data analysis, data interpretation or writing of the report. All authors had full access to the data and had final responsibility for the decision to submit for publication.
Results
Current economic impacts of OAO
OAO costs per capita by income group range from US$6 for LICs to US$1546 in HICs. OAO’s impact on GDP globally is a loss of 2.19% across countries, ranging from 0.87% of GDP in LICs to 2.46% in HICs (table 2). By WHO region, OAO costs per capita range from US$20 in the AFR region to US$872 in the AMR region, and as a percentage of GDP ranging from 1.12% in the AFR region to 2.99% in the AMR region (table 3). Figure 2 shows the economic impacts of OAO per capita globally and figure 3 shows total impacts as a percentage of GDP globally.
Current burden results, 2019 (in 2019 USD), by country income group
Current burden results, 2019 (in 2019 USD), by WHO region
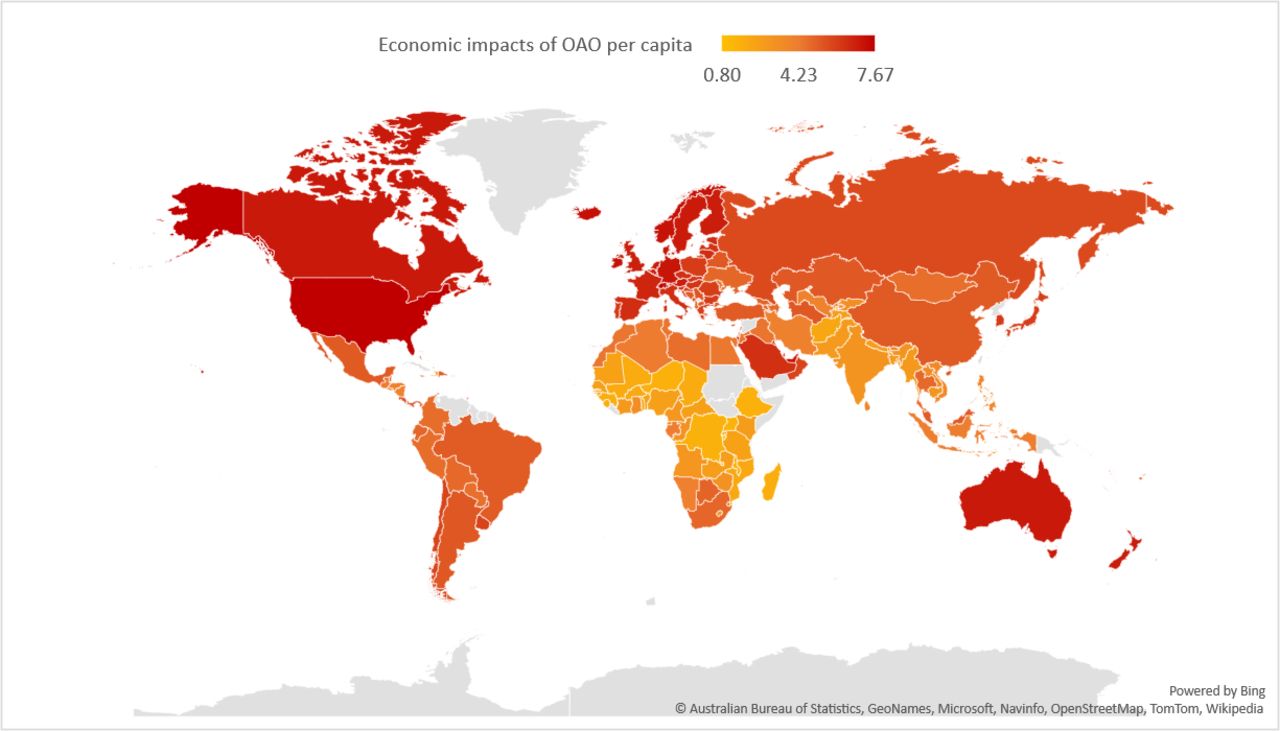
Economic impacts of overweight and obesity per capita in 2019 (in 2019 USD) *OAO, overweight and obesity. *Data displayed in map scaled using natural logarithm.
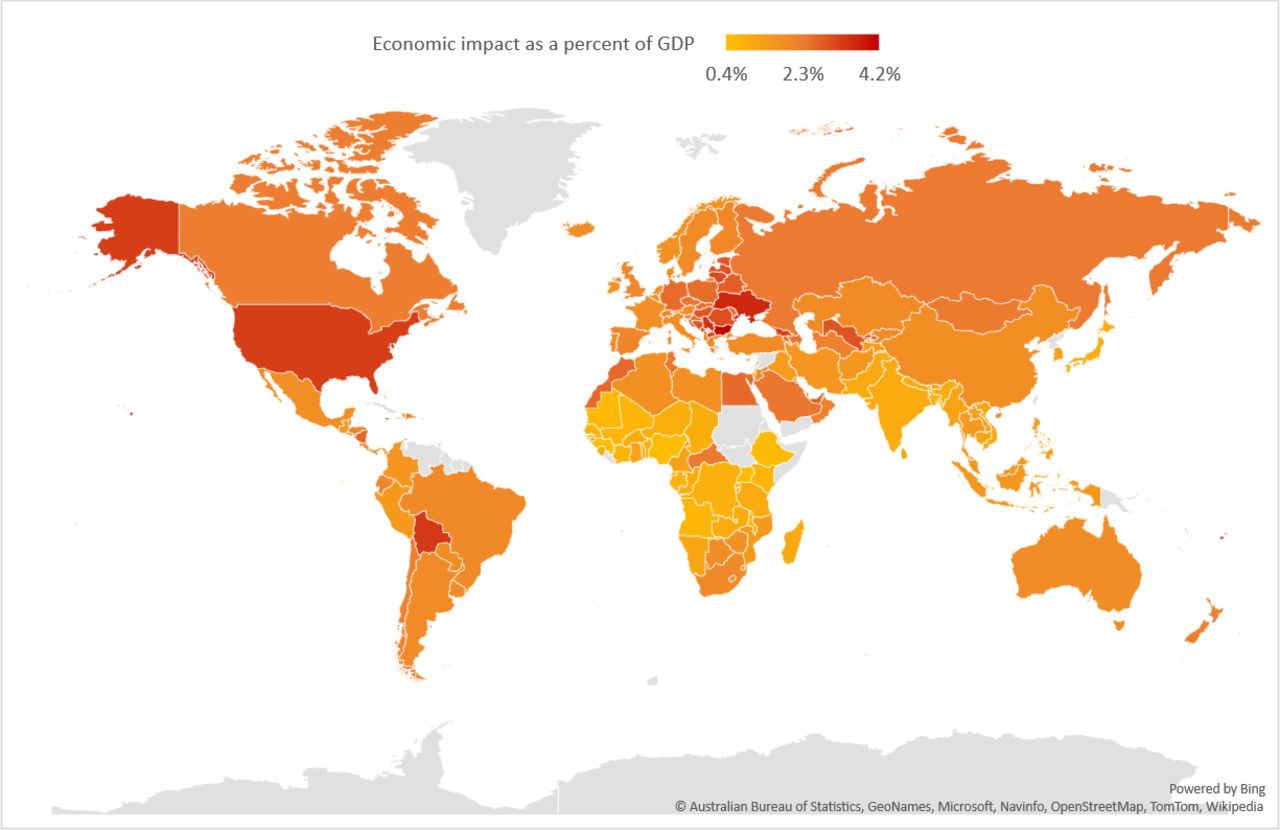
Economic impact of overweight and obesity as per cent of GDP in 2019 (in 2019 USD). GDP, gross domestic product.
Tables 2 and 3 show the components of OAO’s economic impact by income group and region, respectively. Medical costs make up 99.8% of direct costs on average across all countries. The cost of premature mortality constitutes a substantial proportion of indirect costs (69.1% on average) across all countries. We did a sensitivity analysis using a multiple of country GDP to value life years, following recommendations from the Lancet Commission on Investing in Health. We used their regional and income group-specific estimates translating the value of gains in life expectancy into a multiplier of GDP per capita.39 This results in total costs of 2.90% of GDP on average across countries, ranging from 1.71% of GDP for LICs to 3.10% in UMICs (table 3). These results, which place a higher value on premature mortality costs, represent a 32% increase in total costs from estimates without the GDP multiplier on average across countries. From sensitivity analysis using the lowest and highest values identified for absenteeism, presenteeism, inpatient visits and outpatient visits, respectively, the economic impact of OAO in 2019 is 1.91% and 2.49% of global GDP.
Future economic impacts of OAO
Tables 4 and 5 and figures 4 and 5 summarise estimated future costs by income groups and region based on projections of model parameters to 2060. Figure 6 shows current and future costs and prevalence for each individual country. OAO’s economic impact across all countries is projected to increase due to rising OAO prevalence, population changes and economic growth. As a percentage of projected GDP, total economic impact in 2060 is estimated to be an average of 3.29% across all countries, ranging from 1.38% in LICs to 3.80% in HICs and from 2.11% in AFR to 5.41% in EMR. Between 2020 and 2060, OAO’s economic impact is projected to triple in HICs and to increase by 23-fold in UMICs. By region, between 2020 and 2060, economic impact is expected to more than double in EUR and by 26-fold in WPR. The sensitivity analysis using the lowest and highest values identified for absenteeism, presenteeism, inpatient visits and outpatient visits, respectively, results in an estimated economic impact of OAO in 2060 of 3.16% and 3.44% of global GDP. The full results of the sensitivity analysis by income group and WHO region are shown in online supplemental appendix 2 tables 6 and 7.
Economic impacts of OAO, baseline projections for 2020, 2030 and 2060 (in 2019 USD), by income group
Economic impacts of OAO, baseline projections for 2020, 2030 and 2060 (in 2019 USD), by WHO region
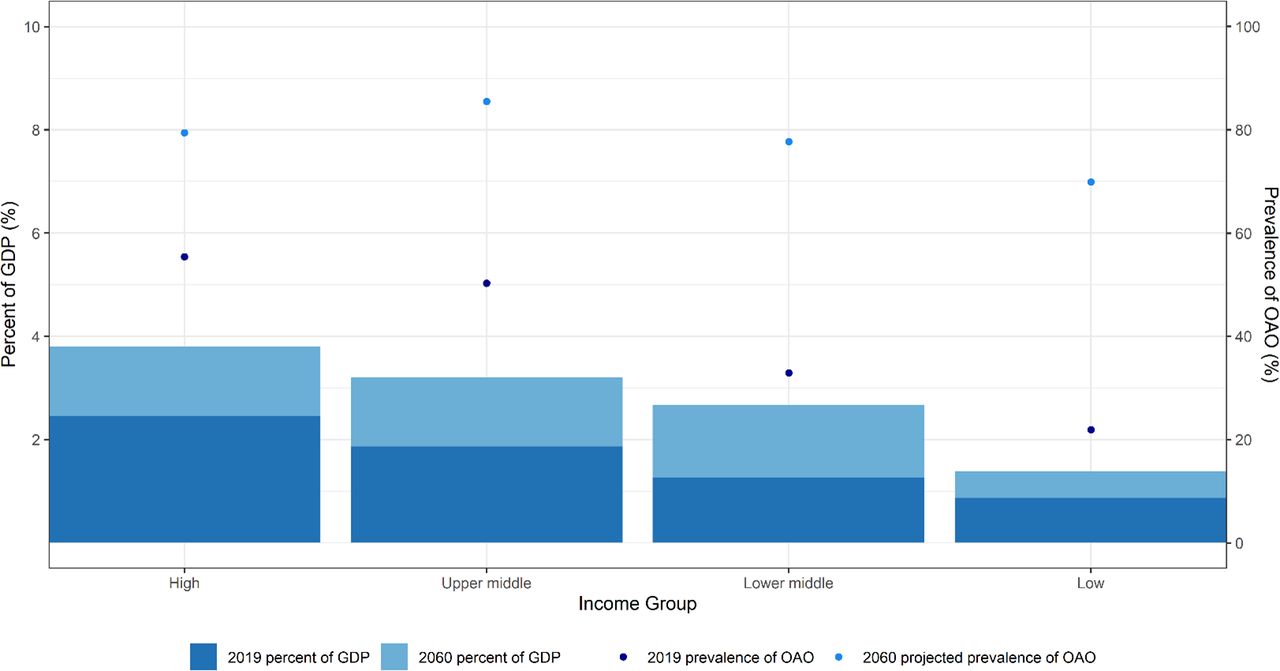
Economic impacts of overweight and obesity as per cent of GDP and obesity prevalence by income group, 2019 and 2060

Economic impacts of obesity as a per cent of GDP and obesity prevalence by region, 2019 and 2060. GDP, gross domestic product; OAO, overweight and obesity.
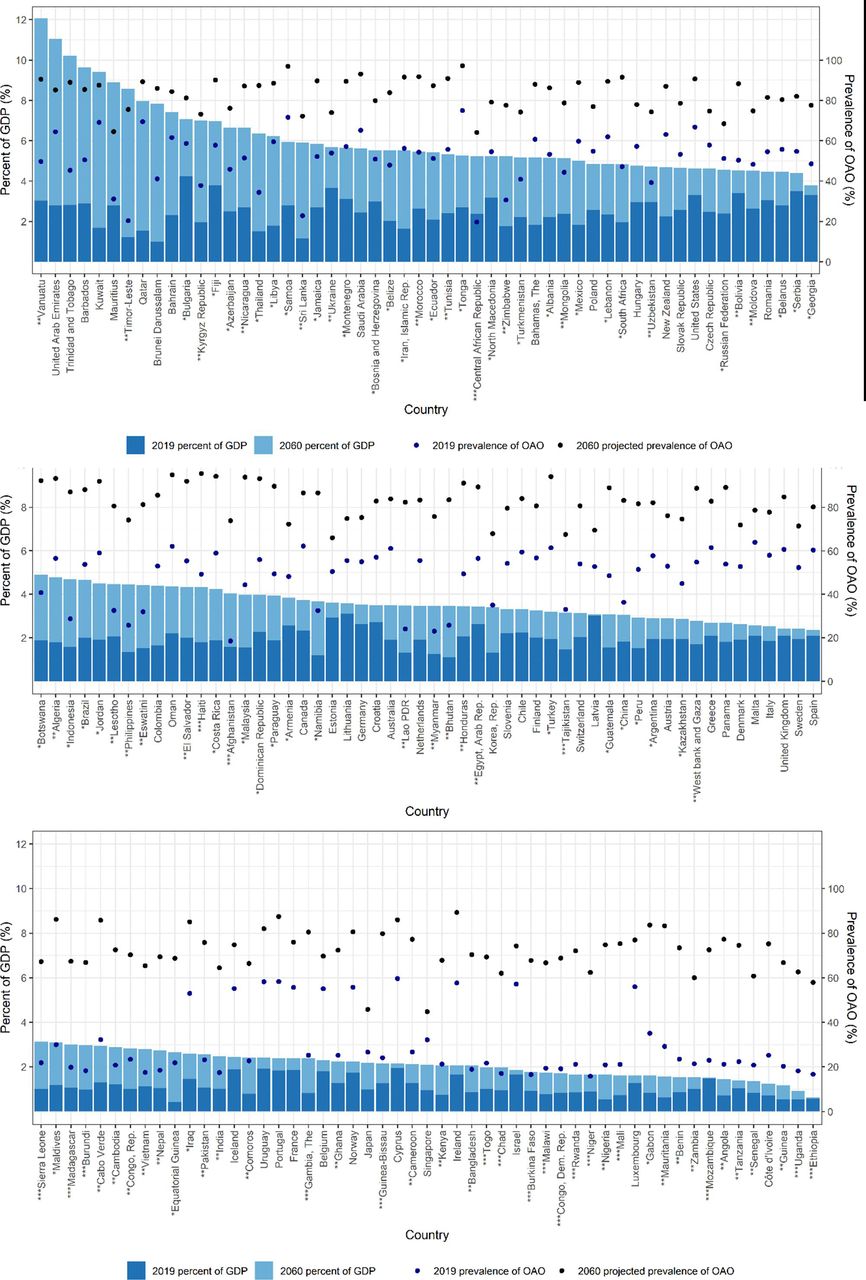
Economic impacts of overweight and obesity, 2019 and 2060, by country. *Upper middle-income. **Lower middle-income. ***Low-income. GDP, gross domestic product; OAO, overweight and obesity.
Hypothetical OAO prevalence scenarios
Our first hypothetical scenario assumes a 5 percentage point reduction in OAO prevalence from the projected levels (by sex and age). Using this prevalence scenario with all other projected parameters remaining unchanged, we estimate a slight reduction in OAO’s economic impact trajectory compared with baseline projections. As a percentage of projected GDP, total costs in 2060 will range from 1.29% in LICs to 3.63% in HICs and 2.01% in AFR to 5.22% in EMR (figure 7). Compared with baseline projections, this scenario implies an average annual savings of approximately 6%–11% across all income groups and 5%–9% across WHO regions between 2020 and 2060 (table 6).

Cost as a per cent of GDP in baseline, 5% reduction, and constant prevalence scenario by region. AFR, Africa; AMR, the Americas; EMR, Eastern Mediterranean; EUR, Europe; GDP, gross domestic product; SEA, South-East Asian; WPR, Western Pacific.
Annual cost reductions in hypothetical scenarios 1 and 2 between 2020 and 2060
Consistent with the WHO NCD Global Monitoring Framework target #7 to halt the rise in OAO,40 our second hypothetical scenario projects economic impacts while holding OAO prevalence constant. As a percentage of projected GDP, total costs in 2060 will range from 0.64% in LICs to 2.91% in HICs and 1.20% in AFR to 4.40% in EMR, translating to average annual savings of approximately 13%–34% across all income groups and 13%–35% across WHO regions compared with baseline projection costs (table 6 and figure 7).
Discussion
This study is the first to estimate the direct and indirect economic impacts of OAO globally. We estimate an economic impact (as a percentage of GDP) of 2.19% on average in 2019 across the 161 countries in the study, ranging from 0.42% in Equatorial Guinea to 4.25% in Bulgaria. For context, annual GDP growth globally was 3.03% in 2018 and 2.33% in 2019,41 underscoring the significant economic impact of OAO globally. In terms of world regions, total economic loss per capita in 2019 ranges from US$20 in AFR to US$872 in AMR. Similarly, for income groups, the total economic loss per capita in 2019 ranges from US$6 in LICs to US$1110 in HICs. This reflects the wage and GDP differences in these regions.
When total cost is expressed in terms of GDP, the gap between LICs and HICs shrinks significantly with total cost ranging from 0.87% of GDP in LICs to 2.46% of GDP in HICs and from 1.12% in AFR to 2.99% of GDP in AMR. These estimates increase when gains in life expectancy from avoiding premature mortality are accounted for, making them less conservative, as done by our sensitivity analyses using GDP multipliers. We estimate that total economic impact in 2019 rises to 2.90% of GDP on average ranging from 1.71% in LICs to 3.10% in UMICs and 2.50% in WPR to 3.49% in AMR when including a GDP multiplier. Hence, the economic impact of OAO becomes even more significant when life expectancy gains from OAO-attributable premature deaths that could have been averted are accounted for.
Our results are in a comparable range to the few existing cross-country estimates. A 2019 OECD study estimates that GDP in 36 OECD countries will be lower by an average of 3.26% between 2020 and 2050 due to OAO.34 Our study finds an average economic impact of 3.11% of GDP over those 30 years across those OECD countries. Our estimates are slightly lower as we do not include cost of employment rate reductions and early retirement costs due to data limitations in LMICs.
Direct costs account for about 12–39% of total costs across income groups and 8–31% across WHO regions. On the other hand, indirect costs of OAO account for 61%–88% of total cost across income groups and 59–92% across WHO regions, representing the larger proportion of total costs. This implies that most existing studies of OAO’s economic impact,9 42 which are based on the healthcare perspective and, therefore, estimate only the direct healthcare cost of OAO capture a small fraction of the societal cost.
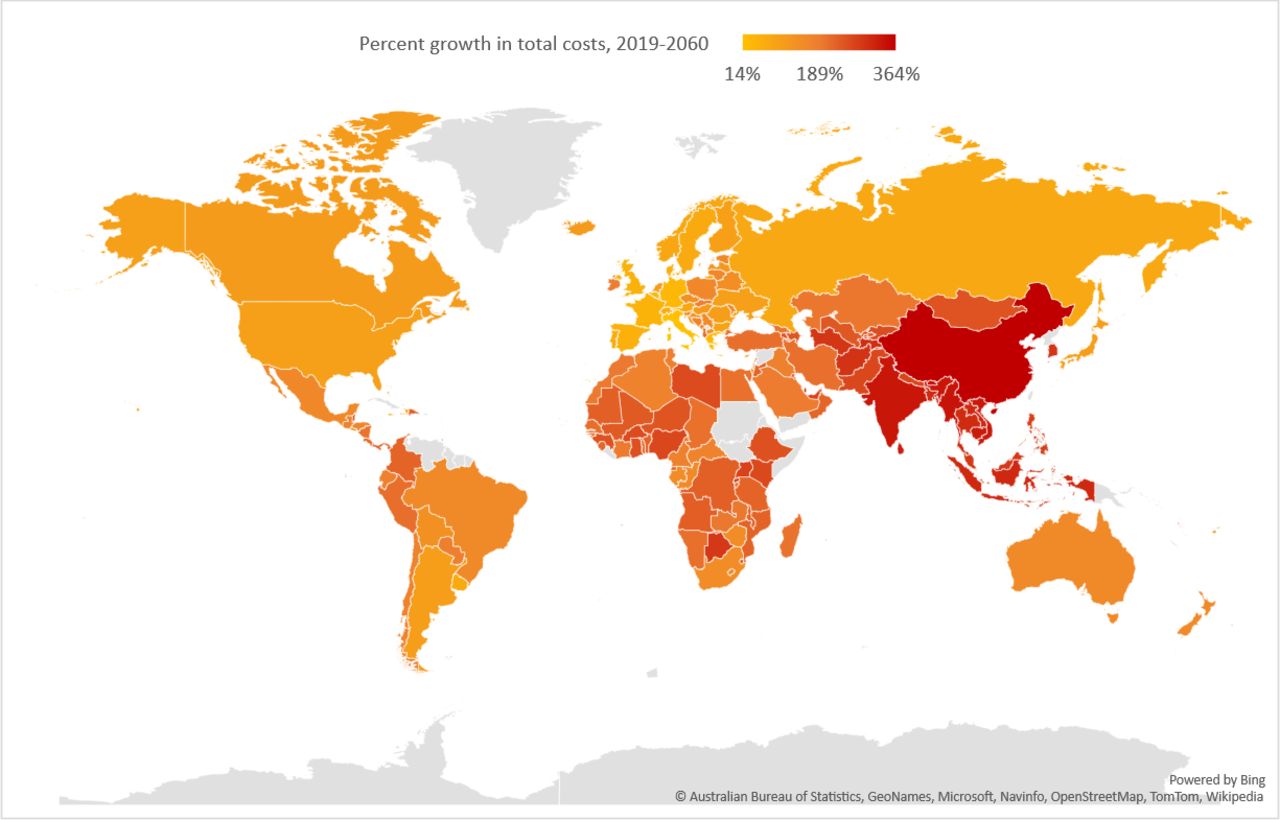
This study estimates the trajectory of OAO’s economic impacts between 2019 and 2060 if historical trends in OAO prevalence, GDP and wages and demographic trends such as population and life expectancy continue in the future. OAO can be altered with sufficient policy and private sector attention to reduce obesogenic factors in the environment. If current trends are allowed to continue, economic impacts of OAO are estimated to rise to an average of 3.29% of GDP globally on average in 2060; with the biggest increase in future economic impacts being concentrated in lower resource countries, as shown in figure 8. Total economic costs increase by fourfold between 2019 and 2060 in HICs, whereas they increase 12–25 times in LICs, LMICs and UMICs.

Percent growth in total economic impacts of OAO between 2019 and 2060. *Data displayed in map scaled using natural logarithm. OAO, overweight and obesity.
Our hypothetical scenarios demonstrate that a reduction in OAO prevalence can result in lower economic impacts. A 5% reduction in projected prevalence between 2020 and 2060 will result in about US$429 billion in annual savings on average globally. A scenario that halts the projected rise in OAO prevalence at 2019 levels would result in about US$2.20 trillion in annual savings on average globally. Hence investments and targeted systemic actions to prevent and reduce OAO can have considerable positive implications for improved global health and economies.
The limitations of this study include the data limitations expected with attempting a global analysis of this scope. We produced results for 161 countries and made plausible assumptions about key parameters. For instance, we assumed the same values for absenteeism and presenteeism in countries with the same labour protections ratings although we recognise there are important variations in labour market behaviour across countries. For GDP and wages, which represent the base of our costing, we extrapolate average growth rate from historical data to 2060 assuming historical trends will continue. However, this simple approach does not fully account for other factors that influence GDP and wages, such as educational trends and government policies. Other important direct non-medical costs such as food and lodging during inpatient care, and home modifications were not included in this study as there are no reliable data from which to develop global cross-country estimates. Similarly, we did not include other indirect costs such as unemployment, long-term disability and early retirement costs, which are difficult to estimate for data-limited country contexts that were not included in our analysis.43 This study provides novel evidence on the economic impact of OAO across different economic and geographic contexts. The methodology allows for comparison across these different contexts and provides empirical support for strengthening global advocacy and mobilising stakeholder support for this urgent public health challenge. Also, the clear and replicable methodology allows data inputs to be selected and adjusted by country stakeholders as needed. Future research should focus on generating more evidence on input parameters especially in LMIC settings. There is also value in country and region-specific return on investment studies, so that governments can make evidence-based decisions on how to reduce or halt OAO prevalence, provide care for their populations with OAO and reduce future economic impacts.
The COVID-19 pandemic has demonstrated the erosion of the artificial demarcation between NCDs and infectious diseases and revealed the breadth of health risk faced by people living with OAO. The findings of this study highlight the need for urgent, concerted and holistic action to address the global rise in OAO prevalence. Such actions could help avert the significant risks of inaction and to achieve the potential promise of whole-of-society gains in population well-being, including reduced mortality, economic gains and improved resilience to disease outbreaks. These findings also provide crucial evidence that can be used as an important advocacy tool for shifting the narrative from personal responsibility to increased systemic investments and integrated approaches to addressing this global public health challenge.
Data availability statement
Data are available upon reasonable request. Data requests to be made to the corresponding author.
Ethics statements
Patient consent for publication
Ethics approval
Not applicable.
Acknowledgments
The authors are grateful to the members of the Cost of Overweight and Obesity Advisory Group who provided important feedback through the course of this research: Dr. Kelly Brownell (World Food Policy Center, Duke University), Dr. Soewarta Kosen (National Insitute of Health Research and Development, Indonesia), Dr. Tim Lobstein (University of Sydney, World Obesity Federation), Dr. Alice Achieng Ojwang (Technical University of Kenya), Dr. Juan A. Rivera (National Institute of Public Health, Mexico), Dr. Franco Sassi (Imperial College London), and Dr. Meera Shekar (World Bank). We also acknowledge Lillian Morrell and Elizabeth LudwigBorycz for excellent research assistance.
References
Supplementary materials
Supplementary Data
This web only file has been produced by the BMJ Publishing Group from an electronic file supplied by the author(s) and has not been edited for content.
Supplementary Data
This web only file has been produced by the BMJ Publishing Group from an electronic file supplied by the author(s) and has not been edited for content.
Footnotes
Handling editor Lei Si
Twitter @rachelnugent
Contributors RN and JR conceived the study. AO, RN, GS contributed to methodology development and writing of the original draft of the manuscript. AO conducted data analysis. GS conducted literature search and data collection. JP provided project management. All authors contributed to interpretation of results and review of the manuscript. RN acts as the guarantor of the study, accepting full responsibility for the work and the conduct of the study, had access to the data, and controlled the decision to publish.
Funding Support for this work came from World Obesity Federation funds which include an unrestricted educational grant [Grant Number 46] from Novo Nordisk. Novo Nordisk was not involved in the conception and design of the study methodology or in the analysis and interpretation of results.
Map disclaimer The inclusion of any map (including the depiction of any boundaries therein), or of any geographic or locational reference, does not imply the expression of any opinion whatsoever on the part of BMJ concerning the legal status of any country, territory, jurisdiction or area or of its authorities. Any such expression remains solely that of the relevant source and is not endorsed by BMJ. Maps are provided without any warranty of any kind, either express or implied.
Competing interests AO, RN, GS report the research was supported by a grant from the World Obesity Federation which received an unrestricted grant from Novo Nordisk; JP reports grants from Novo Nordisk, during the conduct of the study; JR reports grants from Novo Nordisk, during the conduct of the study; JW reports grants, personal fees and consultancy fees to his institution from AstraZeneca and Novo Nordisk, personal fees and consultancy fees paid to institution from Boehringer Ingelheim, Napp, consultancy fees paid to institution from Astellas, Janssen, Mundipharma, Lilly, Sanofi, Saniona, Rhythm Pharmaceuticals, and Wilmington Healthcare, outside the submitted work.
Patient and public involvement Patients and/or the public were not involved in the design, or conduct, or reporting, or dissemination plans of this research.
Provenance and peer review Not commissioned; externally peer reviewed.
Supplemental material This content has been supplied by the author(s). It has not been vetted by BMJ Publishing Group Limited (BMJ) and may not have been peer-reviewed. Any opinions or recommendations discussed are solely those of the author(s) and are not endorsed by BMJ. BMJ disclaims all liability and responsibility arising from any reliance placed on the content. Where the content includes any translated material, BMJ does not warrant the accuracy and reliability of the translations (including but not limited to local regulations, clinical guidelines, terminology, drug names and drug dosages), and is not responsible for any error and/or omissions arising from translation and adaptation or otherwise.