Article Text

Abstract
Introduction Marriage, divorce and fertility are declining in Japan. There is concern that the COVID-19 pandemic may have accelerated the decrease in marriages and births while increasing the number of divorces. Changes in partnership behaviours and fertility have significant implications for mental health, well-being and population demographics.
Methods Japanese vital statistical data were collected for December 2011–May 2021. We used the Farrington algorithm on the daily numbers of marriages, divorces and births (per month) in order to determine whether any given month between January 2017 and May 2021 had a significant excess or deficit. Analyses were conducted at the national and regional levels.
Results During the pandemic, significant deficits in the national number of marriages were noted in January 2020, April 2020, May 2020, July 2020, September 2020 and April 2021. Regional marriage patterns reflected national trends. Divorces were noted to be in deficit during April 2020, May 2020 and May 2021 at the country level. Regional analyses mirrored national divorce trends with the exception of Shikoku, which showed no deficits during the pandemic. Significant deficits in the number of total births were noted in December 2020, January 2021 and February 2021. Regionally, birth deficits were concentrated in Chubu, Kansai and Kanto. After the start of the pandemic, no significant excesses in marriages, divorces or births were noted at the national or regional level.
Conclusions Marriages and divorces declined during the pandemic in Japan, especially during state of emergency declarations. There were decreased births between December 2020 and February 2021, approximately 8–10 months after the first state of emergency, suggesting that couples altered their pregnancy intention in response to the pandemic. Metropolitan regions were more affected by the pandemic than their less metropolitan counterparts.
- COVID-19
- Epidemiology
- Health policy
- Public Health
Data availability statement
Data are available in a public, open access repository. All data relevant to the study are included in the article or uploaded as supplemental information. Marriage, divorce and birth data are openly available in the Ministry of Health, Labour and Welfare of Japan (https://www.mhlw.go.jp/toukei/list/81-1a.html). Population data from the Basic Resident Register are openly available online (https://www.e-stat.go.jp/stat-search/files?page=1&layout=datalist&toukei=00200241&tstat=000001039591&cycle=7&tclass1=000001039601&tclass2val=0).
This is an open access article distributed in accordance with the Creative Commons Attribution Non Commercial (CC BY-NC 4.0) license, which permits others to distribute, remix, adapt, build upon this work non-commercially, and license their derivative works on different terms, provided the original work is properly cited, appropriate credit is given, any changes made indicated, and the use is non-commercial. See: http://creativecommons.org/licenses/by-nc/4.0/.
Statistics from Altmetric.com
WHAT IS ALREADY KNOWN ON THIS TOPIC
There is concern that the COVID-19 pandemic will decrease marriages and fertility and increase divorces in Japan.
WHAT THIS STUDY ADDS
Scattered deficits in marriage were noted throughout the pandemic, and divorces decreased transiently during state of emergency declarations.
Births decreased approximately 8–10 months after the first state of emergency (December 2020–February 2021).
HOW THIS STUDY MIGHT AFFECT RESEARCH, PRACTICE AND/OR POLICY
The pandemic may have altered pregnancy intentions among couples during the state of emergency.
Metropolitan regions were more affected than their less metropolitan counterparts, and thus may need additional support to prevent these changes.
Introduction
For the past several decades, the marriage rate in Japan has been gradually declining, having been halved from 10.0 per 1000 individuals in 1970 to 4.8 in 2019.1 Over the same period, the divorce rate peaked at 2.30 per 1000 in 2002, at which point it began a concurrent descent with the marriage rate, dipping to 1.69 in 2019.2 Similarly, Japan’s total fertility rate reached a trough in 2005 at 1.26 births per woman, slightly rebounded to 1.45 in 2015, and has since declined to 1.36 in 2019.3 During the pandemic, the Japanese media has brought significant attention to the recent drop in marriages and births between 2019 and 2020: marriages decreased by more than 12%, representing the steepest year-on-year change since 1950.4 5 These articles posit that the pandemic is responsible for many weddings being postponed, while others have been foregone entirely due to financial hardship. Similar articles6 7 suggest that COVID-19 may also be responsible for a worldwide increase in divorces triggered by pandemic-related stress and lockdowns, though divorces decreased roughly 7% in Japan between 2019 and 2020.4 Births decreased 2.9% between 2019 and 2020, but a 14.6% drop was noted between January 2020 and 2021.8
Many factors, mostly economic, are known to affect marriage, divorce and fertility rates, but significant precedent also exists for natural phenomena and other crises. After the 11 March 2011 earthquake and tsunami in Japan, marriages and births were less than predicted during the following year.9 10 Historically, decreased births were noted in Japan 9 months after the 1918 influenza pandemic.11 Taken together, prior research on the effects of natural disasters in Japan suggests that economic fallout and disrupted social environments lead to decreased marriages and births,9 in line with prior theories on the roles of stress and economic conditions with coupling behaviour.12 Similar research has supported the notion that natural disasters, infectious disease outbreaks, and terrorism can increase marriage rates,12–14 decrease divorce rates,15 16 and increase fertility,12 17–19 although some reported contrary findings: decreased marriage rates,20 21 increased divorce rates,12 13 and decreased fertility.18 22 These mixed results can be explained by the variable interaction between stress, attachment and economic effects for any given country and crisis. Acute crises may lead to increased social stress, interpersonal tension and economic fallout, yielding foregone or delayed marriages and fertility.12 20 Contrastingly, the stress of lifechanging events can paradoxically bring people closer together, as suggested by attachment theory, leading to increased marriages and fewer divorces.12 The unique circumstances of any given crisis, especially socioeconomic factors at both the individual and national levels, dictate which of these effects predominate. In a high-income country where marriage and fertility rates are already on the decline such as Japan, the effect of economics has previously been shown to be a driving factor of coupling behaviour.23 Notably, prior research has focused on acute crises, whereas the COVID-19 pandemic is a uniquely chronic event, so effects on marriage, divorce and fertility may experience multiple phases.24
COVID-19 and Japanese governmental countermeasures, such as states of emergency, have resulted in significant economic damage and unemployment,25 increased social isolation and loneliness,26 27 and increased rates of poor mental health and suicide.28–30 With respect to relationships, COVID-19 serves as a source of external stress and uncertainty that threatens the strength of partnerships,31 and decreases in the rates of partnered sexual activity have already been documented in Japan.32 Research at the state- and city-levels in the USA has found that marriage and divorce decreased during the early stages of the pandemic.24 33 Fertility research during the early phases of the pandemic has found pandemic-associated drops in fertility in several countries,34–36 though there is significant heterogeneity and analysis of early Japanese data (until November 2020) showed no significant birth deficits.34
The association between marriage and health is well established: compared with singles, married persons and those in relationships are healthier,37–39 report better mental health and life satisfaction,40 and have decreased mortality.41 Similarly, those in relationships have been found to be less susceptible to COVID-19-related anxiety, depression and isolation than their unpartnered counterparts.27 42 On the flip side, divorce has been shown to negatively impact the well-being of both adults and their children.43 Decreases in marriage and increases in divorce have profound public health consequences in the long run: single-person households are more prone to poverty, especially among never-married and divorced elderly women, have decreased access to stable caregiving in old age, experience lower rates of well-being, especially among older men, and suffer from increased rates of social isolation.44–46 Furthermore, decreased marriage rates and increased divorce rates are negatively correlated with fertility,47 48 suggesting that changes in partnering behaviour during the COVID-19 pandemic may further exacerbate declining fertility.
Given Japan’s rapidly ageing population and declining birth rate, external fertility shocks have the potential to affect the population structure of Japan in the long run. In 2020, approximately 840 000 babies were born in Japan, 3 years ahead of the projected drop below 850 000.4 According to official projections, those aged 65 years and older will comprise 33.3% of Japan’s population in 2036, as compared with 26.6% in 2015.49 Decreased fertility has been recently recognised as an issue of global health concern, especially in middle-income and high-income countries.50 51 In the setting of an ageing population, further decreases in an already low birth rate threaten social security pension systems and universal health coverage, which are sustained by taxation of working-aged individuals.50–53 Furthermore, an increased ratio of elderly to non-elderly persons will result in increased strain on healthcare systems and exacerbate physician shortages.54 These demographic changes are exemplified by Japan,51 and thus it serves as a worthy case study of what might be the inevitable future of global health around the world, but most pressingly for other middle-income and high-income nations experiencing rapid demographic transitions.
In this study, we used vital statistics data from December 2011 to May 2021 to analyse how the number of marriages, divorces and births changed during the COVID-19 pandemic compared with previous years as a reference at the national and regional levels in Japan.
Methods
Vital statistical data on marriage, divorce and birth certificates were obtained from the monthly report released by the Ministry of Health, Labour and Welfare of Japan.55 We extracted information regarding the monthly number of marriages, divorces and total births from December 2011 to May 2021 at the country level and for Japan’s eight regions separately (Chubu, Chugoku, Hokkaido, Kansai, Kanto, Kyushu and Okinawa, Shikoku and Tohoku). These monthly values were converted to daily rates for each month in order to adjust for variable numbers of days per month. We also analysed first and subsequent births separately, as they have different seasonality, and only first births are correlated with marriage timing.56 The results of these analyses at the country level are presented separately in the online supplemental material; regional data were not available stratified by first and non-first births.
Supplemental material
To estimate the expected number of marriages, divorces and births, and the associated prediction intervals (PIs), we used the Farrington algorithm, which is used to assess time trends and identify disease outbreaks by the Centers for Disease Control and Prevention in the USA. The Farrington algorithm is a quasi-Poisson regression-based procedure.57 58 To estimate the expectation, it restricts the time period of the data used for estimation (defined as the reference period). As with the original Farrington algorithm, to estimate the expected number of cases for a given calendar month t, we used only data from  to
to  weeks among years
  and
and  , where h is the year of t and w and b are pre-fixed constants:
  and
and  were used in the present study.58 59
To adjust for seasonality in the model, periods not included in the reference period are evenly divided into four subperiods, and each subperiod is encoded as binary dummy variables. The regression model is then given by60:
 (1)
(1)


where  is the monthly number of outcomes (marriages, divorces and births) for a certain month t, α and β are regression parameters,
  is the population (for marriage and divorce analyses, this is the population aged 15 years or older; for birth analyses, this is the population of women aged 15–49 years),
  is a regression parameter vector representing seasonality, and
  is a vector of dummies for the aforementioned dummy variables at time t. The regression coefficients and the overdispersion parameter ϕ were estimated using the quasi-likelihood approach. Population data were obtained from yearly publications of the Basic Resident Register.61
To estimate the baseline in equation (1), we used data from 2011 to 2020 and predicted expected monthly case numbers for 2017–2021 using a 5-year moving window (eg, predictions for 2021 were made using data from 2016 to 2020). By substituting the estimated regression parameters into equation (1), the expected number was predicted for the month of interest  . The two-sided 95% PI was estimated with the assumption that
  , where NB is a negative binomial distribution,
  is the mean of the distribution and
  is the dispersion parameter. Observed values that fell outside of the 95% PI were regarded as statistically significant excesses or deficits. Analyses were performed in R V.4.1.1 using the surveillance package.
Patient and public involvement
Because our study comprised a secondary analysis of publicly available data, patients and the public were not involved in the design or conduct of this study.
Results
Marriage
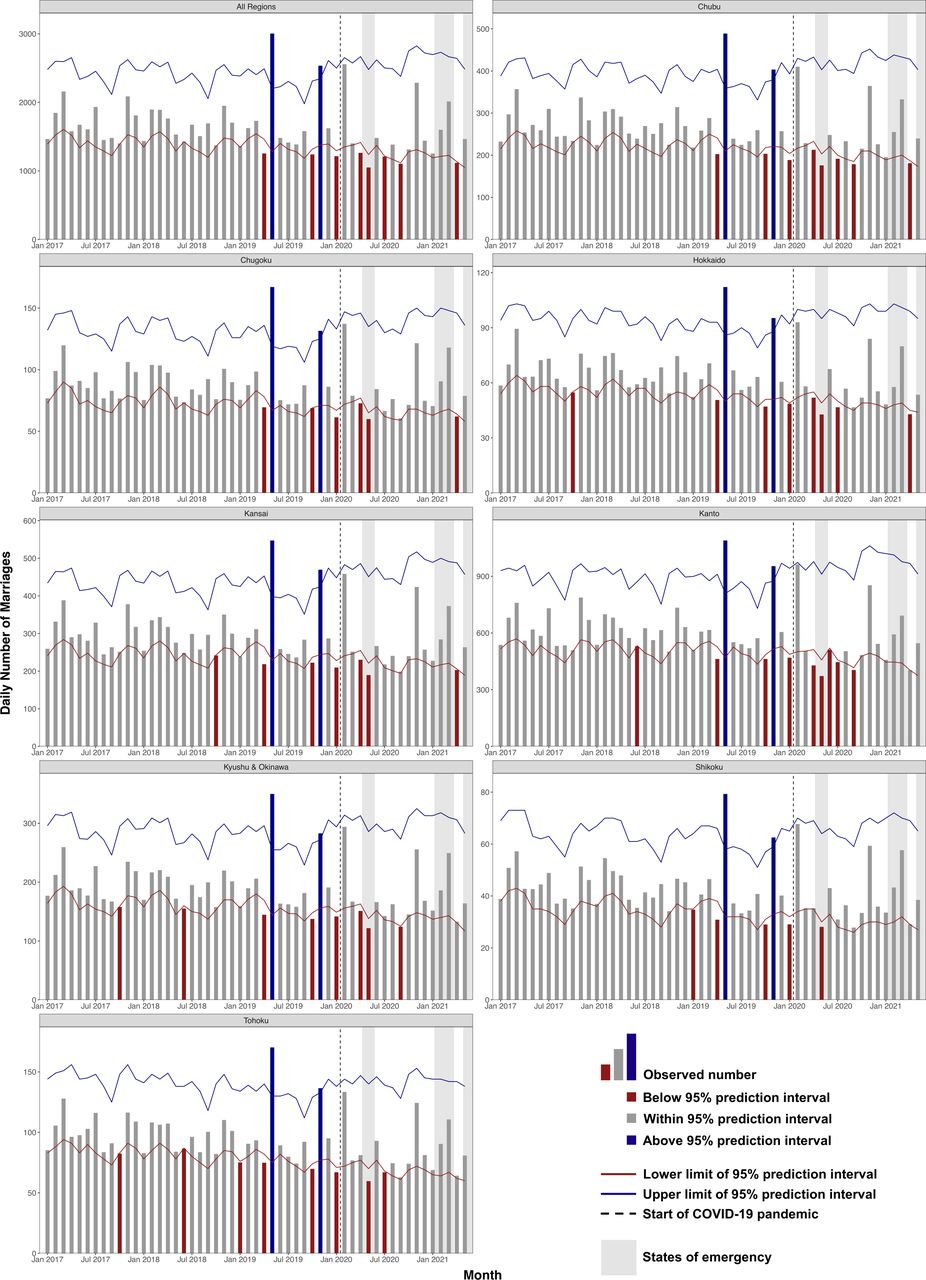
The observed and predicted daily number of marriages (per month) between January 2017 and May 2021 are shown in figure 1 and online supplemental tables 1–8. A decreasing trend in the national number of marriages can be observed over the 4-year period, with the exception of 2019: 623 010, 602 735 (year-on-year change, −3.3%), 615 652 (+2.1%), and 537 583 (−12.7%) marriages in 2017, 2018, 2019, and 2020, respectively. The seasonality of marriage varies slightly from year to year but tends to peak in February–March and November. Marriages were lowest in January and September–October. At the country level, a significant deficit in marriages was observed in April 2019 (1254 vs lower bound of 95% PI, 1461), followed by a large and significant excess in marriages during May 2019 (3004 vs upper bound of 95% PI, 2203) and November 2019 (2535 vs upper bound of 95% PI, 2344). Seven additional months were found to have marriage deficits: October 2019 (1240 vs lower bound of 95% PI, 1318), January 2020 (1215 vs lower bound of 95% PI, 1294), April 2020 (1264 vs lower bound of 95% PI, 1414), May 2020 (1050 vs lower bound of 95% PI, 1239), July 2020 (1209 vs lower bound of 95% PI, 1215), September 2020 (1104 vs lower bound of 95% PI, 1117) and April 2021 (1118 vs lower bound of 95% PI, 1134). Regional patterns in marriages largely reflected national trends, including excesses observed in May and November 2019 for all regions.

Observed and expected daily number of marriages, by month, with 95% prediction intervals (PIs) between January 2017 and May 2021. The blue and red lines represent the upper and lower thresholds, respectively, of the 95% PI around the expected value for any given month. Blue bars indicate observed values significantly higher than predicted (observed >95% PI upper limit). Red bars indicate observed values significantly lower than predicted (observed <95% PI lower limit). Grey shading corresponds to states of emergency in the Tokyo area. The dotted black line denotes the start of the COVID-19 pandemic (16 January 2020), when the first case of COVID-19 was identified in Japan.
Divorce
The observed and predicted daily number of divorces (per month) between January 2017 and May 2021 are shown in figure 2 and online supplemental tables 9–16. A slightly decreasing trend in the national number of divorces can be observed over the 4-year period, with the exception of 2019: 216 354, 212 393 (year-on-year change, −1.8%), 212 955 (+0.3%), and 196 641 (−7.7%) divorces in 2017, 2018, 2019, and 2020, respectively. Divorce consistently peaks in March and December of every year. At the country level, significant deficits in divorces were observed in April 2020 (550 vs lower bound of 95% PI, 556), May 2020 (370 vs lower bound of 95% PI, 508) and May 2021 (452 vs lower bound of 95% PI, 462). All regions except Shikoku showed similar deficits in May 2020. No excesses were detected at the national or regional levels during the assessed time period.

Observed and expected daily number of divorces, by month, with 95% prediction intervals (PIs) between January 2017 and May 2021. The blue and red lines represent the upper and lower thresholds, respectively, of the 95% PI around the expected value for any given month. Blue bars indicate observed values significantly higher than predicted (observed >95% PI upper limit). Red bars indicate observed values significantly lower than predicted (observed <95% PI lower limit). Grey shading corresponds to states of emergency in the Tokyo area. The dotted black line denotes the start of the COVID-19 pandemic (16 January 2020), when the first case of COVID-19 was identified in Japan.
Births
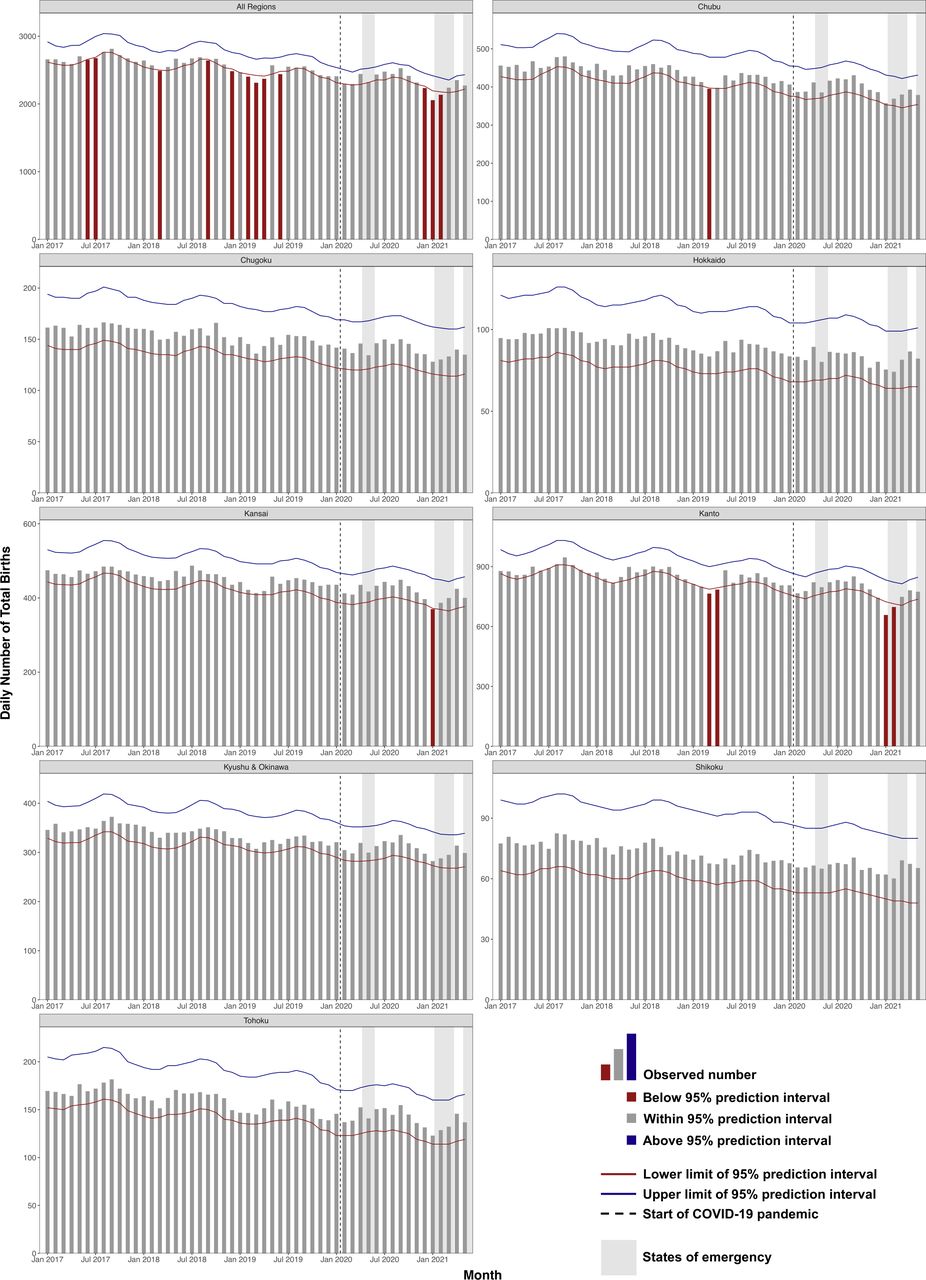
The observed and predicted daily number of total births (per month) between January 2017 and May 2021 are shown in figure 3 and online supplemental tables 17–24. Total births decreased over the 4-year period: 978 167, 950 832 (year-on-year change, −2.8%), 898 600 (−5.5%), and 872 683 (−2.9%) births in 2017, 2018, 2019, and 2020, respectively. Total births were generally highest in May and between July and October and lowest in February–April. At the country level, significant deficits in total births were observed in June 2017 (2653 vs lower bound of 95% PI, 2660), July 2017 (2676 vs lower bound of 95% PI, 2688), March 2018 (2489 vs lower bound of 95% PI, 2499), September 2018 (2443 vs lower bound of 95% PI, 2660), December 2018 (2484 vs lower bound of 95% PI, 2516), February 2019 (2403 vs lower bound of 95% PI, 2439), March 2019 (2313 vs lower bound of 95% PI, 2421), April 2019 (2371 vs lower bound of 95% PI, 2411), June 2019 (2440 vs lower bound of 95% PI, 2481), December 2020 (2235 vs lower bound of 95% PI, 2262), January 2021 (2056 vs lower bound of 95% PI, 2193) and February 2021 (2135 vs lower bound of 95% PI, 2178). Deficits were also detected in Chubu (March 2019), Kansai (January 2021) and Kanto (March and April 2019; January and February 2021). No excesses were detected at the national or regional levels during the assessed time period.
Observed and expected daily number of total births, by month, with 95% prediction intervals (PIs) between January 2017 and May 2021. The blue and red lines represent the upper and lower thresholds, respectively, of the 95% PI around the expected value for any given month. Red bars indicate observed values significantly lower than predicted (observed <95% PI lower limit). Grey shading corresponds to states of emergency in the Tokyo area. The dotted black line denotes the start of the COVID-19 pandemic (16 January 2020), when the first case of COVID-19 was identified in Japan.
The trends in first and subsequent births are shown in online supplemental figures 1, 2. Deficits in first births were primarily noted throughout 2017, in March 2019, and in January and February 2021. Deficits in subsequent births were primarily noted throughout 2019, in March 2020, in December 2020 and in January 2021. Taken together, these trends largely reflect those of total births.
Discussion
Using Japanese vital statistics data, we assessed changes in the number of marriages, divorces and births during the COVID-19 pandemic. After 2 months of significant marriage excess in 2019, we found evidence of scattered marriage deficits throughout 2020 and during April 2021. Divorces were significantly depressed in April and May 2020 and May 2021. A significant deficit of total births was observed in December 2020–February 2021. Birth counts recovered beginning in March 2021 and remained within predicted ranges through May 2021.
While media reports have suggested a drop in marriage and divorce in Japan, few studies have assessed these changes at the national level during the COVID-19 pandemic or any prior infectious disease outbreak. The rise of single-person households has been a serious public health concern in Japan given their increased propensity to experience poverty, decreased access to caregiving, lower levels of well-being and higher rates of social isolation.44–46 Though there is abundant research regarding the effects of natural disasters and terrorism on partnering behaviours,9 10 12–16 20 21 24 33 the findings are variable. However, unlike the acute perturbations of natural disasters, the COVID-19 pandemic has lasted over 1 year and is decidedly chronic in nature. Some have hypothesised that the prolonged character of the COVID-19 pandemic could exhaust mental resources and subsequently damage partnerships.31 In line with prior research, we found evidence of decreased marriages in Japan during the pandemic; however, no months of excess divorce were identified in our analysis.
Both marriage and divorce have been declining for several years in Japan, and this has most commonly been attributed to changing population structure and economic stagnation. Decreased employment rates are associated with fewer marriages and more divorces.23 62–65 For those who still do get married, poor economic conditions encourage delayed marriage.66 67 COVID-19 precipitated a 1.07 million (900 000 women) decrease in the number of non-regular workers between January and July 2020,25 and this economic shock may have played a role in altering partnering behaviours. The pandemic may have made it more economically advantageous to remain married, thus dissuading the divorces that stressful home environments would have otherwise triggered. With respect to marriage, although media reports showed that couples refrained from holding wedding ceremonies,68 they continued to get married by legally registering their marriages with the local government. However, marriage deficits noted during state of emergency declarations (April 2020, May 2020 and April 2021) suggest that couples may have refrained even from registering marriage paperwork during these periods.
The periods of marriage excess can largely be explained by Japanese culture. First, the increase in marriages in May 2019 is likely due to 2019 being the first year of Japan’s Reiwa era. On 1 May 2019, Crown Prince Naruhito ascended the Chrysanthemum Throne, marking the end of the Heisei era (8 January 1989–30 April 2019). The subsequent increase in marriages was likely due to the widespread belief that marriage during the first month of the first year of a new era is auspicious.69 The slight deficit of marriages in April 2019 may have been due to rescheduling to delay official ceremonies until the start of the new era.69 The significant excess in marriages in November 2019 (Reiwa 1) and non-significant increases in February 2020 (Reiwa 2) and March 2021 (Reiwa 3) may have been due to a phenomenon known as ‘dates of matching dice’ (zorome), a trend in which couples get married on dates with repeating numbers (eg, November 11, Reiwa 1 (11/11/1), February 22, Reiwa 2 (2/22/2), and March 3, Reiwa 3 (3/3/3)).9 There is no obvious explanation for the slight excess in marriages in November 2020, but it is possible that November 22 (11/22, also known as ‘Good Couple Day’ or īfūfunohi) experienced renewed popularity after the start of the Reiwa era. Notably, the increase in marriages during 2019 likely led to many of the slight monthly deficits reported in 2020,69 in which marriages which would normally have happened later were displaced earlier to 2019 in order to align with the new era.
With respect to divorce, our findings showed a non-significant increase every March between 2017 and 2021. These findings are consistent with previous observations that divorces tend to increase during March because the school year starts in April; if mothers and children need to relocate, children can change schools and both can change their last names before the start of the next academic year.70 71 We found only monthly deficits in divorce in April and May 2020, which corresponds to the first state of emergency declared throughout Japan.72 It is possible that the first state of emergency led to this decrease because couples felt that they should not leave their homes to officially file for divorce at their local municipal office. This may also explain the deficit noted in May 2021.
In the setting of already low fertility, further decreases in birth rates raise concern for future difficulties maintaining social security and universal healthcare, increased strain on hospital systems and shortages in physicians.50–54 Previous studies of births during the COVID-19 era have found deficits in other countries.34–36 The United Nations has warned of decreasing fertility around the world and expects fertility to return to pre-pandemic levels between 2023 and 2025,73 though other reports have found that COVID-19-associated disruptions in family planning services may have led to an increase in the number of unintended pregnancies in low- and middle-income countries.74 Prior research using Japanese data until November 2020 found no significant change in the number of births during the pandemic.34 However, given that the first state of emergency in Japan was not declared until April 2020, adequate time had not passed in order to thoroughly assess fertility changes. In the present study, we analyse data until May 2021, or 13 months after the first declaration of a state of emergency in Japan. We find that the number of births in Japan decreased between December 2020 and February 2021, or 8–10 months after the April–May 2020 state of emergency, consistent with preliminary reports from the National Institute of Population and Social Security Research.69 Notably, the rate of first births is correlated with marriage rates, but the same is not true of subsequent births.56 Thus, the decline in both first and non-first births in late 2020 to early 2021 suggests that factors other than just changes in marriage behaviour are responsible.
Fertility in Japan may have declined for a multitude of reasons. First, high levels of unemployment and non-regular work contracts are associated with decreased fertility.75 76 In fact, the most commonly cited reason for not having children in Japan is economic cost.77 COVID-19-related economic stagnation during the state of emergency may have contributed to a temporary decrease in intentional pregnancy. Second, surveys of young women and couples in the USA78 79 and China80 have found that many re-evaluated their pregnancy intentions or cancelled pregnancy plans during the early pandemic. Likely, increased rates of stress and fear precipitated a drop in the number of couples trying to get pregnant. Third, prior research has shown that rates of partnered sexual activity have decreased during the pandemic,81–83 which would be responsible for a decrease in both intentional and unintentional pregnancy. A Japanese survey conducted during the spring of 2020 found that of those who were sexually active, 15.9% of respondents reported decreased sexual activity, compared with 6.6% who reported increased activity (among only married respondents: 12.3% and 6.1%, respectively).32 Fourth, the decline in marriage likely contributed to a decrease in fertility rates: marriage has been found to be correlated with rates of first childbirth.56 Furthermore, the rate of non-marital childbirth in Japan is less than 3%.84 Finally, the pandemic was responsible for the postponement of infertility treatments, which also likely contributed to decreased pregnancies.85 However, as the decline in fertility was limited to a span of 3 months, we posit that the factors driving birth deficits were acute in nature and likely related to the first statement of emergency. In fact, the fertility rate may rebound once the pandemic situation settles, as has been seen in other countries.69 Unfortunately, the birth deficits observed so far, in combination with marriage decreases, will likely only further exacerbate the speed of Japan’s population decline and ageing process. These trends merit attention in other developed countries struggling with similar demographic transitions.
The results of the regional analyses varied depending on the outcome variable. For divorces, regional patterns largely mirrored national trends, and only Shikoku (an island comprised of four prefectures in southern Japan) showed no evidence of monthly deficits during the analysed time period. Similarly, regional analyses of marriage counts also reflected national trends, though more monthly deficits were generally noted in metropolitan regions, such as Chubu and Kanto. However, regional analyses of births showed much fewer deficits than the national analyses, likely because country-level trends compounded non-significant deficits accumulated across all regions. Notably, monthly deficits in total births during the pandemic were only noted in the two most metropolitan regions: Kansai and Kanto. In conjunction with the stratified marriage analyses, our findings suggest that metropolitan regions were more sensitive to pandemic-induced changes in partnership and fertility behaviours than their less metropolitan counterparts (Chugoku, Hokkaido and Tohoku, Kyushu and Okinawa, and Shikoku). Theoretically, these results are consistent with the notion that behaviours are most likely to change where the external shock—infection rates—is most concentrated; urban areas suffered from higher COVID-19 infection and mortality rates than did their rural counterparts.86 Furthermore, rural areas in Japan are known to have higher fertility rates than metropolitan centres,87 suggesting that rural fertility rates may be more resilient to the external shocks imposed by the pandemic.
This study has limitations. First, the use of the Farrington algorithm is intended to detect significant deviations in marriages, divorces and births when compared with pre-existing trends from historical data. Thus, our interpretations of changes during the pandemic are not definitive assessments of causality, but rather hypotheses based on temporal correlations. Second, the Farrington algorithm is able to capture gradual changes in trends, but does not absorb abrupt, pinpoint events that alter case numbers. Our study is therefore potentially limited by unknown confounders which may have imposed rapid changes in case counts. Third, we used a population offset term in order to adjust for Japan’s declining population, but due to a lack of data availability, we were not able to calculate age-adjusted rates. However, as the change in the population structure is gradual, it is captured by the Farrington algorithm, and similar methods have been used in prior research to passively absorb population changes.34 Fourth, for the analysis of marriage, the optimal offset would be men aged 18 years or older and women aged 16 years or older (in line with age-at-marriage laws); for divorce, the optimal offset would be the number of individuals married; for first and subsequent births, the optimal offset would be the number of women who have never had children versus those who have had at least one. Because of data limitations, we used the population aged 15 years or older for marriage and divorce and the population of women aged 15–49 years for all birth analyses. Finally, because fertility data were only available until May 2021, we cannot assess the fertility implications of emergency declarations beginning in 2021. Further studies are needed to assess the effects of the subsequent statements of emergency once data are made available for October 2021.
Conclusions
In this study using Japanese vital statistics data, we found that the COVID-19 pandemic was associated with a decrease in the number of marriages and divorces, especially during state of emergency declarations. The number of total births decreased between December 2020 and February 2021, approximately 8–10 months after the first state of emergency declaration. Decreased marriages and births will further exacerbate Japan’s struggle with a shrinking and greying population and herald fundamental consequences for public health, governance and economics. However, it remains possible that marriages and births will rebound during later phases of the pandemic. Further research is needed to assess how marriage, divorce and fertility changed during the latter half of 2021 and beyond.
Data availability statement
Data are available in a public, open access repository. All data relevant to the study are included in the article or uploaded as supplemental information. Marriage, divorce and birth data are openly available in the Ministry of Health, Labour and Welfare of Japan (https://www.mhlw.go.jp/toukei/list/81-1a.html). Population data from the Basic Resident Register are openly available online (https://www.e-stat.go.jp/stat-search/files?page=1&layout=datalist&toukei=00200241&tstat=000001039591&cycle=7&tclass1=000001039601&tclass2val=0).
Ethics statements
Patient consent for publication
Ethics approval
Ethical approval was not required for this secondary analysis of publicly available data.
References
Supplementary materials
Supplementary Data
This web only file has been produced by the BMJ Publishing Group from an electronic file supplied by the author(s) and has not been edited for content.
Footnotes
Handling editor Seye Abimbola
Twitter @cghaznavi, @harukask1231
Contributors Conception/design of the work—CG, TK, YT, DY and SN. Analysis of data—TK, YT, DY and KM. Interpretation of findings—all authors. Drafting of the work—CG, TK and DY. Substantially revised the work—all authors. SN is responsible for the overall content of the manuscript as the guarantor.
Funding This research was partially supported by a research grant from the Ministry of Education, Culture, Sports, Science and Technology of Japan (21H03203).
Disclaimer The funding source of this study had no role in the study design, data collection, data analysis, data interpretation or writing of the report. The views expressed in this paper are solely those of the authors.
Competing interests None declared.
Patient and public involvement Patients and/or the public were not involved in the design, or conduct, or reporting, or dissemination plans of this research.
Provenance and peer review Not commissioned; externally peer reviewed.
Supplemental material This content has been supplied by the author(s). It has not been vetted by BMJ Publishing Group Limited (BMJ) and may not have been peer-reviewed. Any opinions or recommendations discussed are solely those of the author(s) and are not endorsed by BMJ. BMJ disclaims all liability and responsibility arising from any reliance placed on the content. Where the content includes any translated material, BMJ does not warrant the accuracy and reliability of the translations (including but not limited to local regulations, clinical guidelines, terminology, drug names and drug dosages), and is not responsible for any error and/or omissions arising from translation and adaptation or otherwise.