Article Text

Abstract
Introduction The China Healthy Cities (Counties) public health initiative has been at the forefront of China’s efforts to counteract the growing challenges in the urban environment since the 1990s. It primarily focuses on improving the urban living environment. However, the nationwide health impacts of the initiative remain unexplored.
Methods We constructed nationwide county-level and city-level panel data from 1996 to 2012 using data on under-5 mortality rates (U5MR), the list of China healthy cities and counties and socioeconomic factors. We used a two-step staggered difference-in-differences approach that exploits variations in the timing of achieving the title of China Healthy City/County. Subgroup analyses by region were performed.
Results We included 707 cities in the China Healthy Cities study, and 1631 counties in the China Healthy Counties study. Our results indicate substantial and significant reductions in U5MR associated with the public health initiative in China. The association varies across regions with different socioeconomic statuses. China Healthy Cities were significantly associated with a reduction of 0.7/1000 (95% CI −1.2 to −0.2) in under-5 mortality 5 years after cities gained the title and a decrease of 1.4/1000 (95% CI −2.2 to −0.6) 10 years afterward. Cities from western China saw the largest statistically significant gains with 3.2/1000 and 7.2/1000 reductions in child mortality after 5 and 10 years, respectively. China Healthy Counties were also associated with significant reductions in under-5 mortality 8 years after achieving the title; it was associated with 2.6/1000 reductions in under-5 mortality nationwide and 3.8/1000 reductions in eastern China. Our results are robust to heterogeneous treatment effects across cities/counties over time and various model specifications.
Conclusion Our results suggest significant reductions in under-5 mortality associated with this public health intervention focusing on living environment conditions. Future research could explore differential effects across regions and clarify the underlying causal mechanisms.
- public health
- health policy
- environmental health
- health economics
- cohort study
Data availability statement
Data are available on reasonable request after the project ends.
This is an open access article distributed in accordance with the Creative Commons Attribution Non Commercial (CC BY-NC 4.0) license, which permits others to distribute, remix, adapt, build upon this work non-commercially, and license their derivative works on different terms, provided the original work is properly cited, appropriate credit is given, any changes made indicated, and the use is non-commercial. See: http://creativecommons.org/licenses/by-nc/4.0/.
Statistics from Altmetric.com
Key questions
What is already known?
The China Healthy Cities (Counties) public health initiative has been at the forefront of China’s public health efforts to counteract growing urban health challenges for decades.
Previous studies have shown an association between the initiative and improved urban living environmental conditions.
What are the new findings?
We first evaluated the health impact of perhaps the most influential public health initiative in China’s history—China Healthy Cities (Counties)—with a comprehensive nationwide county/city-level panel data file.
Our results suggest substantial and significant reductions in under-5 mortality associated with the public health initiative in China.
What do the new findings imply?
Public health initiatives that focus on improving the urban living environment can have significant effects on health outcomes.
Such programmes might be particularly important for areas facing severe health challenges, such as low-income and middle-income countries facing rapid urbanisation and environmental pollution.
Introduction
As the world becomes more and more urbanised over the coming decades, sustainable development challenges are increasingly concentrated in cities, particularly in low-income and middle-income countries with the fastest urbanisation pace. One of these challenges is the short supply of essential public services needed to maintain a healthy environment. China has seen the most massive rural-to-urban migration in human history since its 1978 economic reforms, with the urbanisation rate increasing from 17.9% in 1978 to 56.1% in 2015.1 However, most of the cities failed to provide essential public health services such as garbage collection, sewage systems, flushing toilets and green spaces, especially in the late 1900s and early 2000s.2 To address these environmental risk factors and improve cities’ livability, China launched a public health improvement initiative that includes China Healthy Cities in 1989 and China Healthy Counties in 1997.3 The initiative resembles the WHO Healthy Cities project and primarily encourages investment in urban infrastructure, sanitation, green space and environmental protection.4–6 Since then, it has been at the forefront of China’s public health efforts to counteract growing urban health challenges.
Prior studies have shown that a set of selected China Healthy Cities performed better than non-Healthy Cities regarding sewage and waste treatment, health promotion and infectious disease control.7–9 For instance, compared with a group of matched comparison cities, China Healthy Cities were associated with a 32 percentage points increase in the proportion of urban domestic sewage treated and a 30 percentage point increase in the proportion of urban domestic garbage treated.7 Another descriptive study shows favourable performance for seven healthy cities from Henan province on urban environment, health and economy.9 Despite this preliminary evidence, the national health impacts of this initiative remain unclear. Given the initiative’s broad outreach and cities/counties’ considerable investments in public health improvements such as establishing or upgrading sewage treatment plants and waste disposal plants,10 there is an urgent need for rigorous evaluations.
In this article, we compiled comprehensive and balanced panel data on all Chinese counties and cities from 1996 to 2012 and investigated the impact of the public health initiative on population health measured by county-level and city-level under-5 mortality rates (U5MR). U5MR is a good proxy for a city’s health because almost 20% of all child deaths occur before age 5, and thus, the levels and trends of U5MR are of particular relevance in understanding public health trends.11 Given the importance of early-life experiences for healthy ageing, this measure additionally captures the potential contributions of the initiative to future improvements over the life course. In addition, using other health outcomes, such as life expectancy or adult mortality, might introduce bias into the study since these outcomes can take a long time to change and may be subject to early life as well as later-life influences, thus complicating our identification strategy.
To guide our analysis, we used Mosley and Chen’s analytical framework for the study of child survival in low-income and middle-income countries.12 The framework states that socioeconomic determinants affect child mortality through five categories of proximate determinants: maternal factors (age, parity, birth interval), environmental contamination (air, food/water/fingers, skin/soil/inanimate objects and insect vectors), nutrient deficiency, injury and personal illness control. The China Healthy Cities (Counties) Initiative addresses a wide range of community-level socioeconomic determinants and should impact child health primarily through the environmental contamination channel. For example, one of the most significant financial commitments of the initiative is to establish or upgrade waste treatment facilities and sewer systems. Previous research has shown remarkable improvements in urban domestic sewage and garbage treatment.7 Improvements in water quality and urban sanitation could reduce child mortality, as shown in other studies conducted in major cities of the USA13 and the developing world.14 Moreover, since the initiative has its roots in the Patriotic Health Campaign that has a focus on infectious diseases, participating cities and counties also put lots of effort into health education and controlling for disease vectors—the ‘four pests’ of rats, flies, mosquitos and bed bugs.15 These efforts could reduce child mortality via reducing the transmission of infectious diseases.15 16
Background on the China Healthy Cities (Counties) initiative
Before introducing the initiative, it is worth describing the three-tier system of China’s administrative units. The country is divided into provinces, autonomous regions and municipalities (Beijing, Tianjin, Shanghai and Chongqing) directly under the central government. Provinces and autonomous regions are then divided into prefecture-level cities, which include districts, counties and county-level cities. Counties and county-level cities are divided into townships. The administrative units eligible for the China Healthy Cities include individual districts under the four megacities (Beijing, Shanghai, Tianjin and Chongqing), districts as a whole under prefecture-level cities, and county-level cities. In this paper, all these types of units are referred to as cities. The administrative units eligible for the China Healthy Counties only include counties; typically, only the township where the county government is located participates in the initiative.
China launched the China Healthy Cities initiative in October 1989 to tackle the rising public health challenges resulting from poor urban planning 10 years after the 1978 Chinese economic reform. The initiative has historical roots in China’s Patriotic Health Campaign in the early 1950s, another public health initiative aiming at poor sanitation conditions and infectious disease control in urban areas. The initiative was further expanded to counties, towns, and villages in 1997, known as China Healthy Counties/Towns/Villages. As of 2017, there are a total of 338 cities (nearly 48% of Chinese cities) named as China Healthy Cities and a total of 417 counties (about 26% of Chinese counties) named as China healthy counties.
China Healthy Cities
Initially, cities needed to be nominated by the provincial government to join the initiative. After 1994, cities were allowed to participate voluntarily. A city needs to meet a comprehensive range of standards and go through several rounds of assessment to become a China Healthy City. Zhang and Li provide a systematic introduction of these procedures through which a city wins the title of ‘China Healthy City’.2 Li et al also report a case study, which describes how the initiative is operated and implemented at a city level.10 In this paper, we only briefly summarise the procedures.
Before applying for the title, a city needs to make improvements to meet the national standards, which include both objective and subjective indicators. City officials then ask agencies from the provincial government for initial assessments. Once passing the evaluation, the city submits its application to the agency within the central government—the Office of National Patriotic Health Campaign Committee (the Office). The Office will then send out experts for inspection, which is done in disguise. Based on feedback from the investigation, the city has to make further improvements to meet the standards for being a healthy city. Then, the Office organises experts for another comprehensive (technical) assessment of a wide range of health and environmental indicators of the city. If the city can achieve a good score from this round of assessments, the Office would name the city as one of China Healthy Cities.
In practice, the evaluation process involves lots of back and forth. There is a small number of cities that tried but failed to achieve the title. We included these cities in the control group along with cities that never participated in the initiative. As such, the estimates presented in this paper are likely to underestimate the total impact of the initiative. Additionally, the Office reviews healthy cities’ performance every 3 years. Cities that fail to meet the requirements during the reassessment phase would be given the warning to make improvements. If they fail again, they will be stripped of their titles. Up to 2017, some Healthy Cities had received these warnings, but no city lost the title. The standards for a healthy city have many criteria in ten domains: governance, health education, urban sanitation, environment protection, public spaces and drinking water, food safety, infectious disease prevention and control, control of disease vectors, hygiene in communities and workplaces, and hygiene of urban villages and rural–urban continuum (see online supplemental appendix section 1 for more details).
Supplemental material
China Healthy Counties
Procedures for counties to become a national hygienic county are very similar to those used for China Healthy Cities as described above. Most of the national standards for China Healthy Counties follow those listed for China Healthy Cities, with few exceptions. Instead of requirements for urban villages and rural–urban continuum, standards for China Healthy Counties added several requirements for affiliated villages. For example, the standard requires that at least 90% of affiliated villages residents should have running water.
Methods
Data sources and measures
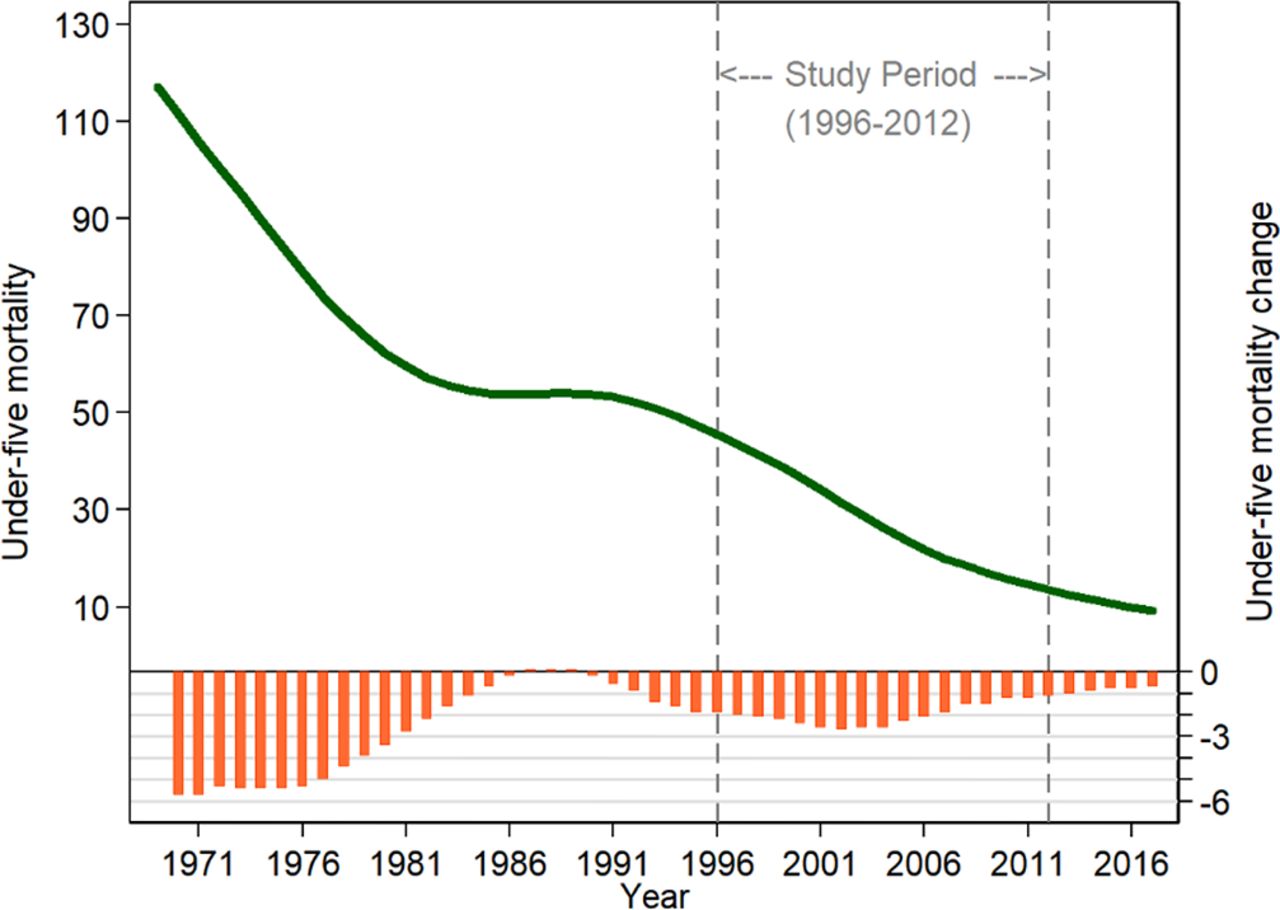
We chose U5MR as an indicator of population health. U5MR is defined as the number of deaths among children under 5 years of age per 1000 live births. We used 1996–2012 U5MR measures for 2851 counties/districts (99.8% of Chinese counties/districts) estimated by Wang et al based on various data sources, including the China Census and the national Annual Report System on Maternal and Child Health.17 18 The study period from 1996 to 2012 is of significant interest. It corresponds to China’s most rapid urbanisation and the second-fastest reductions in U5MR. As shown in figure 1, the U5MR in China decreased dramatically from 1970 to 1986, remained flat in 1986–1990 and dropped at a fast pace again after 1991.

Temporal trends of under-5 mortality in China, 1970–2017 notes: data on under-5 mortality were from the world bank. The left y-axis represents under-5 mortality, and the right y-axis represents annual changes in under-5 mortality.
China Data Online compiles a rich set of socioeconomic variables for individual counties and aggregate measures for all districts under a specific city, based on yearbooks of statistics published by the Bureau of Statistics.19 It includes annual data, starting from 1996, in several domains, including population, land, general economy, health systems and education. We extracted these socioeconomic variables and matched them to the list of healthy cities, the list of healthy counties and the U5MR dataset, according to the county/city name and administrative code. Besides, since China Healthy Cities were implemented at the district level among Beijing, Tianjin, Shanghai and Chongqing, we additionally collected district-level social-economic variables for these four megacities based on their 1996–2012 yearbooks of statistics. Missing values in the countylevel/city-level socioeconomic variables were imputed by linear interpolation. There is a small proportion of missing values, and they were very likely to be missing at random (online supplemental table A1).
The list of China’s healthy cities and counties up to 2017, along with the year when they gained the title, was from the National Health Commission of the People’s Republic of China.
Study design
We employed a quasi-experimental design that exploits variations in the timing of achieving the title of ‘China Healthy City/County’. Our analysis assumes that the accreditation process (giving the title to cities/counties) incentivised cities to make extra reforms in public health improvements that they otherwise would not have made. Our study design incorporates lessons learnt from the growing literature on difference-in-differences (DiD) analysis with staggered adoption of treatment.20–24 Due to differences in scope and criteria, we evaluated China Healthy Cities and Healthy Counties separately. To identify heterogeneous effects across regions with different levels of socioeconomic development and U5MR, we performed subgroup analyses by east, central and west China.
China Healthy Cities prevails among prefecture-level cities (districts as a whole under a prefecture-level city), county-level cities and districts of four municipalities (Beijing, Tianjin, Shanghai and Chongqing) directly under the central government, the unit of analysis, therefore, includes all three types of divisions and is hereinafter referred to as a city. The unit of analysis for the China Healthy Counties study is the county. As shown in online supplemental figure A1, our study includes almost all cities and counties in China. Among 2851 counties/districts with U5MR data,17 707 cities (some districts were aggregated to prefecture-level cities) are included in the China Healthy Cities study, and 1631 counties are included in the China Healthy Counties study. These cities (counties) contain both Healthy cities/counties (hereinafter referred as ‘treated units’ or ‘ever-treated units’) and non-Healthy comparison cities/counties (‘untreated units’). As such, it is a balanced panel data with N=707 and T=17 for the China Healthy Cities study and N=1631 and T=17 for the China Healthy Counties study.
As of 2017, a total of 338 cities have clinched the title of China Healthy City. We dropped some cities from the analysis due to changes in administrative regions or the lack of measures necessary for this study—318 healthy cities were kept in the treatment group. We further restricted the sample to those that gained the title of China Healthy City before 2012 since outcome data are only available from 1996 to 2012. Finally, we included 176 treated cities, of which 110 are from east China, 32 are from central China, and 34 are from west China. online supplemental figure A2 illustrates the inclusion and exclusion criteria for the China Healthy Cities study. Based on similar criteria, we included 126 treated counties in the China Healthy Counties study (see online supplemental figure A3). Among the treated counties included in the analyses, 26 are from east China, 52 are from central China and 48 are from west China.
Empirical strategy
To investigate the association between the public health initiative and U5MR, we applied a two-step econometric regression model for DiD analyses similar to previous studies using the staggered DiD framework.24–28 The first step is a non-parametric event study-style equation.
 (1)
(1)
where  is the U5MR in city c in year t. We constructed a normalised/event time τ that equals to zero in the year when cities/counties gained the title. For treated cities and counties, τ ranges from −13 to 14. For untreated cities and counties, it is always zero. We included a restricted range of τ from −8 to 10 in the model. Note, there is a trade-off between consistency and efficiency in this case. The longer the time before the named year (τ=0), the less comparable (compromising consistency) it is between cities/counties, while the closer it is to the named year, the smaller the sample size we will have (compromising consistency and losing efficiency). To choose the left bound, we require that there should be no obvious turning points in the temporal trends of U5MR. Otherwise, it would indicate other policy interventions were in place at that time. Based on this, we chose τ = −8 as the left bound of the evaluation time window. Given our goal is to estimate the 5-year effect and 10-year effect, we used τ =10 as the right bound. Nevertheless, we demonstrate that our results are robust to different choices of the restrictive range (online supplemental tables A2 and A3).
 includes a set of indicator variables for τ for a city/county c in year t.
  =1 denotes τ is on the left of restricted range (
 ) and
) and  =1 means the right of the range (
 ).
).  represents year fixed effects that account for national secular trends.
  denotes city/county fixed effects, which controls for permanent unobserved determinants of U5MR across cities/counties.
  include time-varying socioeconomic variables for city/county c in year t to capture the differential growth rates in socioeconomic variables across cities and counties. These include population at the year-end, area of the administrative region, gross domestic product, value-added of primary industry, value-added of secondary industry, number of student enrolments in secondary schools, number of student enrolments in primary schools, and number of beds in hospitals. SEs are clustered at the city/county level.
The publicly available database for U5MR includes both the point estimates and 95% confidence intervals for U5MR.17 Since the U5MR measures are predicted values, the above regression is weighted by the inverse of the relevant standard errors to account for uncertainties. We use two ways to retrieve standard errors of U5MR based on 95% CIs. The first one is based on the upper bound of CIs:  , and the second is from the lower bound as
  . We use
  in our main analyses.
  values are very similar to
  in magnitude and result in no meaningful changes in regression estimates (results available on request). A treated city/county is included if it has at least one observation 2 years before and after gaining the title.
The coefficients ( s) on indicator variables (
 ) for τ are of interest, and measure U5MR in years before and after gaining the title, purged of potential confounding factors included in the model. Coefficients (
 s) are normalised so that they are equal to zero in
  . We plot these coefficients in graphs against τ to present a visual impression of the trajectory differences in U5MR between treated and untreated units and guide the model specification in the second step. These graphs exhibit an indication of no mean shift but an apparent trend break (see figures 3 and 4).

Event study graphs for the China Healthy Counties study, by region notes: coefficients ( s) of indicator variables for τ from the first step of our two-step approach were plotted against the event time (τ). Coefficients (
 s) represent under-5 mortality purged of city fixed effects, year fixed effects and other confounders. Additionally, coefficients (
 s) are normalised so that they are equal to zero in τ=-1. The solid blue linear line is a linear fit of U5MR when τ<0, and the solid red line represents a linear fit after the initiative (τ>=0). U5MR, under-5 mortality rate.
The second step formally tests whether the initiative is associated with reductions in U5MR with a parametric trend break model.
 (2)
(2)
Where  is an indicator variable that equals 1 for treated units after they gained the title (including the named year) and equals 0 before the named year. The coefficient
  captures the mean shift in U5MR after the policy. Empirical researchers commonly adjust for the extrapolation of a linear trend during the pretreatment time to account for potential violations of the parallel trends assumption.22 24 27 29 This approach provides valid estimates if the difference is exactly linear.26 Our event-study graphs suggest that a linear trend can indeed capture these pre-existing trends quite well. Thus, due to the inclusion of event time τ, the model controls for pre-existing differential trends, measured by
  . By doing so, we only require the timing of winning the title to be uncorrelated with deviations of U5MR from a linear time, which is plausible in our study.
The addition of the interaction term between  and τ allows health impacts to evolve over time. The regression is weighted by the inverse of standard errors of
  . For China Healthy Cities, we report the initiative’s effect 5 years after gaining the title (5 year effect) as
  , and the ten-year effect as
  . For China Healthy Counties, we report the 5-year effect (
 ), and the 8-year effect (
 ), due to the late administration of the initiative. We use a linear regression model to fit the above two equations to avoid incidental parameter problems in panel data.30
Results
Tables 1 and 2 document the number of healthy cities and counties, respectively, along with the corresponding U5MR, stratified by three regions with different socioeconomic development statuses. Table 1 shows that U5MR among cities has steadily declined from 34 per 1000 live births to 11.9 per 1000 live births during the study period. Gradients in U5MR of cities across regions have also dramatically reduced; the difference in U5MR between west China and east China dropped from 24.7/1000 live births in 1996 to 7.5/1000 per live births in 2012. Meanwhile, a rising number of cities won the title of ‘China Healthy City’ nearly every year starting from 1990, and most of them concentrated in east China. Likewise, table 2 displays downward and convergent trends in U5MR for counties across regions. The U5MR of overall counties decreased from 61.6 to 19.5 per 1000 live births between 1996 and 2012, but west China still saw the highest level of U5MR. Figure 2 illustrates the variation of Healthy Cities and Counties across space and time. In addition, we present summary statistics of U5MR and socioeconomic variables in 2012 by whether cities (counties) have won the title up to that year (see online supplemental table A4).
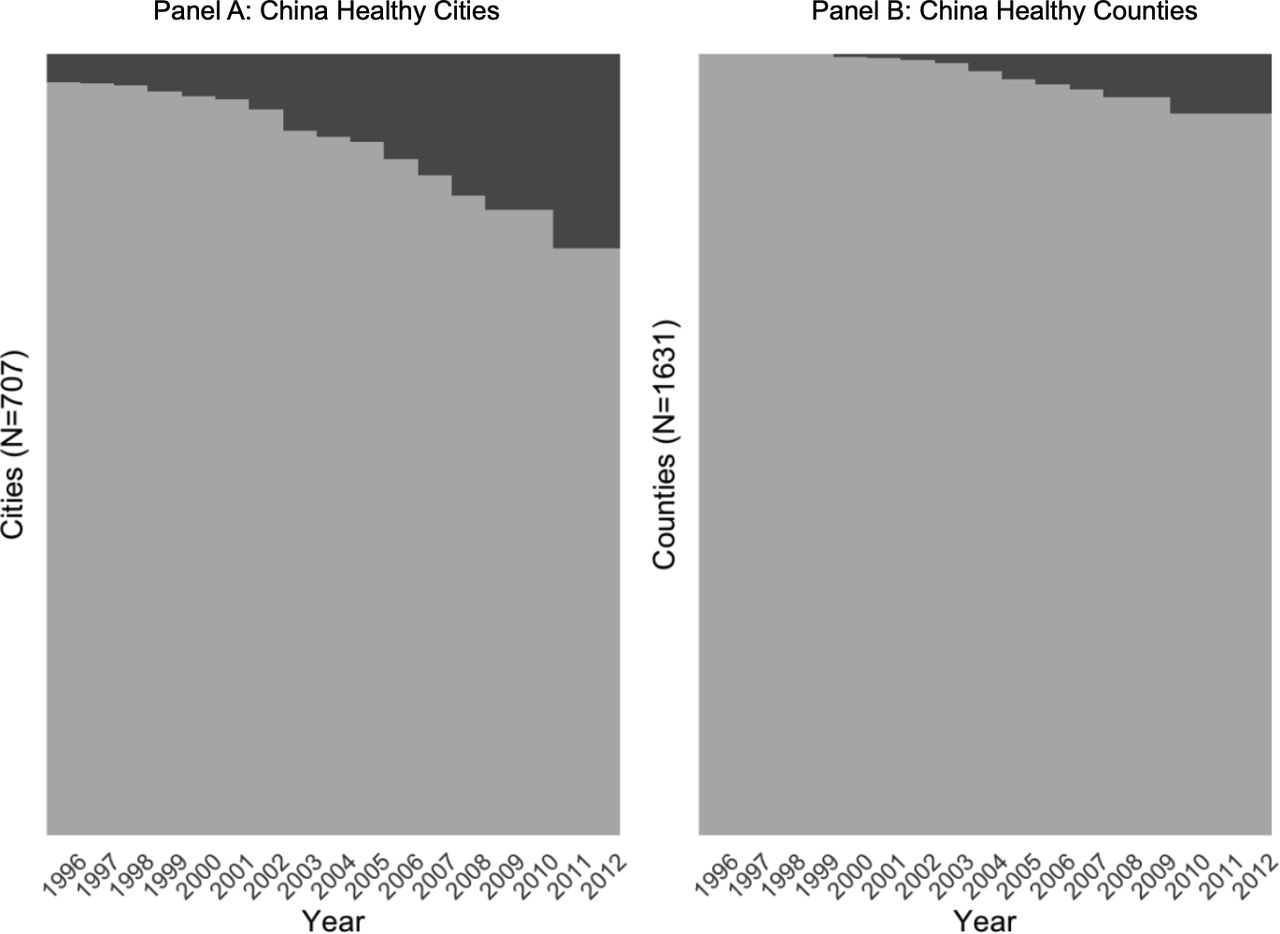
Treatment distribution across units and time notes: Panel A displays the spatial-temporal distribution of cities included in the China Healthy Cities study, in which the dark grey represents the accumulative distribution of healthy cities. Panel B displays the spatial-temporal distribution of counties included for the China Healthy Counties study; the dark grey represents the accumulative distribution of healthy counties and the light grey area denotes non-healthy comparison counties in that year.
Number of China Healthy Cities and under-5 mortality rates (U5MR), by year and region
Number of China healthy counties and under-5 mortality rates (U5MR), by year and region
Figures 3 and 4 present the event study-style graphs of the impact of China Healthy Cities and Counties on U5MR. The graphs demonstrate that the treated units generally have a lower level of U5MR on average, but the upward trends during the pre-treatment periods suggest that untreated units were catching up in reducing U5MR before the initiative. However, they change linearly across time. Our second step trend break model in equation 2, thus, controls for the differential pretrends with a linear time functional form. From these graphs, we can see that the initiative was in general associated with reductions in U5MR, especially for cities in west China, and counties in the east China. We also see that the initiative’s effect on U5MR among western counties was not sustained 7 years after the intervention.

Event study graphs for the China Healthy Cities study, by region notes: coefficients ( s) of indicator variables for τ from the first step of our two-step approach were plotted against the event time (τ). Coefficients (
 s) represent under-5 mortality purged of city fixed effects, year fixed effects and other confounders. Additionally, coefficients (
 S) are normalised so that they are equal to zero in τ=-1. The solid blue linear line is a linear fit of U5MR when τ<0, and the solid red line represents a linear fit after the initiative (τ>=0). U5MR, under-5 mortality rate.
Table 3 displays the health impact of the initiative on U5MR from the two-step econometric model. Panel A of table 3 shows that China Healthy Cities were significantly associated with 0.72 reductions (95% CI −1.2 to −0.2; p=0.008) in U5MR 5 years later, and 1.38 decreases (95% CI −2.2 to −0.6; p=0.002) 10 years later. It implies that among children under 5 years of age per 1 million live births in cities, China Healthy Cities were associated with 720 reductions in child deaths 5 years after the initiative and 1380 fewer child deaths 10 years later. Cities from west China had seen the most substantial effects; 3.22 reductions (95% CI −5.7 to −0.8; p=0.013) in U5MR 5 years after and 7.18 decreases (95% CI −11.0 to −3.4; p=0.001) 10 years after the initiative, both were statistically significant. The 5-year and 10-year effects of China Healthy Cities in the east and central China were smaller and not statistically significant.
Regression estimates of the public health Initiative and under-5 mortality rates
Panel B of table 3 documents estimates for the China Healthy Counties study. It shows that China Healthy Counties were associated with 2.59 reductions (95% CI −4.66 to −0.52; p=0.008) in U5MR among those living in counties 8 years after gaining the title. The 8-year health effects also differ considerably across regions. Counties from east China saw statistically significant 3.75 reductions (95% CI −6.71 to −0.80; p=0.016) in U5MR related to the initiative. However, the initiative had no detectable effect on U5MR among counties from central China. We also failed to detect statistically significant decreases in U5MR for counties from the west, even though the 8-year effect (95% CI −6.95 to 0.27; p=0.067) is of public health importance. It reflects substantial variations in the initiative’s effect on U5MR in the west. For example, the event-study graph for the west in figure 4 displays an upward trend in U5MR towards the later event years, indicating the lack of sustainability of some healthy cities in the west.
Robustness checks
First, based on the estimates from the first step (equation 1), we check the validity of estimators from the two-step regression models using a structural break analysis with unknown breakpoints (online supplemental appendix section 2). We identified (statistically) significant trend breakpoints for cities from west China at τ=5, for all counties at τ =2, and for counties from east China at τ =5 (online supplemental table A5). The breakpoint year for the full city sample was at the named year ( ), which is only marginally significant. These results corroborate our main analyses.
Second, to address the concern that Healthy Cities/Counties (‘ever treated’) may be systematically different from non-Healthy Cities/counties (‘never treated’), we excluded the never-treated group from the analysis. In this exercise, our non-parametric event study uses the ‘not-yet-treated’ cities/counties as the comparison group. For instance, suppose we have cohort 2003 (defined as cities/counties won the title in 2003) and cohort 2009 (cities/counties won the title in 2009), this exercise considers cohort 2003 as the treatment group, and cohort 2009 as the comparison group during the evaluation time period from 1992 to 2009; during this period, cohort 2009 is the not-yet-treated group. Results of this exercise are reported in online supplemental figures A4 and A5. We found no meaningful changes. This suggests that our DiD design is robust to the inclusion of the never-treated cities, regardless of any unmeasured differences between these two groups.
Third, recent papers have demonstrated that estimates from two-way fixed effects estimators can be severely biased due to selective treatment timing.21 23 31 32 For example, units that gained the title early during the initiative might experience different effects of participating in the initiative relative to later participants. Estimates robust to heterogeneous treatment effects have been proposed in recent studies with the Sun and Abraham paper giving a special focus on the event-study design.20 21 32 Intuitively, Sun and Abraham estimate the treatment effect for each cohort of cities (eg, cohort 2003 defined above) at different event years (years since winning the title), and then compute the weighted average of the effects by event years. We applied this method in our first-stage event study and then reestimated the second step parametric model accounting for pre-existing trends. We found consistent estimates (see online supplemental figures A6 and A7). This suggests that our findings are not biased by potential heterogeneous treatment effects across units over time.
Lastly, our estimates are robust to different model specifications (online supplemental appendix sections 2 and 3). Our two-step model is more efficient than the conventional one-step approach in the inference of DiD studies with panel data.25 33 Estimates from the one-step approach are numerically equivalent to those from our two-step approach, but some estimates became statistically insignificant due to the loss of efficiency (online supplemental table A6). Our estimates are robust to the use of city/county-level per-capita measures on socioeconomic characteristics (online supplemental table A7), the control of urbanisation rates (online supplemental table A8) and the adjustment of health insurance expansion during the study period (online supplemental table A9).
Discussion
This paper provides the most comprehensive evaluation, to date, of the health impacts of a long-existing and nationwide public health initiative in China. We found substantial and significant reductions in U5MR associated with this public health initiative. The association varies considerably across regions; cities from western China saw the largest gains from China Healthy Cities, while counties from eastern China benefited the most from China Healthy Counties.
Our study reveals considerable heterogeneous results across regions. For China Healthy Cities, we failed to find detectable health impacts in eastern and central China, probably because these cities already had a low U5MR, and thus it may take a longer time for the effect to be seen. In addition, regional differences in economic development and implementation and enforcement of the national standards could also explain the heterogeneous effects of the initiative across regions. For example, cities in the west had worse public health infrastructure investments than those in the east and central China, making their U5MR more sensitive to improved public health conditions.34 For China Healthy Counties, we find a significant health impact associated with the initiative but only in east China. Among western counties, the event graph indicates a short-term effect on U5MR reductions. However, the effect was not sustained. China Healthy Counties does not receive as much political and financial support as the China Healthy Cities, and the investment in improving public health thus heavily depends on the county’s own economy. Counties in east China are more affluent and could maintain the public health investments. In contrast, many western counties usually get government loans to establish public health infrastructures and make improvements in the urban living environment. However, it is not sustainable for these cities to maintain such investments and human resources after gaining the title. Besides, China Healthy Counties only require the township where the county government was located to participate, but our county-level U5MR was estimated for the whole county. Therefore, the health impact of China Healthy Counties might be underestimated.
Like other complex public health interventions, the health initiative’s complexity makes it difficult to understand which mechanisms are most effective in improving population health. The lack of city-level/county-level environment and health measures in China imposes further barriers to empirical analyses. Some studies have attributed the initiative’s success in improving the urban living environment and population health to its intersectoral collaboration across government units.2 7 10 35 Other studies have also suggested that the initiative has effectively motivated the local governments to improve the urban living environment and public health through awards and competitions.2 10 The winning mentality of this national favourable title actually help mobilise the public, facilitate intersectoral collaboration and motivate city/county leaders to make investments to improve the living environment. It is also worth noting that winning the honourable title could give city/county leaders significant political capital.2 The performance of government officials in the campaign is also built into the assessment and promotion system.2 Therefore, accreditation plays an important role in motivating local governments to improve public health. Despite sparse evidence on mechanisms, our findings can still guide the generalisation of the China Healthy Cities/Counties initiative in other Chinese cities and counties. The initiative is standardised as a package of public health interventions and will be implemented as a whole once cities/counties plan to pursue the title.
Our study has limitations. Since cities/counties received the accreditation (or the title) after they have already chosen to implement policies for public health improvements, our study assumes that they would not have made as much improvement without the accreditation process. Similarly, we cannot guarantee all unobserved confounding factors are balanced between healthy cities/counties and control cities/counties due to the lack of random assignment. Thus, our estimates only indicate correlation, not causation. However, our staggered DiD study design with comparison groups can account for any changing health problems common to both healthy cities/counties and non-healthy counties, including state-mandated basic public services and other policies. Our statistical model has adjusted for potential differential selection in the participation of the public health initiative and adjusted for city/county fixed effects, year effects, and several time-varying socioeconomic variables. Our results are also robust to various sensitivity analyses with different controls and model specifications. Another limitation is that our analysis only included 1996–2012 U5MR, which is after the China Healthy Cities initiative launched in 1989. We do not observe trends in U5MR before the initiative. Therefore, our pretrends analysis measures changes in U5MR after the initiative began but before cities/counties took it up.
Despite the limitations, this paper provides a rigorous health impact assessment of the massive public health improvement initiative in China. Our findings suggest that improving the social and physical living environment in urban settings is a plausibly effective approach for improving population health. Our study provides much-needed evidence for policy-makers in China to keep supporting and promoting the initiative across the country. Furthermore, the China Healthy Cities initiative resembles the WHO Healthy Cities Network and provides a comparison of the efficacy of the network in low-middle and middle-income countries.5 36–39
Data availability statement
Data are available on reasonable request after the project ends.
Ethics statements
Patient consent for publication
Ethics approval
This study does not involve human participants.
References
Supplementary materials
Supplementary Data
This web only file has been produced by the BMJ Publishing Group from an electronic file supplied by the author(s) and has not been edited for content.
Footnotes
Handling editor Lei Si
Twitter @DahaiYue
Contributors DY: conceptualisation, methodology, software, formal analysis, data acquisition, writing—original draft, visualisation, writing—review and editing; XC: data acquisition, methodology, writing—review and editing; YZ: data acquisition, visualisation, writing—review and editing; JM: writing—review and editing; QM: data acquisition, writing—review and editing. DY is responsible for the overall content as guarantor. The guarantor accepts full responsibility for the finished work and/or the conduct of the study, had access to the data, and controlled the decision to publish.
Funding The authors have not declared a specific grant for this research from any funding agency in the public, commercial or not-for-profit sectors.
Competing interests None declared.
Provenance and peer review Not commissioned; externally peer reviewed.
Supplemental material This content has been supplied by the author(s). It has not been vetted by BMJ Publishing Group Limited (BMJ) and may not have been peer-reviewed. Any opinions or recommendations discussed are solely those of the author(s) and are not endorsed by BMJ. BMJ disclaims all liability and responsibility arising from any reliance placed on the content. Where the content includes any translated material, BMJ does not warrant the accuracy and reliability of the translations (including but not limited to local regulations, clinical guidelines, terminology, drug names and drug dosages), and is not responsible for any error and/or omissions arising from translation and adaptation or otherwise.