Article Text

Abstract
Introduction Using nationally representative survey data from China and India, this study examined (1) the distribution and patterns of multimorbidity in relation to socioeconomic status and (2) association between multimorbidity and out-of-pocket expenditure (OOPE) for medicines by socioeconomic groups.
Methods Secondary data analysis of adult population aged 45 years and older from WHO Study on Global Ageing and Adult Health (SAGE) India 2015 (n=7397) and China Health and Retirement Longitudinal Study (CHARLS) 2015 (n=11 570). Log-linear, two-parts, zero-inflated and quantile regression models were performed to assess the association between multimorbidity and OOPE for medicines in both countries. Quantile regression was adopted to assess the observed relationship across OOPE distributions.
Results Based on 14 (11 self-reported) and 9 (8 self-reported) long-term conditions in the CHARLS and SAGE datasets, respectively, the prevalence of multimorbidity in the adult population aged 45 and older was found to be 63.4% in China and 42.2% in India. Of those with any long-term health condition, 38.6% in China and 20.9% in India had complex multimorbidity. Multimorbidity was significantly associated with higher OOPE for medicines in both countries (p<0.05); an additional physical long-term condition was associated with a 18.8% increase in OOPE for medicine in China (p<0.05) and a 20.9% increase in India (p<0.05). Liver disease was associated with highest increase in OOPE for medicines in China (61.6%) and stroke in India (131.6%). Diabetes had the second largest increase (China: 58.4%, India: 91.6%) in OOPE for medicines in both countries.
Conclusion Multimorbidity was associated with substantially higher OOPE for medicines in China and India compared with those without multimorbidity. Our findings provide supporting evidence of the need to improve financial protection for populations with an increased burden of chronic diseases in low-income and middle-income countries.
- health policy
Data availability statement
Data are available on reasonable request. The CHARLS dataset is freely available to researchers. Researchers can gain access to the data at http://charls.pku.edu.cn/index/en.html. The SAGE dataset is available to researchers, on request, at https://iipsindia.ac.in/content/SAGE-wave-2.
This is an open access article distributed in accordance with the Creative Commons Attribution Non Commercial (CC BY-NC 4.0) license, which permits others to distribute, remix, adapt, build upon this work non-commercially, and license their derivative works on different terms, provided the original work is properly cited, appropriate credit is given, any changes made indicated, and the use is non-commercial. See: http://creativecommons.org/licenses/by-nc/4.0/.
Statistics from Altmetric.com
WHAT IS ALREADY KNOWN ON THIS TOPIC
In low-income and middle-income countries, out-of-pocket spending on medicines accounts for a significant portion of total healthcare costs for patients with chronic disease. However, there is a paucity of evidence on the links between multimorbidity and out-of-pocket expenditure (OOPE) on medicine in China and India.
WHAT THIS STUDY ADDS
In the adult population aged 45 and older in China and India, the prevalence of multimorbidity and complex multimorbidity was found to be 63.4% and 38.6% in China and 42.2% and 20.9% in India, respectively.
The prevalence of coexisting physical–mental health multimorbidity was 23.2% in China and 8.2% in India.
In China, each additional long-term condition was associated with an 18.8% increase in OOPE for medicine and a 20.9% increase in India.
Stroke was associated with the highest OOPE for medicines in India, while liver disease was associated with the highest OOPE in China. Diabetes, which is one of the most prevalent diseases in both China and India, has the second largest impact on OOPE for medicines in both countries.
HOW THIS STUDY MIGHT AFFECT RESEARCH, PRACTICE OR POLICY
In China and India, a large proportion of adults suffer from multimorbidity and complex multimorbidity, which significantly raises OOPE on medicine. Our research suggests accelerating universal health coverage and implementing policy interventions to expand health insurance coverage and reduce prescription drug costs in low-income and middle-income countries. To more effectively prevent and manage chronic diseases, health systems must shift away from single-disease-focused models and towards new financing and service delivery models for multimorbidity.
Introduction
Multimorbidity, defined as the coexistence of two or more long-term conditions (LTCs) within an individual, is a growing yet unaddressed major public health challenge in low-income and middle-income countries (LMICs) undergoing rapid demographic and epidemiological transition.1 Evidence from high-income countries indicates that multimorbidity is becoming the norm rather than exception among the older adult population.2 A recent study in China found that over 60% of the population aged 45 years and above is multimorbid.3 Emerging evidence from high-income countries indicates that multimorbidity is a major contributor to health inequalities.4 5 However, studies from LMICs have revealed mixed findings in terms of the socioeconomic patterning of multimorbidity.6–8 The mixed findings might be due to the differences in the distribution of risk factors for LTCs across socioeconomic groups as well as underdiagnosis in those of lower socioeconomic status (SES).9
Reducing the financial burden of prescription medicines in patients with multimorbidity is a key priority for countries that aim to achieve universal health coverage (UHC).10 Patients with multimorbidity have complex health needs that require more frequent visits to healthcare providers. Patients with multimorbidity are also at a higher risk of financial impoverishment caused by higher out-of-pocket expenditure (OOPE) on doctor visits and medication, and loss of income due to job losses or decline in productivity.11–13 Our earlier study (2015) revealed that OOPE for medicines constitute a significant proportion of total healthcare expenditures for those with multimorbidity, in six major LMICs.12 For example, in India, it constituted approximately 60% of outpatient service spending, and 50% of inpatient service spending. The high level of OOPE is concerning as cost is the major barrier to access to healthcare, especially for the poor that are more sensitive to costs for health services.12
Recent statistics indicate that, roughly 95% of the population is covered by at least one of the three social basic health insurance schemes.14 These insurance schemes are the Urban Employee Basic Medical Insurance Scheme (UEBMI), the Urban Resident Basic Medical Insurance Scheme (URBMI) and the New Rural Cooperative Medical Scheme (NRCMS).15 16 China has been focusing on implementing URBMI and NRCMS into the new Urban–Rural Resident Medical Insurance scheme since 2015.17 18 Patients are required to pay user fees for their health services under the form of deductibles, copayments, reimbursement caps and patient cost sharing.19 Studies have found that the level of cost sharing varies substantially based on the type of health services, insurance, province and patient characteristics.20 These studies have shown that the percentage of cost sharing for outpatient care was significantly higher than for inpatient care.21 The most recent Healthy China 203022 policy has set an ambitious target of reducing patient cost-sharing (the percentage of out-of-pocket spending in total health expenditure) from 60% in 2001 to 25% by 2030.22
According to the latest data, just around 37% of the Indian population has health insurance (including public and private).19 Low levels of public health insurance coverage are mostly attributable to insufficient public health spending, particularly in low-income states.23 Studies have shown that wealthy Indians are more likely to have private health insurance than their counterparts.24 There is a focused public health insurance programme in India for the disadvantaged population.13 Recent statistics estimate that OOPE accounts for around 62.5% of total health expenditures,25 results in both impoverished and catastrophic health expenditures.12 Data from national analysis suggested that medicines accounted for more than half of total OOPE for individuals with multimorbidity.12
Despite the critical importance of OOPE for medicines for LMICs to achieve UHC, to date, most research evaluating the impact of multimorbidity on OOPE for medicine has been conducted in high-income countries, with few comparative studies in LMICs (see Research in context).4 13 To address this critical evidence gap, using nationally representative data in China and India, we have examined the patterning of multimorbidity and their effect on OOPE for medicines in both countries. Specifically we have investigated (1) the distribution and patterns of multimorbidity in relation to SES and (2) association between multimorbidity and OOPE on medicines by socioeconomic groups.
Methods
Data sources
Secondary data analysis was conducted on nationally representative data from wave 2 of the WHO Study on Global Ageing and Adult Health (SAGE) India and wave 3 of the China Health and Retirement Longitudinal Study (CHARLS) both conducted in 2015. Wave 2 of SAGE India contained 9116 respondents. In brief, CHARLS is an ongoing nationally representative longitudinal survey where baseline measures were conducted in the year 2011 and subsequent rounds of data were collected every 2 years. CHARLS used a multistage stratified probability-proportionate-to size sampling and face to face computer assisted personal interviews were conducted in individuals aged 45 years or older.26–28 SAGE is an longitudinal study that began in 2007 by the WHO. SAGE wave 2 is a follow-up to sage wave 1 conducted in 2007. SAGE used a multistage stratified cluster sampling design where face-to-face interviews were conducted on a larger sample of individuals aged 50 and older and on a smaller comparative sample of those aged 18–49 in six selected sates of Assam, Karnataka, Maharashtra, Rajasthan, Uttar Pradesh and West Bengal.29 30 More detailed description of study design, tools and protocols have been reported elsewhere.31 32
This study included respondents aged 45 years and older from the interviewed samples, with valid blood pressure readings from the survey nurse visit (n=7567) and excluded respondents with missing data on other outcome or independent variables, resulting in 7397 respondents . The wave 3 of CHARLS contained 20197 respondents. This study included respondents aged 45 years and older from the interviewed samples, with valid blood pressure reading from the interviewer’s visit (n=13354) and excluded respondents with missing data on other outcome or independent variables, resulting in 11 570 respondents . The sample flow chart of respondents for both countries is summarised in online supplemental appendix figures S1 and S2.
Supplemental material
Variables
LTC multimorbidity
Our main variable of interest was the number of coexistent LTCs reported by each respondent. We counted the number of LTCs for each respondent and defined those with multimorbidity as the presence of two or more of these conditions.1
Furthermore, we used the International Classification of Diseases-10th revision to group LTCs into organ systems and counted the number of organ systems affected for each respondent. Those with complex multimorbidity were defined as ‘three or more chronic conditions affecting at least three different body systems within one person’ which has been used in previous research.33 34
In SAGE, nine LTCs were included: angina, arthritis, asthma, cataracts, diabetes, stroke, chronic lung disease, hypertension and depression.34 35 The presence of LTCs was ascertained by either self-reporting or direct measurement.35 36 For angina, arthritis, asthma, chronic lung disease, diabetes, cataracts, stroke and hypertension, respondents were defined as having an LTC, through self-reporting, if they have answered yes to the question, ‘Have you ever been diagnosed with….?’6 12 36 Furthermore, extra sets of symptomatic questions were provided to assess angina, arthritis, asthma and chronic lung disease.36 Symptom-based assessment of angina was based from the WHO’s Rose Angina Questionnaire.37 Symptom-based assessment of arthritis, asthma and chronic lung disease was based from an algorithm created by the WHO SAGE study team in the Diagnostic Item Probability Study.37 For hypertension, trained health investigators carried out measurement of systolic and diastolic levels of each respondent.38 Three blood pressure readings were taken at 1 min intervals and the average was calculated.36 38 In this analysis, we also categorised an individual as having hypertension if the average systolic levels were ≥140 mmHg and average diastolic levels were ≥90 mm Hg.38 The presence of a mental health disorder is defined as having depression in WHO SAGE.35 Diagnosis of depression was based on either self-reported diagnosis or from clinical-based assessment.36 Self-reported diagnosis of depression occurs if respondents have answered yes to the question ‘Have you ever been diagnosed with depression?’12 36 Clinical-based assessment of depression was based from the algorithm-based World Mental health Survey version of the Composite International Diagnostic Interview (CIDI).39
For CHARLS, there were 14 LTCs. Twelve of which were physical (hypertension, diabetes, dyslipidaemia, heart disease, stroke, cancer, chronic lung disease, digestive disease, liver disease, kidney disease, memory disease and arthritis).3 Two were mental LTCs: depression and psychological and emotional illness. Presence of a physical chronic condition was defined from a set of self-reported questions or confirmation through measurements such as blood pressure.40 Respondents were hypertensive if systolic levels were ≥140 mm Hg or diastolic levels were ≥90 mm Hg or taking antihypertensive medication at the time of the survey.41 Presence of mental LTCs was defined as having depressive symptoms or psychological and emotional illness. Psychological and emotional illness was assessed from self-reported questions and depression symptoms were assessed through a questionnaire based on a self-reported Centre for Epidemiologic Studies Depression 10 items score.42 Respondents who scored more than 10 were found to have depression.42
Outcome variable
Our primary outcome of interest was OOPE for medicines. OOPE for medicines was assessed by examining outpatient OOPE for medicines on their last outpatient visit. In SAGE, individuals were asked about their OOPE for medicines by answering the question ‘thinking about your last visit, how much did you or your household pay for…’ for the following categories: Healthcare provider’s fees, medicines, tests, transport and other fees in their local currency.6 For respondents who responded in the previous question ‘who paid for this most recent visit?’ that their last hospitalisation was free and did not provide a value for OOPE for medicine, we assumed that OOPE for medicine will equate to zero.6 In CHARLS, respondents wrote down OOPE spending on medicine by answering the question ‘how much will you eventually pay out of pocket for the medications from this visit, including prescriptions you received?’43 Those who did not pay anything will have an OOPE for medicines as zero.43 As values for OOPE were highly skewed, we removed observations with the highest 0.5% of OOPE to lessen the skewing effects and influence of outlier on the analysis.6 In both China and India, we used their local currency, Yuan (¥) and Rupee (₹), respectively, for OOPE for medicines.
Covariates
The following covariates were included in the analyses: age (45–54, 55–64, 65–74, 75+ years), sex (male/female), residence (urban/rural), marital status (currently married/not married), education (primary or less, secondary or high school, tertiary or higher), economic status defined as wealth quintiles with 1 being the lowest and 5 being the highest, caste (scheduled, none, other), health insurance status (yes/no), religion (Hinduism, Islam, other) and geographical regions defined as state names (Assam, Karnataka, Maharashtra, Rajasthan, Utter Pradesh, West Bengal). For CHARLS, the following covariates were included in the analyses: sex (male/female), age (45–54, 55-64, 65–74, 75+ years), marital status (currently married/not married), residence (urban/rural), education (primary or less, secondary, tertiary or higher), social health insurance status (none/Urban Employee Basic Medical Insurance (UEBMI)/Urban Resident Medical Insurance (URBMI)/New Rural Cooperative Medical Scheme (NRCMS)/other), region (east/central/west) and economic status defined as wealth quintiles with 1 being the lowest and 5 being the highest.
Statistical analysis
We first summarised the prevalence for the following variables in both countries: (1) multimorbidity; (2) physical–mental multimorbidity and (3) complex multimorbidity at national level by SES subgroups. We examined multimorbidity patterns in each country, by showing the size of the bubble and its associated percentage of individuals with each dyad of disease.44
We estimated the relationships between multimorbidity and OOPE for medicine using log-linear models where a constant, equals to one, was added to the outcome variable prior to the log transformation to reduce skewness.12 To interpret the coefficients estimated from the model, we converted the coefficients to a percentage change in outcome.45
We examined the potential differential effect of multimorbidity on OOPE for medicine across socioeconomic groups by including interaction terms between socioeconomic groups and number of LTCs in our regression models. Similarly, we examined the differential effect across health insurance status by including interaction terms between health insurance and number of LTCs in our regression models.
To examine the association between multimorbidity and OOPE for medicines across cost distribution, we performed quantile regression analyses. Quantile regression fits a line to minimise the sum of absolute residuals. The objective is to estimate the median (as well as the 25th, 75th and 90th percentile) of the outcome variable conditional on independent variables. The method is robust to outliers because it allows for studying the full distribution of the outcome variable and is suitable for modelling outcomes such as OOPE, which are often skewed or not normally distributed.46–48
In both countries, some patients reported zero OOPE for medicine (6.43% in China and 14.8% in India). Thus, we conducted sensitivity analyses that examined the relationships between multimorbidity and outcomes using two additional models that explicitly takes into account, the zero outcome. These were (1) two-part model and (2) zero-inflated negative binomial model. The two-part model consists of a logistic regression model that estimates OOPE for medicine being non-zero and a generalised linear model. The zero-inflated negative binomial model was fitted to observe the zero and count outcome variables.
All OOPE on medicines was estimates in inflation-adjusted 2020 US$. This was done by using Purchasing Power Parity Indices to convert costs from one country to another (in this case, the USA), and subsequently the overall US Consumer Price Index was used to convert historical costs to 2020 US$.13 We also displayed money in China (yuan) and India (rupee) separately to enhance comprehension for local policy-makers.
We tested for multicollinearity for covariates adjusted for in our analysis with the variance inflation factor. The multicollinearity diagnostics (variance inflation factor) were all less than five, indicating that the assumption of reasonable independence among predictor variables was met.12 49 We presented adjusted ORs (AOR) for results in logistic regression model, and regression coefficient for results in log-linear models. All data analyses were weighted to account for the complex, multistage design of the SAGE and CHARLS survey. We performed the statistical analyses using Stata V.16.1 (StataCorp).
Patient and public involvement
Patients and the public were not involved in any way in this analysis of previously collected data.
Results
Sample characteristics
In China, the median age of respondents was 60 years old (IQR=52–67). The average number of LTCs per respondent was 2.42 (table 1) and 50.6% were female. 8.8% had no health insurance whereas 91.2% had health insurance. Of those with health insurance, 18.8% had UEBMI, 8.0% with URBMI, 61.6% had NRCMS with 2.7% having other types (online supplemental table S1). In India, the median age of respondents was 60 years (IQR=54–68). The average number of LTCs per respondent was 1.51. (table 2), 53.7% were female and only 10.1% had health insurance (online supplemental table S1).
Prevalence of multimorbidity, coexisting physical–mental and complex multimorbidity in China, 2015
Prevalence of multimorbidity, coexisting physical–mental and complex multimorbidity in India, 2015
Prevalence of multimorbidity
Tables 1 and 2 present the mean number of LTCs and the prevalence of multimorbidity, coexisting physical–mental multimorbidity and complex multimorbidity in China and India, respectively. Online supplemental tables S2 and S3 present the number of LTCs by the sample characteristics from China and India, respectively.
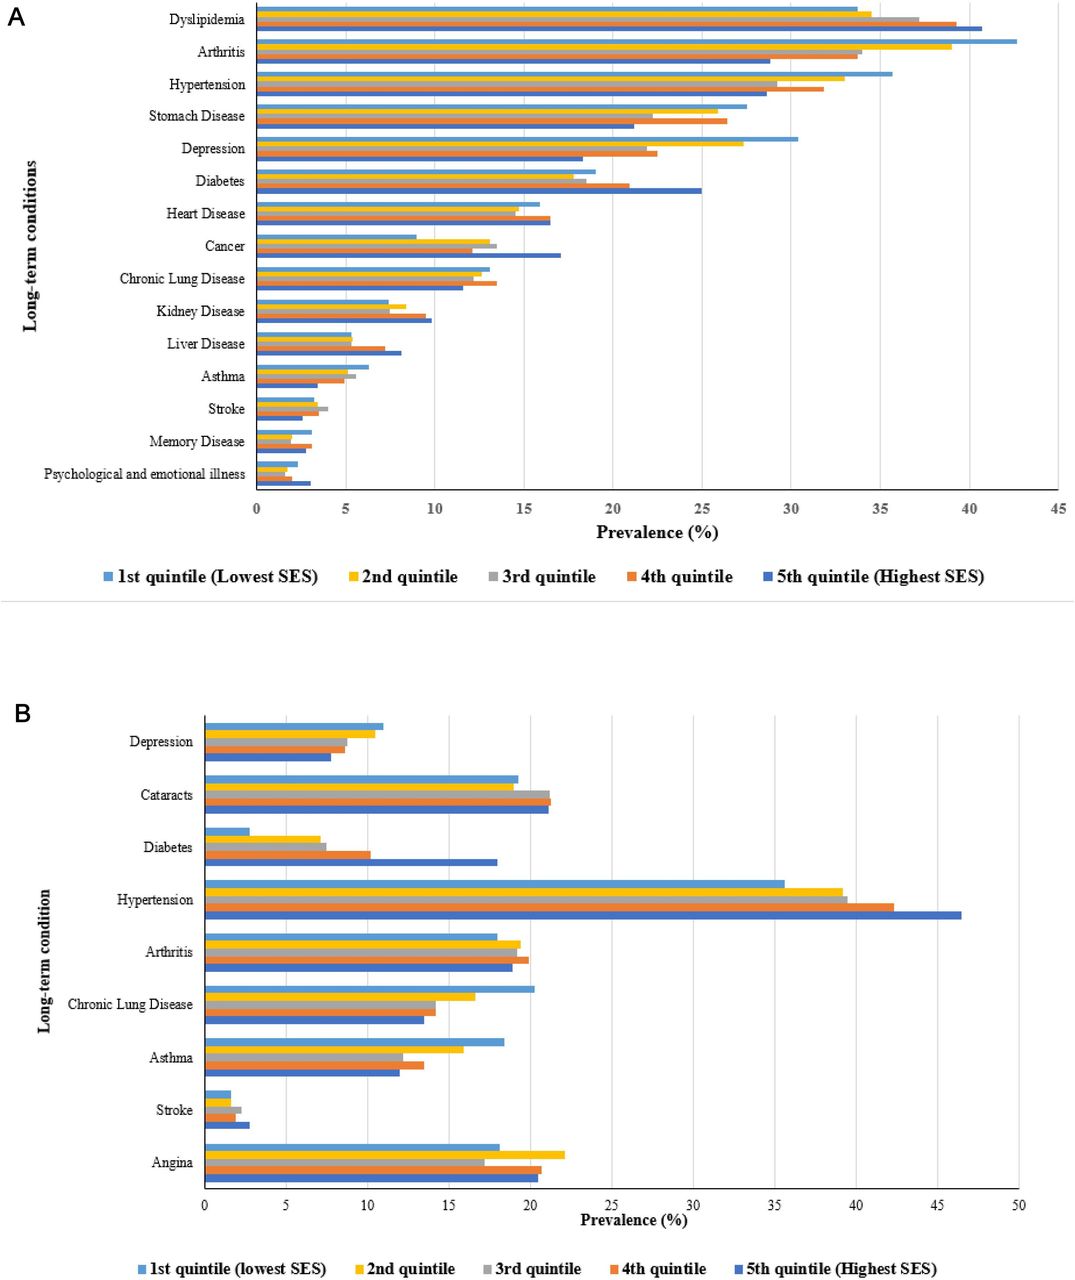
In China, the overall prevalence of any type of multimorbidity was 63.4% which ranged from 47.2% (45–54 years) to 76.4% (75 years and above). The prevalence of coexisting physical–mental health multimorbidity was 23.2%. Among patients with any long-term health condition, 38.6% of those with complex multimorbidity (table 1). The most common LTC was dyslipidaemia (37.4%), followed by arthritis (35%) and hypertension (31.4%) (online supplemental figure S3) while that of depression was 23.5%. For patterns of multimorbidity, the most common dyad was asthma and chronic lung disease (75.6%) (figure 1A). The most common physical–mental multimorbidity dyad was depression and arthritis (63.2%) (figure 1). Hypertension, arthritis and depression have a higher prevalence among respondents with the highest economic status whereas diabetes, dyslipidaemia and cancer have a higher prevalence in the lowest economic statu (figure 2B).

The prevalence of coexisting long-term conditions for each long-term condition for people with multimorbidity in China, 2015 (A); The prevalence of coexisting long-term conditions for each long-term condition for people with multimorbidity in India, 2015 (B). (A) Data source: China Health and Retirement Longitudinal Survey. (B) Data source WHO Study on Global Ageing and Adult Health survey, wave 2.
Prevalence of long-term conditions by socioeconomic status (SES) in China, 2015 (A); Prevalence of long-term conditions by SES in India, 2015 (B). (A) Data source: China Health and Retirement Longitudinal Survey. (B) Data source WHO Study on Global Ageing and Adult Health survey, wave 2.
In India, the overall prevalence of any type of multimorbidity was 42.2%, that ranged from 31.4% (45–54 years) to 57.3% (75 years and above). The prevalence of physical–mental health comorbidity was 8.2% with percentage of these individuals ranging from 7.2% (45–54 years) to 10.7% (75 years and older). Among patients with any long-term health condition, 20.9% of those with complex multimorbidity (table 2). The most common LTC was hypertension (40.83%) and the prevalence of depression was 9.27% (online supplemental figure S4). The most common dyad was diabetes and hypertension (71.9%). The most common physical–mental multimorbidity dyad was depression and hypertension (48.1%) (figure 1B). Our results show hypertension and diabetes were more common in the respondents with the highest economic status whereas depression, asthma and chronic lung disease was more common in the lowest economic status (figure 2B).
Patterns of multimorbidity
Online supplemental table S4 presents the multimorbidity patterns in China. An increase in age was associated with a higher odds of multimorbidity. When compared with individuals aged between 45 and 54 years, those that are 55–64 years, had an AOR of 2.47 (95% CI 2.13 to 2.86, p<0.001); 65–74 years had an AOR of 3.49 (95% CI 2.95 to 4.13, p <0.0001) and those 75 years and above had an AOR of 3.82 (95% CI 2.94 to 4.97, p<0.0001). Males were associated with a lower odd of multimorbidity when compared with females (AOR 0.86; 95% CI 0.76 to 0.97; p=0.016). Marital status and SES showed no significant effect on the odds of multimorbidity.
Online supplemental table S5 shows the multimorbidity patterns in India. An increase in age was associated with a higher odds of multimorbidity. When compared with individuals aged 45–54 years, those aged 55–64 years had an AOR of 1.51 (95% CI 1.30 to 1.75, p <0.001); 65–74 years had an AOR of 2.06 (95% CI 1.68 to 2.52, p<0.0001) and those aged 75 years and above had an AOR of 2.58 (95% CI 2.07 to 3.21, p<0.0001). Males were associated with a lower odd of multimorbidity when compared with females (AOR 0.85; 95% CI 0.75 to 0.96; p =0.011). Online supplemental table S5 suggests significant heterogeneity in the prevalence of multimorbidity across states in India. For instance, when compared with living in Utter Pradesh, Karnataka had an AOR of 1.33 (95% CI 1.01 to 1.75; p=0.039), Maharashtra had an AOR of 1.35 (95% CI 1.00 to 1.81; p=0.047). Rajasthan had an AOR of 2.17 (95% CI 1.69 to 2.78, p<0.0001) and West Bengal had an AOR of 1.88 (95% CI 1.48 to 2.38; p<0.0001). On the other hand, those living in Assam showed no significant effect on the odds of multimorbidity. Rurality, residence, religion, marital status, caste, socioeconomic and health insurance status showed no significant effect on the odds of multimorbidity.
Associations between multimorbidity and OOPE for medicines
In China, online supplemental table S6 shows that a one-unit increase in the number of physical LTCs was associated with an 18.5% increase in OOPE for medicines (p<0.05). There was no association between the presence of mental health conditions and OOPE for medicines. In India, online supplemental table S7 shows that as the number of physical LTCs increased by one unit, OOPE for medicines increased by 20.9% (p<0.05). In both China and India, the coefficients for the interaction term between the number of physical LTCs and presence of a mental health condition was not statistically significant. This suggested that the amount of OOPE for medicines of physical and mental LTCs is similar the expected given the independent costs of each types of the LTCs.
Online supplemental table S8 shows that in China, liver disease was associated with highest increase in OOPE for medicine by 61.6% (p<0.05) compared with individuals with no disease. Online supplemental table S9 shows that in India, stroke was associated with the highest increase in OOPE for medicine of 131.6% (p<0.05). In both China and India, diabetes showed the second highest increase in OOPE for medicine with 58.4% (p<0.05) and 91.6% (p<0.05), respectively.
Association of multimorbidity and OOPE by economic groups and health insurance
Online supplemental tables S10 and S11 examines whether the associations between multimorbidity and OOPE for medicines vary by economic groups. As the coefficients for most of the interactions between LTCs and economic groups were not statistically significant, our results indicated that these associations were similar across economic groups (p>0.05).
Online supplemental tables S12 and S13 examines the hypothesis that whether the associations between multimorbidity and OOPE for medicines vary by respondents’ health insurance coverage. Our results pointed out there were no significant differences in the effect of multimorbidity across health insurance status in China, except for the association between physical LTCs and NRCMS (coefficient for the interaction terms between NRCMS and physical LTCs=−0.36; 95% CI −0.59 to −0.12) and the association between physical LTCs and UEBMI (coefficient for the interaction terms between UEBMI and physical LTCs= -0.34; 95% CI -0.61 to -0.07). Online supplemental table S13 shows that differential effect of multimorbidity on OOPE was similar across health insurance status in India and again there were no significant associations in all interaction terms between health insurance status and LTCs.
Associations between multimorbidity and OOPE for medicines across the cost distribution
Tables 3 and 4 present the effect of the number of physical LTCs on OOPE for medicines across the cost distribution in China and India, respectively. An increase in the number of long-term physical conditions was significantly associated with greater OOPE for medicines across every quantile in India whereas it was significantly associated up to the 75th percentile in China. As expected, the effect of physical LTCs was found to be greater in the top percentiles than those in the lower percentiles in the cost distribution in both China (25th percentile: 3.6; 50th percentile: 8.4; 75th percentile: 22.5; 90th percentile: 28.3) and India (25th percentile: 25.6; 50th percentile: 48.1; 75th percentile: 106.9; 90th percentile 197.5).
Association between multimorbidity with OOPE for medicines (元 & US$) based on the generalised linear model and quantile regression model to examine cost distribution in China, 2015
Association between multimorbidity with OOPE for medicines (₹ and US$) based on the generalised linear model and quantile regression model to examine cost distribution in India, 2015
Sensitivity analyses
To account for large zero in the OOPE outcome, we conducted two sensitivity analyses using a two-part model consisting of a logit model and a generalised linear model online supplemental tables 14 and 15 and the zero-inflated negative binomial regression online supplemental tables S16 and S17. The results from these two sensitivity analyses yielded very comparable with those in the main analysis, suggesting our findings are robust under different regression model specifications.
Discussion
Our results found that the prevalence of multimorbidity in China and India was 63.4% and 42.2%, respectively, in adults aged 45 years or more. The prevalence increased with age. Among individuals with any long-term health condition, 38.6% and 20.9% of those had complex multimorbidity in China and India, respectively.
An increased number of LTCs was associated with increasing OOPE for medicines. In India, stroke was associated with highest OOPE for medicines and this was the case for liver disease in China. Diabetes, one of the largest disease burdens in both China and India, had the second largest increase in OOPE for medicines in both countries.50 High OOPE associated with stroke and liver disease can be attributed to a variety of factors, including patients who may require multiple medications, high costs of these medications and insufficient coverage of medical costs in India and China.51 52 As a result, more research is required to determine why different LTCs affect OOPE for medicine in different ways.
Our quantile regression models provide more detailed and comprehensive information on the associations between multimorbidity and OOPE for medicines across the cost distribution that previous studies have not shown.53 The strong association between the severity of multimorbidity and OOPE for medicines is consistent with a recent systematic review which has highlighted that patients with an increasing number of LTCs will experience increasing OOPE for medicines. However, the systematic review included only one study from India and no studies from China.36 Earlier studies on the prevalence of complex multimorbidity were primarily based in high-income countries,33 34 54 and our study is the first large scale study to investigate the prevalence of complex multimorbidity in two middle-income countries with the largest populations in the world—China and India, based on nationally representative survey data. Our study found high prevalence of complex multimorbidity among the adult populations in both countries, indicating the need for further research around prevention and treatment of complex multimorbidity in these countries and LMICs in general.
Our findings provide new evidence to inform the development of targeted policies and interventions to tackle the growing financial burden of multimorbidity in LMICs. With rapidly ageing population, China and India are both facing a rapidly growing burden of multimorbidity. Efforts to reduce multimorbidity risk factors are integral to prevention strategies to reduce disease burden, avoidable mortality, OOPE and financial risk. Such efforts include greater investment in cost-effective public health interventions for risk factor reduction including reduced pollution, effective implementation of Framework Convention on Tobacco Control and the Global Strategy for Diet, Physical Activity and Health.55 56 These interventions are effective in reducing common risk factors shared by cardiovascular diseases (CVDs), cancer, diabetes and chronic respiratory disease. These interventions should be targeted to those at greatest risk by conducting risk profiling at the population level and designing focused prevention and treatment strategies with appropriate strengthening of health services.57 58 These targeted interventions should then be integrated into health policies at the national level in the context of centralised China or at the subnational level for India where the primary responsibilities for health is at the state level.59
WHO Package of essential noncommunicable, high-impact cost-effective interventions could be delivered at the primary care level.60 However, healthcare delivery in both China and India are highly hospital-based and fragmented, with little coordination among healthcare providers across different tiers of the system.61 In China and India, stronger primary healthcare, underpinned by multidisciplinary teams is critical for addressing health and economic burden of multimorbidity.3 62 Health systems may need to adapt from single-disease responsive models to new financing and service delivery models to prevent and manage multimorbidity more effectively. Studies are needed to develop suitable care delivery models for multimorbidity and should include infectious diseases that are common on both countries, such as TB. Rigorous evaluation of these new healthcare delivery models is warranted to ensure effectiveness, efficiency and quality of care.
China has undertaken major reforms to increase population access to essential medicines over the last decades with notable increase in social health insurance coverage for prescription drugs.63 Recent studies suggest that the current reimbursement rate is around 45% for medicines in an outpatient setting, however, the monthly reimbursements are capped at a relatively low rate.64 65 Optimising a health insurance system plays an extremely important role in improved financial risk protection. At the end of 2015, China had officially announced the merger of the UEBMI and the NRCMS,17 representing a commendable milestone towards UHC.16 However, the current health insurance system still leaves much financial risk for households to bear, and a relatively high incidence (5.14%) of health impoverishment. In the implementation of this integration, the most critical element was the further extension of funding pools and narrowing of disparities in covered services and medications between the Unified Resident Health Insurance and UEBMI.15 This new phase in China’s reform needs special attention devoted to disadvantaged groups, particularly the poor and households with members suffering multiple chronic diseases. Extending insurance coverage to include long-term care for chronically ill patients, essential medications, outpatient and rehabilitation services are a priority. The reform of the Public Medical Assistance System could also be deeply integrated with National Poverty Alleviation Projects, giving priority to a comprehensive benefits package with services and cost-sharing mechanisms for citizens with multimorbidity.
An earlier study in India has indicated that almost 50% of the population does not have regular access to essential medicines and the proportion of out-pocket-payments as a percentage of total health expenditures was at the high rate of 62.6% in 2015.66 An important first step in improving access and affordability to essential medicines is to define an essential medicines list on the basis of effectiveness, quality and cost, followed by inclusion of this list in public health insurance benefits, supported by price regulation and efficient procurement and delivery of a single payer public health financing programme.67
As part of its commitment to Sustainable Development Goals, India recently launched major public health insurance expansion through the Rashtriya Swasthya Bima Yojana and Pradham Mantri Jan Arogaya Yojana.68 The programme aimed to help lower financial barriers of low-income households to access to essential medicines and UHC. However, affordability of quality healthcare and essential medicine could pose a challenge for low-income and middle-income households. Individuals in India still incur high levels of OOPE for medicines. For instance, between 1998 and 2005, low-income groups in India spent around 27%–34% of their annual income on care for LTCs, where the largest proportion of the expenditure (65% of the OOPE) was for medicines.69 Thus, expanding health insurance coverage to all individuals in India and ensuring the affordability of essential medicines is key to reducing OOPE.
The study has several limitations. First, the cross-sectional study limits the causal interpretation of our findings.70 Further studies are warranted to investigate the long-term or dynamic effect of multimorbidity using panel or cohort study design. Second, similar to other studies based on survey datasets, our study is subject to well-known self-reported bias for chronic disease status. It is also worth mentioning that the measures in CHARLS and SAGE are not completely comparable because (1) the number of LTCs measured are not equal, (2) there are differences in the type of LTCs measured and (3) the clinical measurements for depression, CIDI and CESD are not exactly comparable. This could lead to underestimation of the prevalence of LTCs and prohibits us from comparing the outcome variable between China and India. Our study had a potential limitation in that our outcome variable was OOPE for the last visit. However, CHARLS and SAGE do not include data on patients' total OOPE in the previous year. A calculation to determine OOPE for medicines over the year was considered, but it was based on the assumption that OOPE would be the same for each visit. This is unlikely in this case because patients seek outpatient care for a variety of reasons. Some visits may necessitate patients purchasing medications, while others may not. As a result, patients may incur varying amounts of OOPE. Another limitation of the study is the inability to conduct analyses on individuals who used inpatient services. This is due to the small proportion of people using inpatient services in both India (6.84%) and China (6.5%) in the survey sample. Appropriately powered future studies are needed to ascertain how multimorbidity, different multimorbidity dyads and complex multimorbidity affect hospital inpatient admissions and OOPE for hospital care and medicines.
In conclusion, multimorbidity is associated with substantial increase in OOPE for prescription medicines in China and India. Our study calls for acceleration of UHC and policy interventions to extend coverage of health insurance and to reduce financial burden associated with prescription medicines in LMICs.
Data availability statement
Data are available on reasonable request. The CHARLS dataset is freely available to researchers. Researchers can gain access to the data at http://charls.pku.edu.cn/index/en.html. The SAGE dataset is available to researchers, on request, at https://iipsindia.ac.in/content/SAGE-wave-2.
Ethics statements
Patient consent for publication
Ethics approval
This study involves human participants and was approved by Biomedical Ethics Review Committee of Peking University and research review boards of Indian Nodal Institution, the International Institute for Population Sciences, and from the WHO Ethical Review Committee. Ethical approval number: IRB00001052-11015.
Acknowledgments
This article uses data from WHO Study on Global Ageing and Adult Health (SAGE) Wave 2 version 1 and China Health and Retirement Longitudinal Study (CHARLS) Wave 3 version 1. SAGE is supported by the US National Institute on Aging's Division of Behavioral and Social Research and the WHO's Department of Health Statistics and Information Systems. CHARLS is supported by Peking University, The National Natural Science Foundation of China, Behavioral and Social Research division of the National Institute Aging of the National Institutes of Health in the USA and the World Bank Group.
References
Supplementary materials
Supplementary Data
This web only file has been produced by the BMJ Publishing Group from an electronic file supplied by the author(s) and has not been edited for content.
Footnotes
Handling editor Lei Si
Twitter @RifatAtun, @timarthias
Contributors DTVL and JL conceived the article. DTVL conducted the statistical analyses. YZ provided assistance in the statistical analyses. DTVL, JL and TM wrote the first draft of the paper. PA, RA, YZ, SM, BM, SP and RP revised the first and subsequent drafts. All authors contributed to interpretation of the findings and revised the manuscript for important intellectual content.
Funding The authors have not declared a specific grant for this research from any funding agency in the public, commercial or not-for-profit sectors.
Competing interests None declared.
Patient and public involvement Patients and/or the public were not involved in the design, or conduct, or reporting, or dissemination plans of this research.
Provenance and peer review Not commissioned; externally peer reviewed.
Supplemental material This content has been supplied by the author(s). It has not been vetted by BMJ Publishing Group Limited (BMJ) and may not have been peer-reviewed. Any opinions or recommendations discussed are solely those of the author(s) and are not endorsed by BMJ. BMJ disclaims all liability and responsibility arising from any reliance placed on the content. Where the content includes any translated material, BMJ does not warrant the accuracy and reliability of the translations (including but not limited to local regulations, clinical guidelines, terminology, drug names and drug dosages), and is not responsible for any error and/or omissions arising from translation and adaptation or otherwise.