Article Text

Abstract
Introduction To improve access to assistive products (APs) globally, data must be available to inform evidence-based decision-making, policy development and evaluation, and market-shaping interventions.
Methods This systematic review was undertaken to identify studies presenting population-based estimates of need and coverage for five APs (hearing aids, limb prostheses, wheelchairs, glasses and personal digital assistants) grouped by four functional domains (hearing, mobility, vision and cognition).
Results Data including 656 AP access indicators were extracted from 207 studies, most of which (n=199, 96%) were cross-sectional, either collecting primary (n=167) or using secondary (n=32) data. There was considerable heterogeneity in assessment approaches used and how AP indicators were reported; over half (n=110) used a combination of clinical and self-reported assessment data. Of 35 studies reporting AP use out of all people with functional difficulty in the corresponding functional domains, the proportions ranged from 4.5% to 47.0% for hearing aids, from 0.9% to 17.6% for mobility devices, and from 0.1% to 86.6% for near and distance glasses. Studies reporting AP need indicators demonstrated >60% unmet need for each of the five APs in most settings.
Conclusion Variation in definitions of indicators of AP access have likely led to overestimates/underestimates of need and coverage, particularly, where the relationship between functioning difficulty and the need for an AP is complex. This review demonstrates high unmet need for APs globally, due in part to disparate data across this sector, and emphasises the need to standardise AP data collection and reporting strategies to provide a comparable evidence base to improve access to APs.
- health services research
- public health
- systematic review
Data availability statement
Data are available in a public, open access repository. All data relevant to the study are included in the article or uploaded as supplementary information. The study protocol is currently available at https://at2030.org/estimating-need-and-coverage-for-five-priority-assistive-products/. All data extracted for this review will be publicly available in the AT Data Portal, available at https://at2030.org/at-data-portal/map/ from March 2022.
This is an open access article distributed in accordance with the Creative Commons Attribution Non Commercial (CC BY-NC 4.0) license, which permits others to distribute, remix, adapt, build upon this work non-commercially, and license their derivative works on different terms, provided the original work is properly cited, appropriate credit is given, any changes made indicated, and the use is non-commercial. See: http://creativecommons.org/licenses/by-nc/4.0/.
Statistics from Altmetric.com
Key questions
What is already known?
Access to assistive technology (AT) is limited globally, especially in low/middle-income countries (LMICs), largely due to sparse, disparate data on assistive products (APs).
Currently, there exists no dedicated repository of population-based AP research.
As a result, many governments lack coherent information about unmet AP need, which can hinder development of evidence-based programmes and policies to address this gap.
What are the new findings?
The finding of high unmet need (>60%) for each of the five APs emphasises the need to secure political prioritisation and funding to expand access to AT globally.
Vision is proportionately overrepresented in the literature, with 76% of studies reporting all or in part on glasses. ‘AP use’ was reported 195 times overall (30% of all 656 indicators), making it the most commonly reported AP indicator from this dataset.
Discrepancies in how key terms related to AP access were defined likely led to overestimates/underestimates of need.
What do the new findings imply?
Synthesising disparate evidence and comparing across country contexts and functional domains provided a strong base to advocate for increasing access to APs, while identifying underrepresented regions, populations and APs.
The evidence basis in LMICs is particularly sparse, demonstrating that knowledge gaps are widest, where AP access is the most limited.
The development of a global minimum dataset on AP research is needed, as well as future research that disaggregates domain-specific and region-specific AP access by additional variables (eg, gender, income and education).
Introduction
Assistive technology (AT) includes assistive products (APs) and related services that can improve health and well-being, enable increased independence and foster participation for people with functional difficulties, including older adults and people with impairments or chronic health conditions.1 This paper uses the umbrella term ‘functional difficulty’ (FD) to refer to all of these groups.
The WHO estimates 2.4 billion people globally have FD and over 1 billion need APs and related services.2 This need is expected to rise as populations age, which forecasts an increase in years lived with FD.2 Furthermore, in some low/middle-income countries (LMICs), higher prevalence of chronic and infectious disease and injury-related morbidity, coupled with a shortage of trained care workers, results in higher overall rates of FD and associated increased demand on healthcare, rehabilitation and AT service delivery systems.3 The SARS-CoV-2 (COVID-19) pandemic has also resulted in increased FD prevalence due to disruptions of health/rehabilitation services and its direct impact on health and functioning.4 This includes ‘long COVID-19’, where symptoms decreasing functional abilities persist, the full impact of which is yet to be fully realised.5 6
Despite AT’s critical relevance to all 17 sustainable development goals, the sector has not received equitable attention on the international agenda.7 Data on AP need are essential to support decision-makers to secure political prioritisation, identify causes of delivery system bottlenecks, and implement interventions to address population-level AT access.8 Information on this access is lacking, including estimates of use, unmet needs, and met needs, due in part to the complexity of assessing individuals for AP need.9 Further, due to disparate patterns of data collection, analysis, and reporting, it’s often unclear what data are available and impactful data may go unused. An essential next step is, therefore, to centralise and collate available data indicating AP access and synthesise learnings across APs and functional domains to inform the sector overall.
Assistive product lists (APLs) (PAPs) are used to focus and coordinate efforts to expand AP access. Further specifying a list of priority assistive products (PAPs) at the national level is encouraged in specific countries to ensure the list is contextual and based on their unique needs. The WHO Global Cooperation on Assistive Technology’s priority assistive product list presents a global list of 50 priority APs.10 Of these, ATScale,11 a Global Partnership for Assistive Technology, selected five priority APs corresponding to four functional domains: hearing aids (hearing), limb prostheses and wheelchairs (mobility), glasses (vision) and personal digital assistants (PDAs) (cognition).10
Aims
To contribute to a global effort to increase the AT evidence base, we conducted a systematic review of studies, which generated population-based AP access indicators for the five priority ATScale APs. This review aims to (1) characterise existing population-level research producing AP access indicators and (2) present and synthesise indicators globally to support scaling up AT provision.
This review builds on the findings of an initial scoping review, commissioned by the WHO and published separately,9 which primarily focused on the strengths, limitations and most effective contexts for different methods used for estimating AP supply and demand at market level in AT research. Results from these methodologies are explored in this systematic review.
Methods
The systematic search was conducted in March 2020 and included peer-reviewed articles and grey literature with findings on APs. The Preferred Reporting Items for Systematic Reviews and Meta-Analyses statement was followed throughout review.12
AP access indicators defined
Population-level AP access indicators are variably used and defined in the literature. Table 1 shows the definitions used for the purposes of this review, developed by drawing on authors’ expertise and relevant background literature (table 1).9 These terms are referred to as ‘indicators’ throughout this paper.
AP access indicators definitions and calculations
Search strategy
Fifteen databases were searched for empirical and grey literature using a set search string specifying (1) a synonym for AP or the name of the actual AP, (2) an indicator and (3) a synonym for FD in the study’s title/abstract (online supplemental appendices 1 and 2). Studies were exported to the Rayyan QCRI web application13 to remove duplicates and screen abstracts.
Supplemental material
Eligibility criteria
Our search included studies published between 2000 and 2020, written originally in English, French, Portuguese, or Spanish, or providing a translation. Studies were eligible for inclusion if they met the following criteria during full text review:
Review
After removing duplicates, all titles and abstracts were initially screened for any mention of AT or FD. Remaining abstracts were then reviewed by two authors, according to eligibility criteria.9 In addition, eligible systematic reviews were cross-referenced; any relevant citations missing from our searches were added. All full texts were then reviewed by two authors. Conflicts at all stages were settled by a third reviewer.
Data extraction and analysis
Data were extracted from full texts and entered into a data portal designed by authors to standardise data extraction for the following: study setting, population, design, assessment methodologies, impairment definitions used, and indicators, including numerator and denominator values (online supplemental appendix 3).
Indicators were included if (1) they were directly reported in the results of studies, meaning they aligned with our terms and definitions (table 1) or (2) they were indirectly reported, meaning it was possible to calculate them using clearly defined data provided in the articles (demonstrated in online supplemental appendix 4).
Given substantial variation in how indicators are presented and reported, not all results were directly comparable and a meta-analysis could not be conducted. Where studies present pooled estimates from previously published results (eg, reviews), the unique pooled indicator was extracted. To facilitate comparison across studies where possible, indicator denominators are denoted in our results tables with the following labels:
Total population: the broader regional or national population from which the study sample was drawn. This denominator is larger than the number of participants when study results are only presented as extrapolations.
Total in analysis: all participants included in the study’s analysis. This may be smaller than the number of total participants reported in a study, as some participants may not complete all components of the assessments.
Total with FD: all study participants assessed to have the relevant impairment (eg, vision impairment) or functioning difficulty (eg, difficulty seeing). Some studies only include individuals with impairment/FD as participants or in the analysis.
Total with need: all participants assessed to have need of the relevant AP. Some studies consider all participants with impairment/FD as needing an AP.
Total with AP: all participants who already have an AP.
Most included vision AP studies reported on vision assessments done at 6 m. Alternative definitions (eg, 20 ft, log MAR) were converted to 6 m using the NIDEK conversion chart.14 For distance vision studies, prevalence estimates for uncorrected and undercorrected refractive error were also extracted, as these equate to unmet and undermet need for glasses, respectively. Results for ‘refractive error’ only (ie, without specifying uncorrected or undercorrected) were not extracted.
Risk of bias in individual studies
The Critical Assessment Tool for Prevalence Studies from the Joanna Briggs Institute (JBI) was used to evaluate all included full texts.15 We adapted this tool by adding a 10th criterion: ‘The study describes its ethical approval, including how consent was obtained from participants’. We present each study’s summary score and specific missing checklist criteria (online supplemental appendix 5).
This review was not registered with PROSPERO due to its relation to the scoping review,9 which necessitated the extraction of some overlapping systematic review data during the scoping review process. PROSPERO does not register scoping reviews and will not register systematic reviews which have already begun data extraction.
Role of the funding source
The funder of the study had no role in study design, data collection, data analysis, data interpretation or writing of the report.
Patient and public involvement
Patients and the public were not involved in any way in this research.
Results
This section first details overall study selection and characteristics. Next, results including AP indicators are presented for each AP, grouped by functional domain.
Study selection
Of 14 898 unique records identified, 1238 abstracts mentioned AT and/or FD (JD). Ten per cent (n=1336) of discarded records were reviewed by a second author (CH, DB and SP) with 100% agreement. Seven reviews were identified at this stage and cross-referenced, adding 22 abstracts (JD, DB and ES). Of 1260 total abstracts, 514 met inclusion criteria, determined by two authors (JD, DB, VDR, SP, CH and ES). Following full-text review, 207 articles met inclusion criteria (with 96% inter-rater agreement) (JD, DB, VDR and ES). Studies excluded at this stage are listed in online supplemental appendix 6. Figure 1 details the full review process. Corresponding authors were contacted for all articles missing full texts (initially n=85), resulting in seven additions (JD). All extracted data were double-checked (JD, AK, VDR, DB, ES, SP and CH).
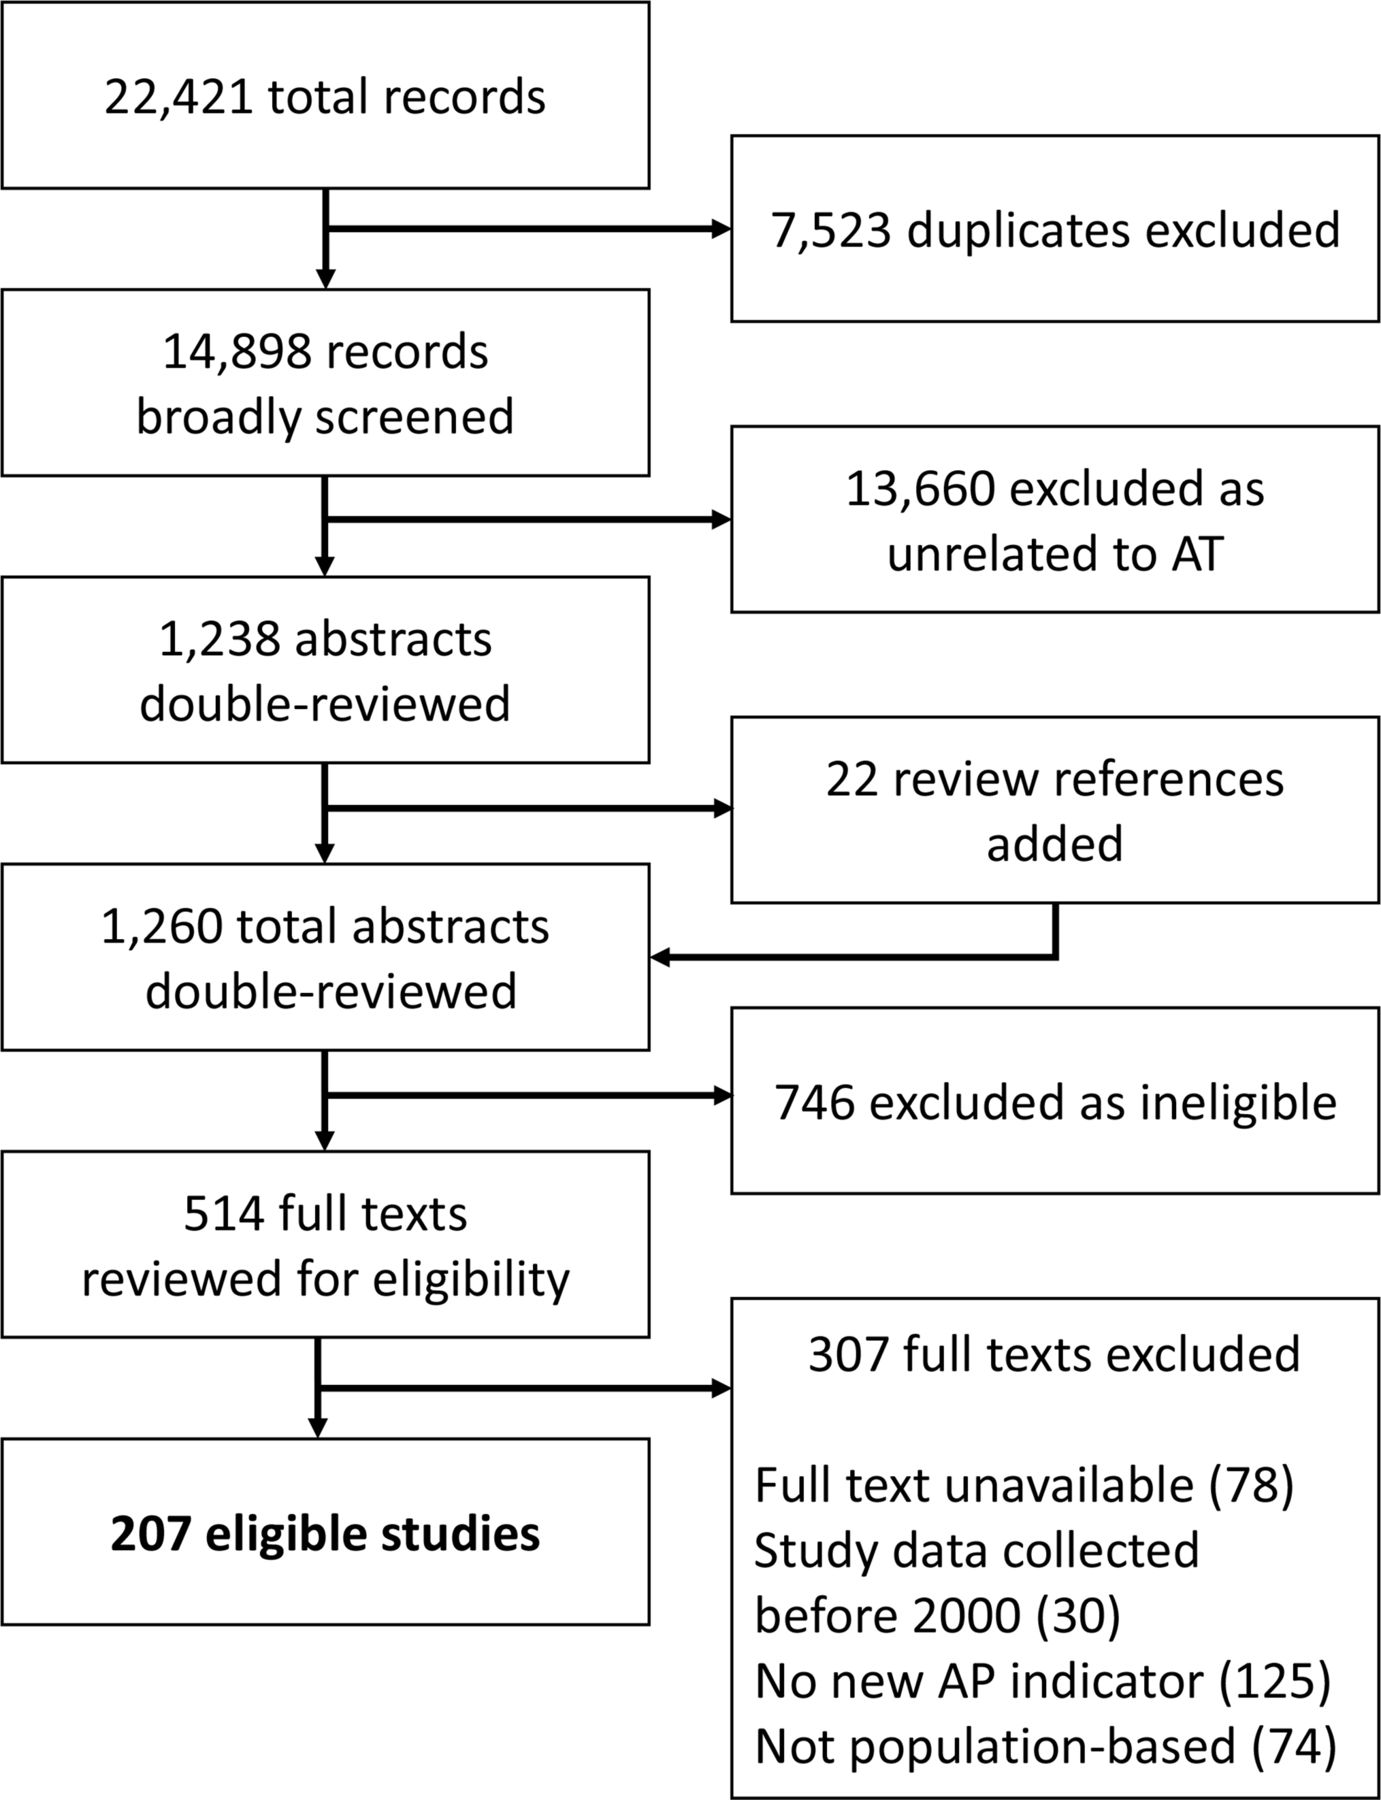
Study selection. AP, assistive product; AT, assistive technology.
Included study characteristics
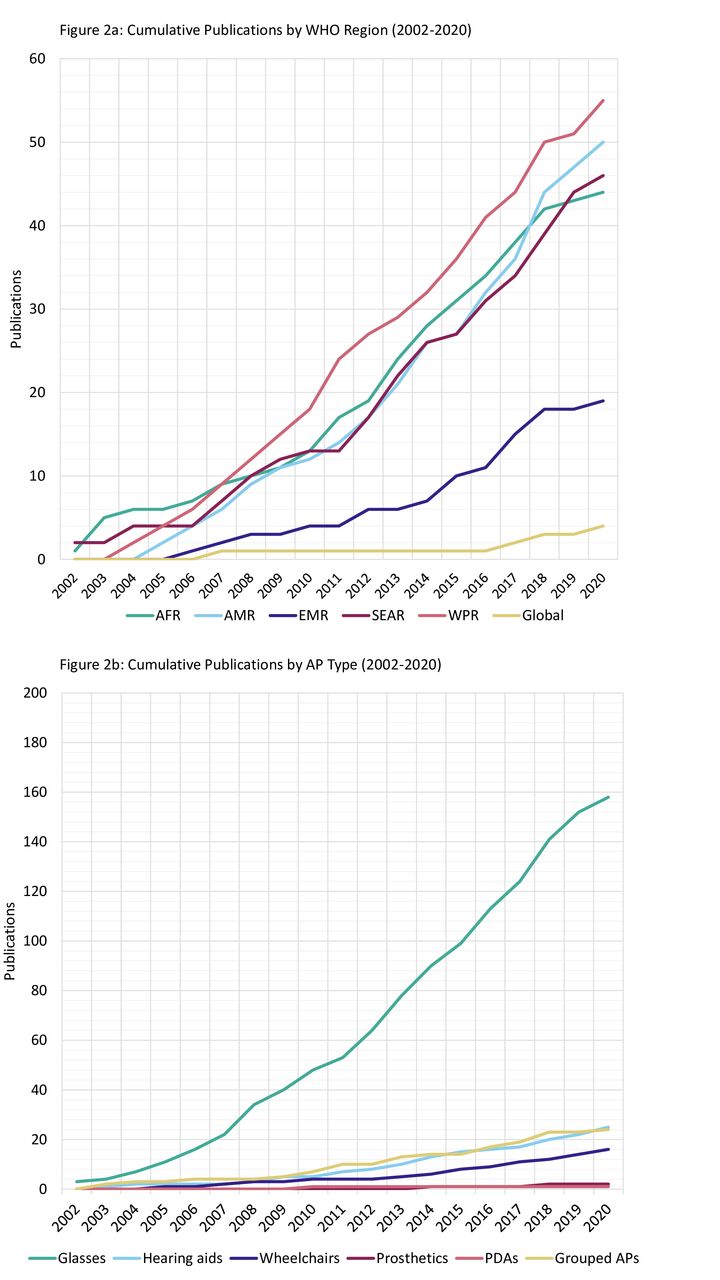
All studies were published between 2002 and 2020. The cumulative frequency of studies published each year is shown by WHO region and AP type in figure 2A,B. The most represented region was the Western Pacific Region (WPR) (n=55, 27%), specifically China (n=29/55, 53%), followed by the Region of the Americas (AMR) (n=50, 24%), specifically the USA (n=27/50, 54%) and the Southeast Asian Region (SEAR) (n=46, 22%), specifically India (n=31/46, 67%).

Cumulative publication frequency by WHO Region (A) and AP type (B). AP, assistive product; PDAs, personal digital assistants.
Figure 2B demonstrates most studies (n=158, 76%) presented indicators for glasses, compared with the other APs.
In terms of study design, the vast majority were cross-sectional (n=199, 96%), using primary (n=167) and secondary data (n=32). Common assessment approaches included clinical (n=60), self-report (n=37), or a combination of both (n=110, 53%).
The youngest included age was zero (included in 27 studies) and 129 studies (62%) included no age maximum. Nineteen studies (9%) include most or all ages (<3 years to >84 years). Children <13 years are included in 91 studies overall (44%) and 20 exclusively (10%), while adults >64 years are included in 137 overall (66%) and 13 exclusively (6%).
The average JBI score among all 207 studies was 9.3/10, with 50% (n=104) achieving all 10 checklist items, and only one scoring below 7. By domain, the average JBI score ranged from 8.6 to 9.3. The most missed items were #2 (appropriate or well-described sampling of study participants) (n=30), #4 (study subjects and setting described in detail) (n=49) and our added #10 (consent and ethical approval detailed) (n=18) (online supplemental appendix 5).
AP access indicators
Overall, 656 AP access indicators were extracted. High-level results are presented for each AP, grouped by functional domain (tables 2–5) with all indicators from each study listed in online supplemental appendices 7-11. Studies reporting data, which could be disaggregated by comparable need indicators, are also included in figure 3A–E and online supplemental appendix 12.

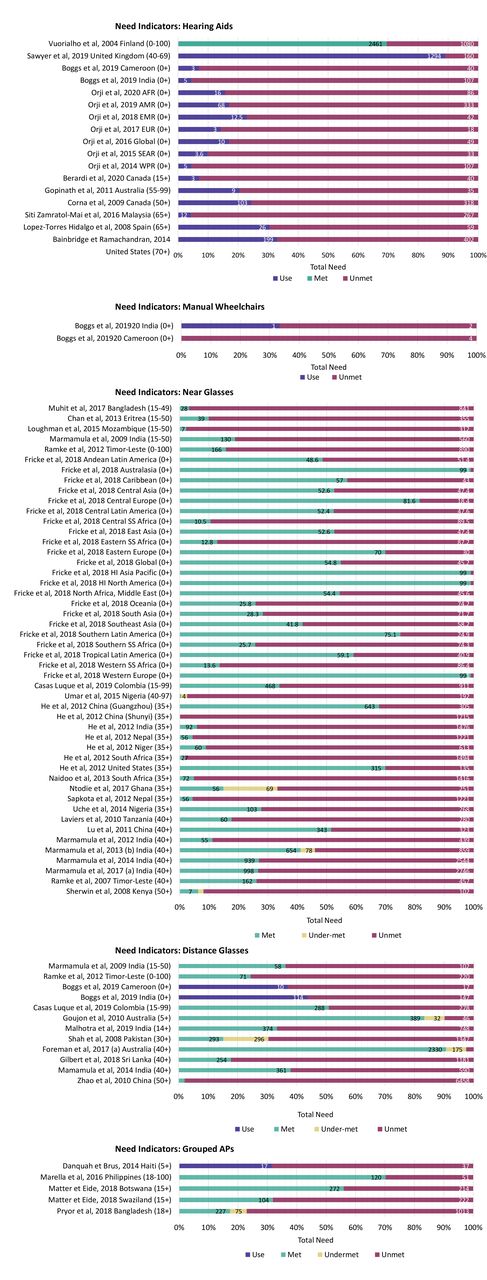
Need indicators for hearing aids (A), manual wheelchairs (B), near glasses (C), distance glasses (D) and grouped APs (E). HI, High-Income; SS, Sub-Saharan.
Hearing aid studies and indicators
Mobility AP studies and indicators
Near and distance glasses studies and indicators
Grouped and cognitive AP studies and indicators
Hearing
In total, 25 studies (12%) provided 62 indicators on hearing aid access, detailed in table 2 and online supplemental appendix 7.16–40 Nearly all were based on primary (n=10, 40%) or secondary analyses (n=14, 56%) of cross-sectional studies. The majority (n=18, 72%) used multiple assessment approaches, while self-report was exclusively used by 4 (16%) and clinical assessment by 2 (8%). All but one study38 assumed all participants identified as having a hearing difficulty also needed a hearing aid (ie, prevalence of hearing difficulty equals hearing aid need were the same). The proportion of participants with hearing difficulty who were using hearing aids ranged from 4.5%38 to 47.5%,34 although the definition of hearing difficulty varied between these studies (online supplemental appendix 7). Ten studies across 17 settings informed on total need. Figure 3A demonstrates high unmet need for hearing aids, with most settings (n=16, 89%) showing over 60% unmet need (ie, >60% of people assessed to need a hearing aid did not have one). All of these studies reported unmet need, but only one also reported met need33 while the others substituted AP use.
Mobility
Fifteen studies (7%) reported 42 access indicators for mobility APs, including prosthetics, motorised and manual wheelchairs. Characteristics are included in table 3 and all indicators in online supplemental appendix 8.17 22 25 27 30 40–49 Most mobility AP studies (n=11, 73%) were secondary analyses of national-level surveys/censuses. Six studies relied entirely on self-reported assessment of activity limitation and/or AP need and seven used self-reported AP use to approximate functioning difficulty or impairment prevalence. AP use was the most reported indicator (n=26/42, 62%). Among the total with mobility difficulty, use of any type of mobility AP ranged from 0.9% (both prosthetics and motorised wheelchairs)30 to 17.6% (manual/unspecified wheelchairs) (online supplemental appendix 8).45 Only one clinical impairment assessment study22 presented AP indicators allowing disaggregation of total need, showing high unmet need (>65%) for manual wheelchairs in two settings among those who needed the AP (figure 3C).
Vision
Vision results are presented in three categories: near/reading glasses (n=35), distance glasses (n=31) and bifocal/combined/unspecified (‘grouped’) glasses (n=124). High-level results for near and distance glasses are combined in table 4, with specific results for each type described separately in-text. All included studies and indicators are available for near and distance glasses in online supplemental appendix 922 50–100 and grouped glasses in online supplemental appendix 10.27 30 40 51–55 62–65 72 76 78 80 81 84 86 95 101–202 Need indicators for grouped glasses are also visualised in online supplemental appendix 12.
Thirty-five studies (17%) provided 126 indicators for near glasses (table 4). Most were primary cross-sectional (n=32; 91%) and used a combination of clinical and self-reported assessment data (n=22; 63%), while 11 (31%) used clinical assessment data only. The most reported indicators were unmet (n=49; 38%) and met need (n=30; 24%). Near glasses use among individuals with vision difficulty ranged from 0.1%64 to 89.5% (online supplemental appendix 9).83 Twenty-one studies (60%) reported total need indicators, with 17 showing unmet need for near glasses above 60% among those who needed the AP (figure 3C).
Thirty-one studies (14%) report 107 indicators for distance glasses (table 4). All studies are either primary (n=21, 81%) or secondary (n=5; 19%) analyses of cross-sectional surveys. Sixteen studies (53%) used both clinical and self-reported assessments, with 11 (37%) relying only on clinical assessment. The most reported indicator was uncorrected refractive error (n=35/107; 33%). Among those with difficulty seeing, use of distance glasses ranged from 0.4%64 to 55.2%87 (online supplemental appendix 9). Eleven studies provided total need indicators across 12 settings, the majority (n=8/12; 67%) of which reported an unmet need for distance glasses of >60% among those who needed the AP (figure 3D).
Grouped APs and cognitive
Twenty-four studies (12%) presented 42 indicators for grouped APs, with one study also presenting a cognitive AP indicator for PDAs203 ; characteristics for all grouped AP studies are described in table 5 with all indicators included in online supplemental appendix 11.17 25 27 30 203–222 Nearly all (n=21; 88%) used only self-reported activity limitations to identify impairment or FD. ‘AP use’ was the most commonly reported indicator in the grouped domain (n=24/42, 57%), with the proportion of participants with FD using any AP ranging from 2.8%217 to 94.8% (online supplemental appendix 11).27 In three of five studies presenting total need indicators, unmet need for APs was >60% among those who needed APs (figure 3E).
Discussion
AT is gaining recognition on the international global health agenda, as evidenced in this systematic review by the increasing frequency of publications from 2000 to 2020. However, many data gaps have not been addressed. During this period, 76% (n=158) of the 207 articles reported all or in part on glasses, with fewer articles available for the other APs, emphasising data gaps in hearing, mobility and especially cognitive functional domains. Older adults (65+ years) were more often included in studies than children under 12 years, and <25% of studies focused exclusively on young children, making it challenging to identify disparities in AP need based on age. This review also highlights the heterogeneity in study design and reporting that has led to a lack of standardisation in population-based AP data collection efforts and limits comparability between settings. Total need indicators were reported from 84 study settings, the majority of which (n=57/84, 68%) reported unmet need >60% among all participants with AP need in each functional domain and in all country income contexts. Total need estimates were also commonly reported across all functional domains except mobility, though functional domains were not equally represented in these studies.
AP indicators were often used variably in the literature. The prevalence of FD was frequently equated to AP need, which can overestimate/underestimate true need and coverage.22 This approach typically lacks a holistic assessment of AP need since it does not account for important data about an individual’s personal factors, including their specific health needs, activities, participation and environmental contexts. All but one mobility study22 made this assumption and relied solely on self-reported assessments, which can be limited by participants’ poor awareness of APs or underlying causes for FD, further misestimating need.9 22 ‘Has AP’ or ‘use’ were also used to approximate ‘met need’ for an AP; all hearing aid studies indicating need reported ‘use’ in lieu of met need (excepting one18). This substitution limits understanding of AP need in multiple ways: in the literature, the ‘use’ indicator has included the use of APs that are appropriate (‘met need’) and APs that might be broken and/or inappropriate (‘undermet need’), which obfuscates remaining need. Denominators used when calculating indicators also varied considerably, encompassing individuals with need, functioning difficulty, included in the study, or extrapolated to the total population. Though the latter can provides useful measures for drawing international comparisons and evaluating trends over time, the variation in denominators overall limits comparability across studies. Each has its use in a comprehensive evidence basis, but more comparable methodology and reporting are needed to improve understanding of population-level need.
Self-reported assessments were typically employed in functional domains where a large sample size was needed and/or the relationship between the individual’s need and a specific AP is complex (eg, mobility or cognition), or multiple APs were considered (eg, grouped APs). Subsequently, clinical impairment and/or functional assessment for all participants was often not feasible. For example, most of the reviewed mobility studies were secondary data analyses, with over half using censuses or national health studies (n=10/15; 67%), while mobility studies that collected primary data tended to have very low numbers of individuals assessed as needing or already using the AP, ranging from 022 to 18640 individuals. Additionally, most studies reporting on grouped APs relied exclusively on self-reported assessment data (n=21/24; 88%). Clinical impairment assessments produce more standardised, comparable data, yet do not always capture personal factors, which are also necessary to holistically evaluate need. This demonstrates the importance of employing multiple types of data in recommending appropriate AT.9
While some established datasets based on universal care18/centralised health record systems46 223 collect potentially impactful population-level data on AP users, these data do not necessarily include everyone. Relying exclusively on these data would miss individuals obtaining their APs by other means, such as private purchase or through the non-government sector. This missing data gap will be even more pronounced where government-led AT provision is more limited. Primary cross-sectional surveys can be helpful to address this gap, yet these surveys can be resource intensive, lack comparability and generalisability, and may not produce timely data needed by AT stakeholders. Our literature presents >150 studies from LMICs, which generate valuable learnings across the sector overall. However, when narrowing to AP-specific or country-specific data, the evidence base drastically decreases, showing the limitations of relying exclusively on few cross-sectional surveys and demonstrates that the largest knowledge gaps are in areas where access to APs is lowest.
Collating this critical body of work to extract sector-wide learnings has been broached, in parts, by other reviews commissioned by the Lancet Global Health,224 the WHO,3 9 225 and development-focused institutes/governmental departments.226 227 The WHO papers cited heterogeneous approaches to assessment,3 9 225 severity of FD for inclusion,9 225 and sampling source demographics,3 9 225 as main challenges to interpreting results across publications, which mirrored our data extraction and presentation experiencePopulation-level data are overall extremely limited, and findings on need must be interpreted with caution. Appropriate research methods must also be used for this sector—RCTs are often unsuitable for AT interventions,3 and based on available data, different approaches may be more effective than others.9 Key gaps in the AT sector described in this discussion are emphasised when considering other AT reviews. Crucial research into effectiveness and follow-up of AT interventions is limited.3 9 225–227 Our review similarly found this, as most primary and secondary studies were cross-sectional and did not incorporate any follow-up data collection. Limited awareness of AT demand and effectiveness was a commonly cited barrier to expanding AT production and access.226 227 Often, available data go unused226 or are not collected alongside quality-of-life indicators.226 Furthermore, standardised impact measurement approaches are also needed.3 9 226 Regarding all types of information relevant to AT, including need indicators, supply and demand data, and product designs, more substantial diffusion is hindered by the fragmented nature of available information.226
We have four main recommendations following our comprehensive review. First, considering the methodological and reporting variation between studies, we recommend establishing a global minimum AP dataset allowing researchers to address specific questions and compare evidence. This dataset should include the following: (1) standardised measures to determine individual need for an AP; (2) standardised APs (eg, APLs);10 228 (3) standardised AP access indicators (as presented in this review) and (4) standardised approaches to measuring them. Second, we recommend the collection and use of data that holistically considers an individual’s personal and environmental factors when assessing their capacity to benefit from an AP. As more holistic measurement methodology is developed, it is critical that it is tested and adapted for diverse contexts, especially LMICs. Third, modules collecting data to inform AP indicators should be included in established population surveys to maximise existing data collection methods and enable more nuanced secondary analyses. This can be supported by working with national statistics offices in both high and LMIC countries. Finally, differentiation should be made between the total using an AP, and within that value, the total with met need. This can highlight undermet needs among AP users, which provides further data about the setting and/or population for which specific APs are not fully appropriate. To begin to collate this dataset, a global AT data portal229 accompanying this review will make all extracted study data available and more accessible. This portal will also serve as a place to host future data, employing features to map evidence and provide context across disciplines to support knowledge sharing in this sector.
Our large-scale review captured >200 studies and benefitted from including five APs across four functional domains, with a broadly inclusive search string and list of article sources. Data extraction criteria were developed to accommodate substantial variation in results reporting, so as much relevant data as possible could be considered, allowing us to extract >650 indicators. Through data extraction, we identified study settings, impairment/FD thresholds and denominators (among other factors) to ensure our comparisons and conclusions are appropriate.
However, this review has several limitations. Given the breadth of literature, we searched terms for FD rather than listing specific health conditions (online supplemental appendix 2), as there is no established list of conditions within each domain/relevant to each AP. Studies may have been missed that focused on specific health conditions without mentioning FD or APs in the title/abstract. This likely occurred for the mobility and cognitive domains, given these are less well defined in terms of which conditions could relate to certain APs. This also means we could not explore the variation in need for APs within a functional domain by certain conditions or pathologies. We also limited the review to five specific APs, while the WHO APL includes 50. Furthermore, a meta-analysis of indicators and exploration into their disaggregation by demographic factors (eg, sex, income, and education) was precluded from the remit of this review due to wide variation in methods/reporting. Finally, some vision studies also reported visual acuity measures, but extracting indicators based on these measures required clinical judgements and assumptions outside the remit of this review. Overall, future domain-specific research is recommended to address each of these limitations, including additional cognitive APs, with appropriate detail to identify sub-population-level disparities in AP access.
Conclusion
This review highlights high unmet AP need across different settings, demonstrating the need to prioritise and expand access to AT globally. It also highlighted key AP research gaps in available literature, including lack of standardised and comparable data collection and reporting methods, particularly in LMICs. These gaps must be addressed so data collection efforts can identify areas with high need and inform, monitor, and evaluate AP service planning and delivery. Improving global access to these life-changing products is essential to each sustainable development goal and our accompanying data portal229 will ensure this review is used to its fullest potential in support of this aim.
Data availability statement
Data are available in a public, open access repository. All data relevant to the study are included in the article or uploaded as supplementary information. The study protocol is currently available at https://at2030.org/estimating-need-and-coverage-for-five-priority-assistive-products/. All data extracted for this review will be publicly available in the AT Data Portal, available at https://at2030.org/at-data-portal/map/ from March 2022.
Ethics statements
Patient consent for publication
Ethics approval
Ethical approval was not required for this review.
Acknowledgments
Authors are grateful to the help of many colleagues: Priya Morjaria and Ian McCormick for visual acuity expertise and Ben Duke for preliminary data extraction.
References
Supplementary materials
Supplementary Data
This web only file has been produced by the BMJ Publishing Group from an electronic file supplied by the author(s) and has not been edited for content.
Footnotes
Handling editor Seema Biswas
Twitter @boggs_dorothy
Contributors This research was conceptualised by JD and CH, with funding acquired by CH. The investigation was conducted by JD, with input from DB, SP and CH. JD, DB, SP, VDR, ES and CH are responsible for the methodology. FR is responsible for project administration. JD and WB are responsible for software design and maintenance. Data curation was done by JD, DB, VDR, ES and AK. Formal analysis was carried out by JD with input from DB and SP. Data were validated by JD, AK, VDR, ES, SP, DB and CH. Visualisations were designed and executed by JD, with input from DB and SP. The original draft was written by JD with input from DB and SP. Reviewing and editing was done by JD, DB, SP, VDR, ES and CH, with input from AK and FR. The overall project was supervised by DB, SP and CH. JD is acting as guarantor.
Funding The research in this paper was made possible by funding from the Foreign, Commonwealth and Development Office, UK, through the AT2030 Programme, led by the Global Disability Innovation Hub (project number: 300 815 (previously 2 01 879–108)).
Competing interests None declared.
Provenance and peer review Not commissioned; externally peer reviewed.
Supplemental material This content has been supplied by the author(s). It has not been vetted by BMJ Publishing Group Limited (BMJ) and may not have been peer-reviewed. Any opinions or recommendations discussed are solely those of the author(s) and are not endorsed by BMJ. BMJ disclaims all liability and responsibility arising from any reliance placed on the content. Where the content includes any translated material, BMJ does not warrant the accuracy and reliability of the translations (including but not limited to local regulations, clinical guidelines, terminology, drug names and drug dosages), and is not responsible for any error and/or omissions arising from translation and adaptation or otherwise.