Article Text

Abstract
Whereas monetary poverty is associated with increased risk of depressive symptoms in young people, poverty is increasingly understood as a multidimensional problem. However, it is yet to be understood how the associations between different dimensions of poverty and youth mental health differ across countries. We examine the relationship between multidimensional, as well as income poverty, and depressive symptoms in young people (age 11–25 years) across three middle-income countries. Based on harmonised data from surveys in Colombia, Mexico and South Africa (N=16 173) we constructed a multidimensional poverty index that comprised five deprivations. We used Poisson regression to examine relationships between different forms of poverty with depressive symptoms across the countries. Multidimensional poverty was associated with higher rates of depressive symptoms in the harmonised dataset (IRR (incidence rate ratio)=1.25, 95% CI 1.10 to 1.42), in Mexico (IRR=1.34, 95% CI 1.11 to 1.64) and Colombia (IRR=2.01, 95% CI 1.30 to 3.10) but not in South Africa, a finding driven by a lack of associations between child labour and health insurance coverage with depressive symptoms. There was only an association with income poverty and depressive symptoms in South Africa, not in Colombia or Mexico. Depressive symptoms were associated with individual deprivations such as school lag, child labour and lack of access to health services in the harmonised dataset, but not with household deprivations, such as parental unemployment and housing conditions, though the opposite pattern was observed in South Africa. Our findings suggest that the importance of specific dimensions of poverty for mental health varies across countries, and a multidimensional approach is needed to gain insights into the relationship between youth depression and poverty.
- mental health & psychiatry
- child health
- epidemiology
Data availability statement
Data are available upon reasonable request.
This is an open access article distributed in accordance with the Creative Commons Attribution Non Commercial (CC BY-NC 4.0) license, which permits others to distribute, remix, adapt, build upon this work non-commercially, and license their derivative works on different terms, provided the original work is properly cited, appropriate credit is given, any changes made indicated, and the use is non-commercial. See: http://creativecommons.org/licenses/by-nc/4.0/.
Statistics from Altmetric.com
Key questions
What is already known?
Poverty increases vulnerability to mental health problems in young people in upper-middle-income countries (UMICs).
Most studies have measured poverty focusing on monetary deprivations at the household/parental level with very few studies measuring poverty at the level of the individual young person.
Poverty is multidimensional, though no studies have compared the relationship between depressive symptoms and multidimensional poverty in young people across countries.
What are the new findings?
The relationship between poverty and depressive symptoms among young people differs across dimensions of poverty and between countries.
The higher the multidimensional poverty, the more prevalent the depressive symptoms in Colombia and Mexico, but not South Africa.
Depressive symptoms were associated with individual deprivations, such as education, but not household deprivations, such as parental unemployment.
An opposite pattern was observed for South Africa.
What do the new findings imply?
Our results suggest the importance of different deprivations across countries.
Further longitudinal analysis and intervention using a nuanced approach that consider the specific poverty dimensions relevant for each country is critical to improve the mental health of young people in UMICs.
These results have important implications for policy as they show that potential targets for interventions targeting poverty and mental illness cycles need to be informed by locally valid deprivation measures with clear associations with mental health.
Introduction
Poverty is associated with poorer mental health outcomes,1–3 which in turn can reduce the future life chances of young people (defined as ages 10–24 years by the WHO), a particularly vulnerable group with high rates of depression.4 Poverty sets a trajectory for long-term mental health in later life,5 and it is a strong predictor of education and employment outcomes.6 7
Most research on the association between poverty and mental health has followed a monetary approach to measuring poverty, which is inconsistent with recent alternative approaches that conceptualise poverty as more complex than a shortfall of income. Some studies define poverty as consumption of goods and services, which is arguably a more material measure of poverty.2 In addition, the evidence for an association between mental health and monetary measures of poverty such as income and consumption is fairly inconsistent, with systematic reviews demonstrating that these relationships are dependent on context (such as levels of income and inequality).8 9
Multidimensional measures of poverty, conceptualise poverty as a spectrum of deprivations encompassing various dimensions of well-being.9–12 To the best of our knowledge, no studies have so far adopted a multidimensional approach to understand the relationship between poverty and mental health in young people in low/middle-income countries (LMICs).
There are two key reasons why a multidimensional approach is important to understand the link between poverty and depressive symptoms. First, this relationship may differ depending on whether poverty is measured at the household (eg, household income poverty) or individual level (eg, lack of access to education). Most studies have measured poverty focusing on deprivations at the household/parental level with very few studies measuring poverty at the level of the individual young person. Second, most studies have focused on monetary dimensions of poverty,13–15 but non-material dimensions of poverty might each have their own complex relationship with depressive symptoms. For example, education deprivations may have a bi-directional association with depression, by which poor education worsens depression outcomes, while depression in turn reduces school performance and increases drop out.16 Deprivations in access to health services and healthcare insurance may prevent young people from receiving adequate prevention and treatment for depressive symptoms.17 Housing deprivations may impose stress and reduce stability, thereby increasing depressive symptoms.18 Other deprivations related to the wider household, such as parental unemployment or income, have also been shown to increase childhood depressive symptoms through financial stress, damages to familial relationships and poor parental support.19 Psychosocial aspects of poverty may also increase depressive symptoms in young people,20 21 for example, by influencing the opportunities to achieve aspirations, which may lead to low self-esteem and psychological distress.22 23
Furthermore, there may be cross-country differences in how different dimensions of poverty relate to mental health. The relationship between multidimensional poverty and youth depressive symptoms is not necessarily the same in all countries, and it is important to understand which dimensions are more salient in different countries. This paper aims to examine these relationships across three countries—South Africa, Mexico and Colombia to explore how the association between multidimensional poverty and depressive symptoms in young people may differ between countries. While these countries share similarities, such as rapid economic growth and growing levels of income inequality, they are also distinct in their cultural, social and economic contexts. For instance, South Africa has high levels of unemployment and lower levels of earnings,24 relative to the other countries. We hypothesise that these contextual differences result in a different relationship between mental health and specific dimensions of poverty.
We make a novel contribution to the literature by assessing the relationship between depressive symptoms and multidimensional poverty in young people and comparing these relationships across different countries. Based on the multidimensional poverty index (MPI), which comprises deprivations in health, income, education and standard of living indicators,25 we aim to capture how different dimensions of poverty relate to depression in young people. One paper has used an MPI to examine this relationship Li et al,26 but they did not report on how specific deprivations relate to depression in young people.
In an earlier paper (Diaz et al, under review), we used data from Colombia to examine the nature of the relationship between multidimensional paper and mental health in Colombia. We found that poverty deprivations associated with human capital are associated with mental health, while there are less associations material deprivation. Yet, these findings may be specific to Colombia, a country with a unique history of income inequality, armed conflict and internal displacement that may render associations between different dimensions of poverty and mental health different from those in other countries. Using standardised data, the current paper aims to extend this analysis to assess this relationship in Colombia, Mexico and South Africa, three countries with very different socioeconomic, political and historical contexts. Both papers are the output of a common collaborative project funded by the UK Economic and Social Research Council, the CHANCES-6 project, whose aim is to understand the impact and mechanisms linking poverty and mental health in six LMICs. Further details of the CHANCES-6 project are available in our protocol paper published in Social Psychiatry and Psychiatric Epidemiology volume (https://link.springer.com/article/10.1007/s00127-021-02043-7).
This study focuses on depressive symptoms as depression is the most common mental health disorders among adolescents globally27 and, while depression has been shown to be associated with poverty,2 3 28 no studies have explored how this relationship differs across dimensions of poverty as well as across countries. Furthermore, this is the outcome that is most commonly measured in a consistent way across the different countries. We hypothesise that deprivations that depressive symptoms may be associated with deprivations that relate directly to young people’s aspirations or psychological sense of self, such as education or child labour, rather than deprivations defined at the household level.
Methods
Data
Data came from three nationally representative datasets for each country: the Colombian data were from the 2015 National Mental Health Survey (2015 CMHS), a nationally representative, probabilistic survey.29 The survey involved in-depth questionnaires separated by age groups, adolescents from 12 to 17 years old and adults aged 18+ years old. There were 3607 participants between the ages of 11–25 years with complete data required for this study. The Mexican Family Life Survey (MxFLS) is a longitudinal, nationally and regionally representative survey, including urban and rural areas. The sample included 8400 households in 150 communities across Mexico, collected over a 10-year period in three rounds from 2002, 2005–2006 and 2009–2012. This study took data from the latest wave 3 (2009–2012) and involved separate questionnaires for children under 15 years, and those 15 years and above. There were 7405 participants between the ages of 11 and 25 years with data required for this study. The South African data came from the nationally representative National Income Dynamics Study, a 5-wave longitudinal survey from 2008 to 2017 which aims to provide representative socioeconomic, behavioural and anthropometric data. This longitudinal study originally recruited a sample of over 28 000 individuals.30 We used data from the fifth wave collected in 2017 from participants aged 15–24 years, which comprised 5161 participants between the ages of 15 and 25 years.
Measures of multidimensional poverty
We adapted the Colombian Multidimensional Poverty Index (CMPI) developed by Angulo et al31 and based on Alkire and Santos25 approach, to the three countries under study. The CMPI consists of 15 poverty indicators which capture five dimensions of poverty: household education conditions; individual childhood and youth education conditions; labour; health and access to public utilities; and housing conditions. We did not include measures of childcare due to lack of data. The CMPI was chosen for two reasons: (a) while it is based on the Global MPI, it is adjusted in certain ways which are more relevant for upper-middle-income countries (UMICs), rather than low or lower-middle-income countries, and the collected indicators reflect this; and (b) the volume of missing measures of deprivations in the Global MPI in each country would have made harmonisation impossible, whereas there are substantially fewer missing measures for the31 CMPI across all countries.
Following the previously reported methodology,25 31 the CMPI is based on fourteen different indicators (measured dichotomously and referring to specific poverty-related deprivations of the five broader dimensions: education, childhood conditions, employment, health and access to public services). The specific deprivations are listed in online supplemental table 1. To calculate the CMPI, the 14 specific indicators are added using a nested weighting system, where the five broader dimensions have equal weight. As there are a different number of indicators within each dimension, indicators in different dimensions do not necessarily have the same weights: (a) household education conditions (two indicators), (b) childhood and adolescent conditions (four indicators), (c) labour market participation (two indicators), (d) health (two indicators) and (e) access to public utilities and housing conditions (five indicators). The resulting score is termed the C-weighted sum of deprivations and can take values from 0 to 1, where 0 reflects no deprivation, and 1 reflects deprivation across all indicators. (See online supplemental table 1 for details of dimensions, indicators and weightings for the CMPI.) We used the continuous CMPI scores, and, for sensitivity analysis, we also calculated the ‘deprivation cut-off’, following previous studies25 in which the threshold for multidimensional poverty is if the C-weighted sum of deprivations is equal or larger than the 0.33 threshold.31 We classified individuals living in households with a C-weighted sum of deprivations larger or equal to 0.33 as being in ‘multidimensional poverty’. In other words, this approach classifies households as multidimensionally poor if they are deprived in 33% or more dimensions overall. For multidimensional poverty, we used the continuous measure to avoid comparing large groups of people very close to the threshold. For the individual indicators, we used a dichotomy, distinguishing whether an individual was deprived in a specific dimension or not. We examine the relationship between both the overall multidimensional poverty and each of the dimensions separately. Online supplemental table 1 shows distributions of weighted multidimensional poverty scores of each country.31
Supplemental material
Income measure of poverty
A traditional measure of poverty, income, was also investigated. In South Africa, participants were asked to provide their monthly household income. In Colombia, participants were asked to provide their yearly wage and in Mexico participants were asked for their last 12 months of income. We then converted household income into country-specific quartiles, and classified individuals in the lowest quartile of income in each country as income poor.32 33
Depressive symptoms
The primary outcome is self-reported depressive symptoms (continuous), and the secondary outcome is risk for depression (binary), using locally validated thresholds. These are taken from self-report questionnaires filled out by the young person in each country.
The Colombian survey measured symptoms of depression using the Self-Reporting Questionnaire (SRQ-20;).34 This includes a 13-item questionnaire to detect symptoms of depression. Total scores range from 0 to 20, with higher scores indicating a greater likelihood that the individual is depressed. Scores on the SRQ-20 were then categorised into either low (SRQ-20<4) or elevated (SRQ-20≥4) symptomatology groups. The continuous score is used as a primary outcome, rather than the binary outcome. This screening tool was developed by the WHO and it has been widely used and validated in LMICs; in addition, the SRQ-20 cut-off ≥4 has been previously validated in Colombia.29
The South African dataset used the 10-item Centre for Epidemiologic Studies Depression Scale (CES-D-1035). This is a 4-point Likert questionnaire in which participants answer from 0 to 3 (Rarely, Some of the Time, Occasionally, All the Time) to questions of symptoms, including depressed mood, restless sleep, decreased energy and enjoyment in life, as well as feelings of loneliness and sadness. Scores range from 0 to 30, with greater scores indicating greater depressive symptoms. When validated against the Mini Neuropsychiatric Interview as the gold standard comparison in a representative South African population,36 a cut-off of 12 on the CES-D-10 presented the most balanced sensitivity (71.4%) and specificity (72.6%) for a probable diagnosis of major depression. Symptoms of depression were summed and categorised into either low (CES‐D<12) or elevated (CES‐D≥12) symptomatology groups.
The MxFLS measured emotional well-being using the Clinical Questionnaire for the Diagnosis of Depressive Syndrome (Cuestionario Clinico para el Diagnostico del Sindrome Depresivo (CCDSD)). Across 21 items about emotional well-being, participants were asked ‘in the last four weeks, have you experienced X symptoms’ and asked to respond either ‘No, Sometimes, Many times or All the time’. The answers are worth 1–4 points, respectively, depending on the frequency of the symptoms experienced (from 1 point for No to 4 points for All the time). The total psychometric score is the sum of the individual scores from all questions. As such, the CCDSD scale ranges from 20 to 84, 20 being the minimal level of depressive symptoms, and 84 the maximum level of depressive symptoms. We used previously established cut-off points,37 where a score over 65 reflects clinically significant depression. Though the CCDSD cut-off has not been compared to a gold standard, the measure is shown to be highly reliable, Cronbach α=0.85.37
To facilitate comparisons across measures, we normalised continuous scores for each of the three scales. We scaled depressive symptom scores to values between 0 and 1, using the following formula:

Where zi is normalised scores,  is the individual’s depressive symptom score and
  and
and  are the minimum and maximum depressive symptom scores for the country-specific measure.
Data analysis
Data were analysed using Stata V.16 (Stata Corp) and used calibrated post-stratification sampling weights to adjust for disproportionate representation of sample sizes, relative to the population size of each country. Our results are based on a complete-case analysis of 16 173 participants, whereby participants with missing values on any question on multidimensional poverty were excluded. In total, there were 1538 participants excluded for missing data on multidimensional poverty.
First, we assessed descriptive data of the young people from each country and the harmonised dataset. Due to positive skewness of the normalised depression scores (see histogram in online supplemental figure 1) Poisson regression analyses were used throughout, and coefficients were converted into incidence rate ratios (IRRs). Second, we assessed the association between depressive symptoms and multidimensional poverty in the harmonised dataset, using Poisson regression analyses with normalised, continuous depressive symptoms scores as the dependent variable and multidimensional poverty (continuous) as the independent variable in participants aged 11–25 years. Age, sex and country were entered as potential covariates. Third, in a separate analysis, we also assessed the interaction between multidimensional poverty and sex in the harmonised dataset. We also tested whether there were significant differences across countries by running a Wald test to compare the fit of the model with and without an interaction with the country. We also repeated the Poisson regressions for each individual country.
Forth, we implemented regression models using individual poverty indicators (dichotomous) to assess how different dimensions of poverty relate to depressive symptoms. All indicators were entered simultaneously into one model: education attendance, child labour, school lag, young persons’ lack of health insurance or healthcare and deprivations related to the household (adequate floors, adequate walls, access to sewage clearance, access to water, overcrowding). There was low-moderate collinearity in the model (Variance Inflation Factor (VIF)=1.89) suggesting multicollinearity is not likely to be a problem in the regression model. Finally, we repeated the analysis with income as the measure of poverty to assess the relationship between depressive symptoms and a traditional measure of poverty.
Sensitivity analyses
We performed sensitivity analyses to explore whether including depression as a categorical (yes/no) variable impacted the results by classifying individuals into binary depression risk based on the respective binary cut-offs for each scale, as detailed above. We also explored whether including multidimensional poverty as a categorical (yes/no) variable impacted the results.
We then used Poisson regression to assess how sensitive the outcomes were to different age ranges, by restricting the analyses to adolescence (11–18 years) and young adulthood (19–25 years). In addition, we adapted the CMPI to the South African dataset by excluding indicators that were less appropriate for the South African context, namely access to health insurance and child labour. The question on child labour was only asked to a subset of individuals who reported not attending school, thus the prevalence of child labour was likely underestimated in South Africa. Similarly, while free public healthcare in South Africa is accessible, private healthcare is a marker of privilege for those with higher socioeconomic status. This disparity is not accurately measured by the access to health insurance and services indicator, which is reflected in the high rates of access to health insurance and services reported in the South African survey.
Results
Descriptive statistics including the prevalence of depressive symptoms and proportion deprived in each poverty indicator, across and for each country are summarised in table 1. We note that the prevalence of normalised depressive symptoms is significantly lower in Colombia (0.08) compared with South Africa (0.12) and Mexico (0.20). This is the case also for the non-normalised prevalence distributions defined using country-specific cut-off points, in which prevalence of depression is highest in Mexico (17%), followed by South Africa (10%) and Colombia (9%).
Descriptive findings for participants in individual country datasets and the harmonised data
Based on the mean C-weighted sum of deprivations, 45% were classified as multidimensionally poor (those above the 33% threshold) in the harmonised dataset. Multidimensional poverty was higher in South Africa (46%) and Mexico (52%), compared with Colombia (25%). Kernel Density Plots representing the distribution of the multidimensional poverty C-weighted sum of distributions are presented in online supplemental figures 2–4.
Using income as a measure of poverty, 24% were classified as poor. The overlap between the multidimensional and income poverty is low, 16% of those who classified as multidimensionally poor were also classified as income poor. See online supplemental table 2 for the proportion of those classified as multidimensionally poor from income poor and non-poor groups.
For individual poverty indicators, proportions differed across countries (table 1). While proportions were similar for school lag (being behind at least 1 year relative to the normal curriculum of each country), school attendance and adult literacy, less participants reported child labour in South Africa (1%) compared with Mexico (14%) and Colombia (6%). Rates of long-term unemployment of the caregiver in the household were higher in South Africa, while less adults were deprived in formal unemployment in Colombia. Rates of deprivations in housing were also lower in Colombia (31%), compared with South Africa (51%) and Mexico (46%), whereas deprivations in household long-term unemployment, formal employment and health insurance were lower in Mexico. The overall lower prevalence rates in Colombia may be explained by these lower rates of unemployment and housing and access to healthcare.
Relationship between poverty and depressive symptoms
In multivariate regression models, there was evidence for a positive and significant association between multidimensional poverty and the severity of depressive symptoms (IRR=1.24, 95% CI 1.10 to 1.42; table 2). Individuals who lived in a household classified as multidimensionally poor had a significantly 25% higher rate ratio of depressive symptoms compared with those not poor. When a sex interaction was included, the association between multidimensional poverty and depression did not differ for females (IRR=1.11, 95% CI 0.87 to 1.41; online supplemental table 3).
Poisson regression of multidimensional poverty (dichotomous) on depressive symptoms of participants aged 11–25 years from the harmonised dataset, as well as individual datasets from Mexico, South Africa and Colombia
In regression analyses using household income as the poverty measure, there was no relationship between income and depressive symptoms in the harmonised dataset (see table 3; IRR=1.02, 95% CI 0.96 to 1.08). There was a significant association, in which individuals in the lowest income group had significantly higher depressive symptoms than those in the higher income group, in South Africa (IRR=1.12, 95% CI 1.06 to 1.18), but not Colombia (IRR=1.20, 95% CI 0.92 to 1.56) or Mexico (IRR=0.97, 95% CI 0.90 1.04).
Poisson regression of household income on depressive symptoms of participants aged 11–25 years from the harmonised dataset, as well as individual datasets from Mexico, South Africa and Colombia
Differences by country
In country-specific models, there was no significant association between multidimensional poverty and depressive symptoms in South Africa (IRR=0.94, 95% CI 0.83 to 1.07; table 2). However, there was a positive and statistically significant relationship between multidimensional poverty and depressive symptoms in Mexico (IRR=1.35, 95% CI 1.11 to 1.64) and Colombia (IRR=2.01, 95% CI 1.30 to 3.10). We ran a Wald test to compare the fit of the model with and without the interaction with country and showed whether the association between MPI and depressive symptoms differed by country. We then explored these interactions using Poisson regression (see online supplemental table 3), which shows that the relationship between poverty and depressive symptoms is inverted for South Africa compared with Mexico (IRR=0.67, 95% CI 0.53 to 0.85), and a slightly weaker association in Colombia (IRR=1.46 0.36, 95% CI 0.90 to 1.34), which suggests no difference in the relationship between poverty and depressive symptoms between Mexico and Colombia.
In sensitivity analysis, we used logistic regression to assess the relationship between multidimensional poverty and a binary depression measure, based on individual country cut-offs. The positive relationship between multidimensional poverty and binary depression remained significant (OR=1.75, 95% CI 1.24 to 2.48; see online supplemental table 4), and the same country specific trends hold, that is, there was a positive relationship for Colombia and Mexico, but not South Africa. Findings also remain the same when a dichotomous multidimensional poverty measure is used (online supplemental table 5). There was a positive relationship between multidimensional poverty and depressive symptoms in both adolescents (11–18 years; IRR=1.36, 95% CI 1.12 to 1.67) and young adults (19–25 years; IRR=1.21, 95% CI 1.04 to 1.41; see online supplemental table 5). In further sensitivity analyses, we adapted the MPI to the South African dataset by excluding dimensions that were not appropriately measured for the South African dataset: access to health insurance and child labour. The relationship between depressive symptoms and multidimensional poverty remained significant in the harmonised dataset (IRR=1.30, 95% CI 1.14 to 1.47). In South Africa, the relationship became significant (IRR=1.15, 95% CI 1.01 to 1.30), when less relevant poverty indicators were removed the association became significant.
Specific dimensions of poverty and depressive symptoms
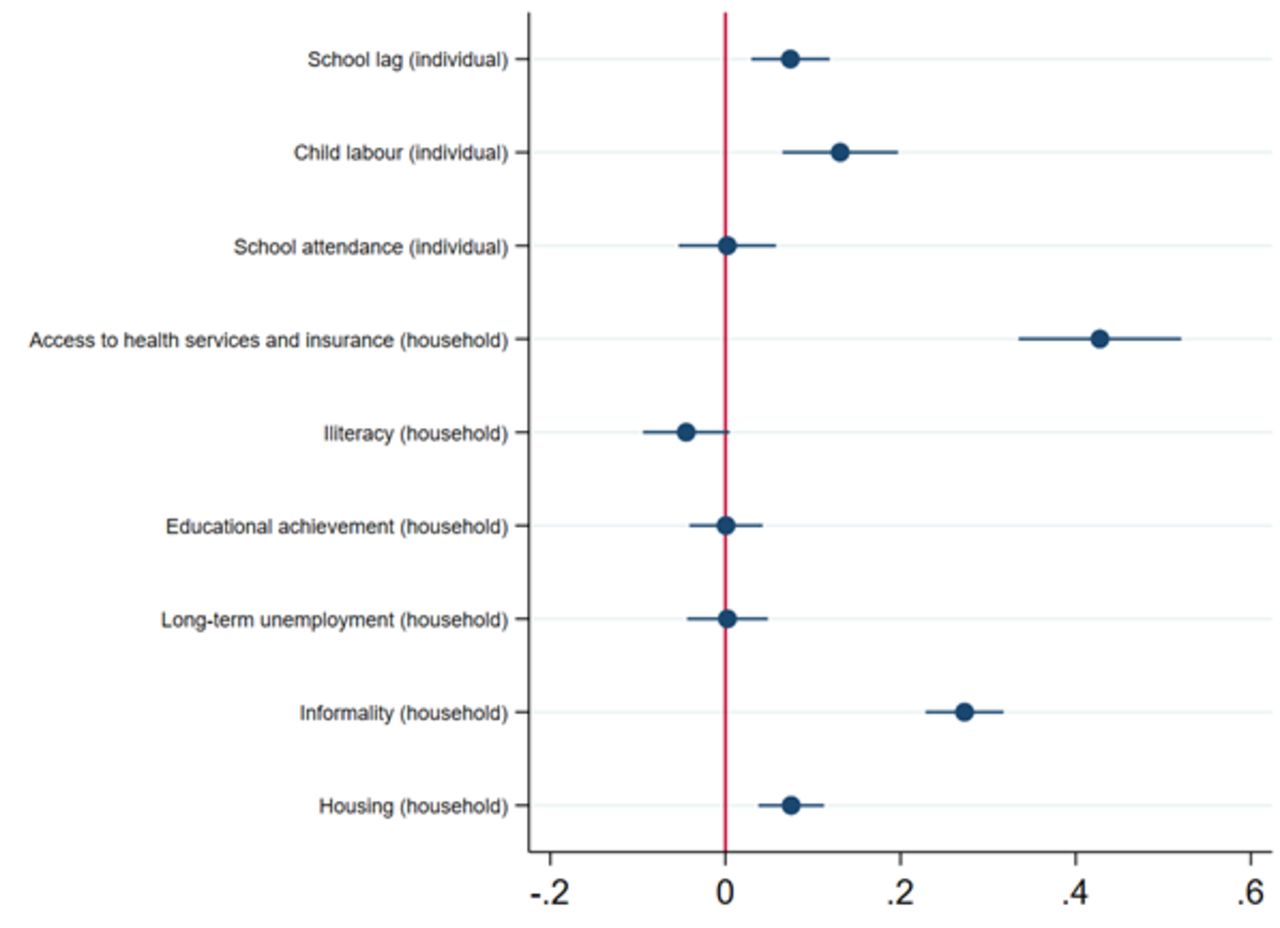
Results from the Poisson regression model of separate multidimensional poverty indicators on depressive symptoms are displayed in table 4. See figure 1 for a visual depiction of the model. The first set of indicators of poverty captured dimensions at the individual level. In the harmonised dataset, child labour and school lag had positive associations with depressive symptoms (child labour: IRR=1.17, 95% CI 1.10 to 1.25; school lag: IRR=1.08, 95% CI 1.03 to 1.13), the higher rates of child labour and school lag, the higher the severity of depressive symptoms. There was no association between depressive symptoms and school attendance (IRR=0.98, 95% CI 0.93 to 1.04). These associations with school lag were found in Mexico (IRR=1.10, 95% CI 1.02 to 1.18) and Colombia (IRR=1.13, 95% CI 1.07 to 1.41), but not South Africa (IRR=0.10, 95% CI 0.95 to 1.04), while associations with child labour were only found in Mexico (IRR=1.16, 95% CI 1.08 1.25).
Plot of incidence rate ratios from Poisson regressions of separate multidimensional poverty indicators on depressive symptoms of participants aged 11–25 years from the harmonised dataset.
Poisson regressions of separate multidimensional poverty indicators on depressive symptoms of participants aged 11–25 years from harmonised dataset and individual countries
In terms of access to health insurance and services, we observed a positive association; those deprived in access to health insurance and services had higher depressive symptom scores (IRR=1.12, 95% CI 1.07 to 1.28). These associations were found in Mexico (IRR=0.74, 95% CI 0.61 to 0.91) and Colombia (IRR=1.37, 95% CI 1.20 to 1.55), but not South Africa (IRR=1.18, 95% CI 0.99 to 1.39).
In terms of the deprivations measured at the household level, our results showed that living in a household where other adult members were deprived in literacy was associated with lower depressive symptoms in the harmonised dataset (IRR=0.95, 95% CI 0.90 to 0.99), suggesting a protective effect on depressive symptoms. There was no association for household educational achievement (IRR=1.02, 95% CI 0.98 to 1.07), nor whether at least one adult had a long-term unemployment episode (IRR=0.97, 95% CI 0.93 to 1.02). Those in which at least one of its adult members worked in the informal economy had significantly higher depressive symptom scores (IRR=1.08, 95% CI 1.02 to 1.15). In Mexico, there were no associations between deprivations measured at the household level and depression, while in Colombia long-term household unemployment was associated with higher depressive symptoms (IRR=1.25, 95% CI 1.03 to 1.52). In South Africa the association was in the opposite direction: long-term unemployment was associated with lower depressive symptoms (IRR=0.95, 95% CI 0.91 to 0.99), while informality was associated with higher depressive symptoms (IRR=1.29, 95% CI 1.19 to 1.39). Those who lived in deprived housing conditions had higher depressive symptom scores (IRR=1.06, 95% CI 1.02 to 1.10) in the harmonised dataset. This relationship was significant for Mexico (IRR=1.08, 95% CI 1.19 to 1.39), but not for Colombia (IRR=0.99, 95% CI 0.86 to 1.11) or South Africa (IRR=1.04, 95% CI 0.99 to 1.07).
Discussion
This is the first cross-country examination of the relationship between depressive symptoms and multidimensional poverty among youth (11–25 years old) in South Africa, Colombia and Mexico. Our findings illustrate the importance of country context in the relationship between multidimensional poverty and youth depressive symptoms. While a positive association was observed between depression and multidimensional poverty in Colombia and Mexico, an association was not observed for South Africa, likely due to the lack of an association for child labour and health insurance in this country. However, one dimension of poverty, formal employment by another household member, did show an association with depressive symptoms, as well as household income, suggesting that household income may be more protective against depressive symptoms among youth in this country.
The relationship between multidimensional poverty and youth depressive symptoms is not the same in all countries, and our findings demonstrate that certain dimensions may be more salient for mental health in different countries. In Mexico and Colombia, as well as the harmonised dataset, depressive symptoms seem to be associated with individual deprivations affecting the adolescent directly (such as child labour, school lag and access to health insurance), then with deprivations operating at the household level (such as living in a household where other adult members are illiterate, have lower levels of education or have had a long-term unemployment episode). These deprivations may prevent young people from investing in their education, taking them further away from their future aspirations and expectations, which may lead to poorer mental health, independently of the education or employment of their parents. Consistent with this view, evidence from Colombia suggests that education is one of the most important factors contributing to future aspirations in youth.38 39 Future research should explore the causal nature of this association, to understand both how depressive symptoms influence educational attainment, as well as how educational attainment in turns influences future depressive symptoms. Our findings suggest that there is less of an association between depressive symptoms and household level deprivations. However, our findings are consistent with an increasing body of literature suggesting that household level deprivations have important limitations; for example, they are ‘gender-blind’ as they do not consider intra-household differences by gender in resource allocation.40 Age and status within the household are also important dimensions that may impact the distribution of resources within the household. Measuring poverty at the household level may thus lead to misclassification of poor individuals as non-poor, or overlook inequalities between individuals within a household.40 This may be particularly important when measuring poverty among young people, given potential differences between boys and girls, as well as differences in the distribution of resources between young people and older adults in the household.
However, an opposite pattern was observed in South Africa, where only one deprivation associated with adult household members, namely deprivation in formal employment, was associated with depressive symptoms, but not individual level deprivations. The relationship between multidimensional poverty and youth depressive symptoms is not the same in all countries, as the importance of specific dimensions for mental health varies across countries. In Mexico and Colombia, depressive symptoms are associated with more individual deprivations than in South Africa, where household deprivations show more associations with depressive symptoms. The disparity in findings across countries may reflect the high levels of unemployment and lower levels of earnings in South Africa24 relative to the other countries. In 2019, unemployment levels in South Africa hit an all-time high of 29.1%, and an even higher proportion of 33% among young people, numbers that are likely to have risen further since the COVID-19 pandemic in 2020.41 The psychological consequences of unemployment on self-esteem, psychological distress and depression in South Africa are well documented.42 43 It is also important to note that each country has different policies in place related to poverty which may confound the results. For example, the countries have government cash transfer programmes that provide household grants to low-income households, that have been shown to impact youth mental health, but these cash transfers differ in their volume, conditionality and targeting.28 Further research should assess poverty-reduction policies that might explain cross-country differences in the relationship between multidimensional poverty and mental health.
Given high unemployment rates, young people in South Africa may have reduced aspirations for the future, hence being deprived in education may have less of an impact on future aspirations and mental health. By contrast, in Colombia and Mexico, where youth unemployment rates are high by international standards but not to the levels of South Africa, poor education may be perceived as a limiting factor in achieving aspirations for the future, which in turn may increase depressive symptoms. Overall, it would seem as if patterns of associations were more aligned in Mexico and Colombia, potentially reflecting to some extent a shared Latin American cultural, social and economic heritage that shapes young people’s experiences of poverty and mental health. Interestingly, when we defined poverty based on income, individuals in the high-income group did have significantly lower depressive symptoms in South Africa, but not Colombia or Mexico. Clearly, not all deprivations are equally important for depressive symptoms in youth across different countries. These findings suggest that socioeconomic and country-context must be taken into account in understanding the relationships between poverty and depressive symptoms in young people. Our findings should be followed by more detailed prospective, longitudinal studies to determine the mechanisms by which different poverty indicators are causally related to youth depression in varied countries.
Our results also support the case for using a multidimensional approach, especially when considering the lack of association with depressive symptoms and income poverty. A significant proportion of people earning the highest income were still classified as multidimensionally poor, while the overlap between the multidimensional and income poverty was low, demonstrating that both variables are measuring very different aspects of poverty and this may have a bearing on mental health. Some individuals not classified as income poor in our data were deprived in dimensions of poverty that are associated with mental health, for example, 87% of those deprived in schooling lag were not classified as income poor. Furthermore, there was no relationship between income and depressive symptoms in the harmonised dataset. This demonstrates further that relationships between specific dimensions of poverty differ depending on country. Indeed, the relationship between income and depressive symptoms has previously shown to be inconsistent.3 9 While household income may not always be associated with depressive symptoms, deprivations in other areas may impact their mental health. This showcases the importance of using a multidimensional approach and moving away from the more traditional measures of poverty.
For instance, deprivation in school attendance was not associated with depressive symptoms in the harmonised dataset or in any of the individual countries, whereas school lag deprivation was, suggesting two different mechanisms. A potential explanation is that depressive symptoms influence the ability to concentrate and perform well at school leading to school lag. In addition, poor academic performance may lead to long-term negative impacts on self-esteem and increase the risk of depressive symptoms.44 School attendance deprivation, on the other hand, may be influenced by a wide variety of reasons which are not necessarily related to mental health, such as geographical location, or the availability of schools in the area of residence.
Overall, our findings highlight the fact that relationships between poverty and depressive symptoms in young people differ by dimensions of poverty and country. Thus, future studies should go beyond monetary dimensions of poverty and examine how specific deprivations relate to depressive symptoms in young people.
These findings are particularly pertinent in the current context of the COVID-19 pandemic. Research suggests that the COVID-19 crisis has increased global poverty levels45 and impacted youth mental health, particularly depression and anxiety.46 The impact of the pandemic may differ across countries depending on the severity of the pandemic, governmental support and countries healthcare systems. Further research should seek to understand how COVID-19 has impacted multidimensional poverty, how this has affected youth mental health and how these effects differ across different countries.
Strengths and limitations
This is the first cross-country examination of the relationship between depressive symptoms and multidimensional poverty among young people in three UMICs. However, several limitations should be considered. A more comprehensive cross-country analysis with many more countries is required to understand how this relationship varies in more diverse contexts across Africa, South-East Asia, the Eastern Mediterranean region, Western Pacific, the Americas and the European region. While there is value in a cross-sectional analysis, this approach did not enable us to examine the complex dynamics of poverty and mental health in the same way that it would be possible in a longitudinal study. In addition, some of the poverty measures we employed may not capture the nuances of each country. For example, our measures in South Africa may not have captured the impact of very high rates of deprivation in access to health services and child labour. On the other hand, in sensitivity analyses that used an adapted version of the MPI that excluded these dimensions, the relationship with multidimensional poverty and depressive symptoms became significant, suggesting that these current measures in the MPI may not be valid for South Africa.
In addition, it is possible that by including all indicators in the same model, we are blocking potential mediating factors should, for example, individual dimensions be mediators of the association between household dimensions of poverty and depressive symptoms. Nevertheless, results were very similar when separate models were constructed for each group of indicators (results available on request).
While it was not possible to look at the relationship with multidimensional poverty and other dimensions of mental health in the current data, we suggest that future research should explore whether different dimensions of mental health, to assess whether poverty relates to depression in a way that is different from how it would relate to anxiety or to schizophrenia.
There are also limitations associated with the comparability of our measure of multidimensional poverty across countries. There was a negative skew of the C-weighted sum of deprivations in South Africa, where distributions were clustered more towards the higher multidimensional poverty, compared with Colombia and Mexico, where there was a more even distribution. Indeed, we find that the distribution of the MPI was significantly different in South Africa relative to Colombia (two-sample Kolmogorov-Smirnov test=0.37 p<0.001) and Mexico (two-sample Kolmogorov-Smirnov test=0.12 p<0.001). Visual exploration of kernel plots suggest that this might be due to a more compressed and right-skew in the distribution of the MPI in South Africa relative to Colombia and Mexico. It is also important to note that the MPI was adapted for Colombia. This may explain why we did not observe significant associations between some poverty dimensions and depressive symptoms in South Africa. However, even if not fully valid for South Africa and Mexico, the CMPI was still likely to be a more valid measure of multidimensional poverty than the Global MPI in the context of UMICs.
In addition, the timing of the surveys differed between countries and changes during that time in the prevalence of poverty or mental health across countries may have impacted the results. Over the period of study, data from the World Bank suggests that the multidimensional poverty headcount ratio (% of total population) changed little for Mexico—from 46% in 2010 to 43.4% in 2016—and South Africa—from 8% in 2011 to 7% in 2016. By contrast, in Colombia, there was a decline in the multidimensional poverty headcount ratio, which went from 30.4% in 2010 to 17.8% in 2016. It is possible that the relationship between poverty and depressive symptoms for Colombia may have been different in the period covered by South Africa. As the group of individuals defined as poor becomes smaller and more selective, it is increasingly comprised individuals who are disproportionately disadvantaged.47 As a result, there may have been associations for Colombia but not South Africa as those in poverty were a more selective group than in 2010, where a larger fraction of the population was classified as poor. However, these changes do not necessarily imply a change in the relationship between multidimensional poverty and mental health and are unlikely to fully explain the cross-national variations we observed in this relationship.
Conclusion
In sum, the relationship between poverty and depressive symptoms among young people differs across dimensions of poverty and between countries. We found a significant relationship between multidimensional poverty and depressive symptoms in Colombia and Mexico but not in South Africa, despite the fact that some dimensions of poverty did show an association with depressive symptoms in the latter. There were key differences across countries in how individual deprivations were related to youth depressive symptoms. Not all deprivations are equally important for depressive symptoms in youth across different countries
While household income was only associated with lower depressive symptoms at the highest income group, those with a high income were deprived in other areas which were associated with their mental health. This showcases the importance of using a multidimensional approach and moving away from the more traditional measures of poverty. There were associations with individual deprivations, such as education, and not household deprivations, such as parental unemployment.
Our results have important implications for policy as they highlight potential targets for interventions on deprivations directly linked to young people may be more effective in improving their mental well-being than interventions targeting dimensions of poverty which are not clearly associated with mental health. This includes interventions to tackle school lag, child labour and access to health services. Our results also suggest that the importance of different deprivations might differ across countries. Further longitudinal analysis and intervention using a nuanced approach that considers the specific poverty dimensions relevant for each country is critical to improve the mental health of young people in UMICs.
Data availability statement
Data are available upon reasonable request.
Ethics statements
Patient consent for publication
Ethics approval
This study was approved by King’s College London (approval number: LRS-19/20-15050).
Acknowledgments
The support of the Economic and Social Research Council (ESRC) is gratefully acknowledged.
References
Supplementary materials
Supplementary Data
This web only file has been produced by the BMJ Publishing Group from an electronic file supplied by the author(s) and has not been edited for content.
Footnotes
Handling editor Sanni Yaya
Contributors AZ designed the study, conducted the analysis and prepared the manuscript. MA-P, CL and RA supervised the design, analysis and write-up. EG, SE-L and PH helped design the study and all authors read and commented on the manuscript. AZ, MA-P, CL and RA are responsible for the overall content as the guarantors and accept full responsibility for the work and/or the conduct of the study, have access to the data, and controlled the decision to publish.
Funding This study is an output of the CHANCES-6 study. This work was supported by the UKRI’s Global Challenges Research Fund (ES/S001050/1). Mauricio Avendano is additionally supported by the ESRC Centre for Society and Mental Health at King’s College London (ESRC Reference: ES/S012567/1).
Competing interests None declared.
Provenance and peer review Not commissioned; externally peer reviewed.
Supplemental material This content has been supplied by the author(s). It has not been vetted by BMJ Publishing Group Limited (BMJ) and may not have been peer-reviewed. Any opinions or recommendations discussed are solely those of the author(s) and are not endorsed by BMJ. BMJ disclaims all liability and responsibility arising from any reliance placed on the content. Where the content includes any translated material, BMJ does not warrant the accuracy and reliability of the translations (including but not limited to local regulations, clinical guidelines, terminology, drug names and drug dosages), and is not responsible for any error and/or omissions arising from translation and adaptation or otherwise.