Article Text

Abstract
Background To reach global immunisation goals, national programmes need to balance routine immunisation at health facilities with vaccination campaigns and other outreach activities (eg, vaccination weeks), which boost coverage at particular times and help reduce geographical inequalities. However, where routine immunisation is weak, an over-reliance on vaccination campaigns may lead to heterogeneous coverage. Here, we assessed the impact of a health system strengthening (HSS) intervention on the relative contribution of routine immunisation and outreach activities to reach immunisation goals in rural Madagascar.
Methods We obtained data from health centres in Ifanadiana district on the monthly number of recommended vaccines (BCG, measles, diphtheria, tetanus and pertussis (DTP) and polio) delivered to children, during 2014–2018. We also analysed data from a district-representative cohort carried out every 2 years in over 1500 households in 2014–2018. We compared changes inside and outside the HSS catchment in the delivery of recommended vaccines, population-level vaccination coverage, geographical and economic inequalities in coverage, and timeliness of vaccination. The impact of HSS was quantified via mixed-effects logistic regressions.
Results The HSS intervention was associated with a significant increase in immunisation rates (OR between 1.22 for measles and 1.49 for DTP), which diminished over time. Outreach activities were associated with a doubling in immunisation rates, but their effect was smaller in the HSS catchment. Analysis of cohort data revealed that HSS was associated with higher vaccination coverage (OR between 1.18 per year of HSS for measles and 1.43 for BCG), a reduction in economic inequality, and a higher proportion of timely vaccinations. Yet, the lower contribution of outreach activities in the HSS catchment was associated with persistent inequalities in geographical coverage, which prevented achieving international coverage targets.
Conclusion Investment in stronger primary care systems can improve vaccination coverage, reduce inequalities and improve the timeliness of vaccination via increases in routine immunisations.
- health systems
- immunisation
- vaccines
Data availability statement
Data used in this study are available from the corresponding author on request.
This is an open access article distributed in accordance with the Creative Commons Attribution Non Commercial (CC BY-NC 4.0) license, which permits others to distribute, remix, adapt, build upon this work non-commercially, and license their derivative works on different terms, provided the original work is properly cited, appropriate credit is given, any changes made indicated, and the use is non-commercial. See: http://creativecommons.org/licenses/by-nc/4.0/.
Statistics from Altmetric.com
Key questions
What is already known?
Reaching the minimum recommended vaccination coverage of 90% for childhood illnesses remains a substantial challenge for low-income and middle-income countries (LMICs).
Understanding how vaccine delivery strategies can be improved to achieve coverage targets in rural areas of LMICs is essential due to the fragility of health systems and associated health budgets.
While evidence exists on the impact of outreach activities and other targeted interventions aimed at improving immunisation coverage, it is unclear how strengthening local health systems can help improve key indicators of vaccination coverage, via its different impacts on routine and outreach immunisations.
What are the new findings?
A health systems strengthening (HSS) intervention in a rural district of Madagascar improved overall vaccination coverage, reduced economic inequalities in vaccination coverage and increased the proportion of timely vaccinations via an increase in routine immunisations.
The contribution of outreach activities was lower in the HSS catchment area than in the rest of the district, which was associated with a persistence of geographical inequalities in vaccination coverage.
What do the new findings imply?
Strengthening local health systems can help improve key indicators of vaccination coverage in rural, low resource settings, even when those interventions do not target specifically vaccine improvements themselves.
Explicit efforts are still necessary in areas undergoing HSS to vaccinate children in remote areas so that immunisation goals can be reached.
Introduction
Vaccination is one of the most effective public health interventions to reduce the burden of infectious diseases, particularly among children.1 2 To increase vaccination coverage around the world, the Global Alliance for Vaccines and Immunisation (GAVI) was created in 2000 to mobilise funds and technical expertise for child vaccination in the poorest countries in the world.3 4 As a result, from 2000 to 2015, global vaccination coverage has increased from 72% to 86%.5 As of 2018, 760 million children have been immunised and an estimated 13 million deaths have been prevented in GAVI-supported countries.6 Future impacts of immunisations are estimated to be larger with the introduction of new vaccines (eg, rotavirus, papillomavirus) and the expansion of coverage for existing vaccines.7 8 Based on the Global Immunisation Vision and Strategy, the goal of the Global Vaccine Action Plan was to reach a national coverage of 90% for basic vaccines in all countries in 2020,8 9 with at least 80% coverage in every district.10 Despite great progress, vaccination coverage remains low in many areas of the developing world due to many reasons.11 For instance, while average coverage for third dose of the diphtheria, tetanus and pertussis (DTP) vaccine increased from 60% to 81% between 1999 and 2018 in low-income and middle-income countries (LMICs), it remained under 40% for the bottom ten performing countries.5 Failure to achieve critical population-level thresholds for herd immunity has resulted in sustained transmission, periodic epidemics and has slowed-down progress towards the elimination of vaccine preventable diseases such as polio, measles and rubella.12–14 Beyond 2020, the new objective of the GAVI strategy is to reduce the number of ‘zero-dose’ children by 25% in 2025 and by 50% in 2030.15
National strategies for vaccination in most LMICs typically involve routine immunisation (RI) at primary health centres, complemented with additional outreach activities to increase coverage such as periodic vaccination weeks (VW) and supplementary immunisation activities (SIAs) such as mass vaccination campaigns. RI, where a child is brought to a health facility to receive the recommended shots, usually free of charge, represents the most reliable way of vaccinating children at the right time in order to maximise immunity.16 However, its reach is undermined by the fragility of health systems in LMICs and multiple barriers faced by local populations for accessing healthcare.17 In particular, geographical distance to primary health centres is associated with important inequalities in vaccination coverage.18 Vaccination campaigns, which involve the mobilisation of health workers to administer vaccines where populations live during VW and SIAs, are a very effective way to cover large geographical areas over short periods of time and to reduce geographical inequalities in vaccination coverage.19 20 Consequently, significant funding has been mobilised towards increasing coverage via vaccination campaigns,20 21 but the low frequency of these campaigns can result in heterogeneous coverage across age groups,18 22 insufficient number of recommended doses per vaccine23 and important delays in immunisation relative to the recommended age of vaccination.24–27 In addition, vaccination campaigns can have negative impacts on subsequent rates of immunisation via RI,13 28 which could exacerbate these issues. To address this, investments in vaccination campaigns could be accompanied with broader health system strengthening (HSS) efforts to increase the contribution of RI to overall immunisation coverage.28 29
Madagascar is illustrative of the challenges and potential solutions to achieving global goals for immunisation in LMICs. Since its launch in 1976, the national Expanded Programme on Immunisation (EPI) has contributed to a substantial uptake in immunisation30 31 which seems to have been an important driver in improvements in life expectancy.32 In addition to supporting RI activities, the EPI launched biannual VWs in 2006 (‘mother and child weeks’, which generally take place in April and November),33–35 and conducts occasional SIAs to further increase coverage and prevent disease outbreaks.13 36 As of 2018, vaccination coverage goals for Madagascar had not yet been achieved for any of the recommended vaccines.37 Suboptimal vaccination coverage can lead to larger-than-usual outbreaks (known in epidemiology as ‘posthoneymoon’ epidemics)13 . For instance, insufficient coverage for measles vaccine (~80% by 2017)38 led to the largest known measles outbreak in Madagascar history in 2018–2019,39 which accounted for one fourth of global cases40 that year with nearly 225 000 cases registered.41 Achieving vaccination coverage targets is particularly challenging in rural areas of the country, where the majority of the population lives, and where coverage is over 10% lower than in urban areas37 for all recommended vaccines.
In 2014, the Ministry of Public Health (MoPH) partnered with the nongovernmental healthcare organisation PIVOT to strengthen the rural health district of Ifanadiana, located in southeastern Madagascar, to improve local health conditions and serve as a model health system for the country.42 Though the partnership does not include a particular focus on immunisation (which is managed directly by the MoPH), it supports a large range of interventions at health centres and community health sites in approximately one-third of the district, which has resulted in substantial increases in primary healthcare access and utilisation.43 Those programmes include improved ‘readiness’ of health facilities (staffing, training, equipment, infrastructure, supply chain) and clinical programmes that can directly influence adherence to vaccinations schedules, such as family planning, antenatal care, postnatal care and deliveries at health facilities.
The goal of this study was to assess the impact of HSS on the relative contribution of RI and vaccination campaigns over time, and the impact of these changes on key features of immunisation at the population-level. In particular, we assessed changes between 2014 and 2018 in the HSS catchment and in the rest of the district in (1) the delivery of recommended vaccines, (2) population-level vaccination coverage, (3) geographical and economic inequalities in coverage and (4) timeliness of vaccination. For this, we combined immunisation data from all health centres in Ifanadiana district with information from a district-representative longitudinal cohort conducted every 2 years in nearly 1600 households in the district (~8000 individuals).
METHODS
Study site
Ifanadiana is a rural district in the region of Vatovavy Fitovinany, located in southeastern Madagascar. It comprises about 200 000 people distributed in 13 communes, with 2 additional communes created during the study period. The district’s health system consists of one hospital (CHRD) and at least one health centre (CSB2) per commune that provides primary healthcare. Six communes have additional health centres (CSB1) with more limited health services. The initial HSS catchment comprised 4 out of the 13 communes in the first 3 years (2014–2016). One additional commune was added in 2017 to the HSS catchment, with plans to progressively cover the entire district over the following years.44 The HSS intervention spans across all levels of care (hospital, health centres and community health) and combines horizontal support to health system readiness (eg, infrastructure, staffing, equipment, removal of user fees, social support to patients) with vertical support to clinical programmes (eg, malnutrition, emergency care, tuberculosis) and improved information systems.44 45 More details are available in online supplemental table S1.46 Delivery of child immunisation is similar to the rest of Madagascar, combining RI with biannual VWs and other outreach activities. Only one SIA took place during the study period in Ifanadiana, a measles mass vaccination campaign in October 2016.
Supplemental material
Data collection
Health system data collection
Data on monthly immunisation rates from 2014 to 2018 were obtained from all 19 primary health centres in Ifanadiana district. Two health centres that were recently built and lacked consistent data across the study period were excluded. Data were obtained on all recommended vaccines in the Madagascar EPI, which included tuberculosis (BCG), measles, polio and the combined vaccine for DTP. For polio and DTP, only the number of third doses administered was considered, which indicates completion of all the required doses for these two vaccines. Immunisation information was derived from the health centres’ monthly reports to the district, which are aggregated from the health centres’ registers every month by MoPH staff. From these, the number of children immunised per month for each of these vaccines was obtained for each health centre (CSB1 or CSB2), which included all children vaccinated through both routine services and outreach activities. The population of children aged 12–23 months was also obtained for each health centre catchment from official MoPH records.47 Data quality were monitored by joint PIVOT-MoPH supervisions every 3 months. During each supervision, data from the health centre paper registries, containing each individual visit, were used to calculate a number of indicators (though the number of immunisations was not among them); values for each indicator were then compared with those reported in the monthly report to the district.48 Information on the geographical extent and timing of the HSS intervention was obtained from the NGO’s internal records.
Cohort data collection
We obtained population-level information from the Ifanadiana Health Outcomes and Prosperity longitudinal Evaluation (IHOPE), a district-representative longitudinal cohort study initiated in Ifanadiana district in 2014.49 It consists of a series of surveys conducted in a sample of 1600 households every 2 years, with questionnaires modelled after the internationally validated Demographic and Health Surveys (DHS).50 A two-stage sample stratified the district by the initial HSS and control catchments. Eighty clusters, half from each stratum, were selected at random from enumeration areas mapped during the 2009 census, and households were then mapped within each cluster. Twenty households were selected at random from each cluster. A total of 1522 households were successfully interviewed in 2014 (95.1% acceptance rate), 1514 and 1512 households were revisited during the follow-up in 2016 (94.6% acceptance rate) and in 2018 (94.5% acceptance rate), respectively. Data collection, survey coordination and training were conducted by the Madagascar National Institute of Statistics.
The survey included a household questionnaire and individual questionnaires for all men and women of reproductive age (15–59 years and 15–49 years, respectively). All eligible women and men who were in the households sampled (usual residents or visitors) were interviewed. Data collected through the questionnaires included general information about household composition (size, genders, ages); living conditions, education, and other indicators of socioeconomic status; recent illness, care seeking for illness and preventive behaviours; women’s reproductive history and care seeking behaviour for reproductive health; children’s health, development, preventive behaviours and care seeking for illness; and child, adult and maternal mortality. For vaccination specifically, information about vaccination status of the children under 5 years was obtained from the individual interviews with their mothers. Vaccination status and history was assessed from the children’s vaccination cards when available, or from the mother’s report otherwise.
Use of aggregated HMIS data was authorised by the Ministry of Public Health’s Medical Inspector in Ifanadiana district.
Patient and public involvement
Patients or the public were not involved in the design, conduct, reporting or dissemination plans of our research.
Data analysis
Analysis of immunisation rates at health centres
We studied the effect of the VWs and the HSS intervention on monthly immunisation rates at health centres over the study period. For this, we first estimated monthly per capita rates (age-specific) at each health centre for each vaccine (BCG, polio third dose, DTP third dose and measles). Per capita immunisation rates were modelled separately for each vaccine via binomial regressions in generalised linear mixed models, including a random intercept for each health centre. All explanatory variables (see below) were included as fixed effects. To study the effect of VWs and of the HSS intervention on immunisation rates, we built dummy variables coded as 1 for the CSBs and months where each programme was in place (discrete for months with VWs, and constant from the moment the HSS started until the end of the study period). We also studied the interaction of the HSS intervention with a linear annual change and VWs, in order to account for the additional effect of the HSS intervention over time, and for changes in the contribution of VWs to overall immunisation rates due to the HSS intervention, respectively. We controlled our analyses for baseline differences in health system factors and time-varying factors, which is akin to a difference-in-differences analysis. For health system factors, we controlled for baseline differences between health centres in the initial HSS catchment and in the rest of the district, as well as between different types of health centre (CSB1 and CSB2). For time-varying factors, we controlled for annual linear and seasonal changes in immunisation rates in the district. Seasonal changes were studied using a sine function with a period of 1 year and the horizontal shift that best fitted the data. We excluded from the analysis the measles immunisations delivered via SIAs in October 2016 because the target age was children up to 5 years of age, which differed from the population group used in the analyses (12–23 months).
Univariate analyses were first performed for each explanatory variable and those with p<0.1 were retained for multivariate analysis. From this full model, a reduced model that included only variables reaching statistical significance (p<0.05) was obtained via backwards selection. Effects are reported as adjusted ORs.
Analysis of vaccination coverage in the longitudinal cohort
While an analysis of health centre immunisations can provide some basic understanding about the impact of the HSS intervention on RI and outreach activities over time, it does not allow for obtaining accurate measures of vaccination coverage due to known inaccuracies in target population estimates, which are often based on extrapolation of data from censuses conducted very far apart in time.51–53 In addition, aggregated information reported by the health system does not allow us to evaluate changes in economic or geographical inequalities in vaccination coverage, or for the assessment of the timeliness of vaccination, all of which can be affected by the relative contribution of RI and outreach activities in the area. For this, we conducted a complementary analysis of vaccination coverage at the population-level using data from the IHOPE cohort.
Vaccination coverage was estimated for 2014, 2016 and 2018 from individual level data for children 12–23 months or 12–59 months (depending on the analysis, see below), as the proportion of the target group immunised at the time of the interview. Similar to our analysis of health centre immunisation rates, we studied separately each of the recommended vaccines, namely BCG, polio third dose, DTP third dose and measles. We also estimated whether the child had received all of these recommended vaccines. For each child surveyed, vaccination status for each vaccine was coded 1 if the child was vaccinated based either on the vaccination cards, or on the mother’s report, and 0 otherwise. To assess the impact of economic and geographical inequalities in vaccination coverage, we estimated a household wealth score via principal components analysis of household assets following standard DHS methods,50 and we estimated the shortest path distance from the villages in each cohort cluster to the nearest health centre using the Open Source Routing Machine engine. For this, we had previously mapped the entire district of Ifanadiana on OpenStreetMap, resulting in over 23 000 km of footpaths and 5000 residential areas mapped.54 Households were ordered based on their wealth score and distance to the nearest health centre and were classified into five quantiles with 20% of observations in each category (Q5=wealthiest or closest to the health centre; Q1=poorest or most remote). Vaccination coverage in children 12–23 months was estimated inside and outside of the HSS catchment at the beginning and at the end of the study period (2014–2018), disaggregated by wealth quantile and by distance quantile. Consistent with previous studies, changes in inequalities were measured as the gap in vaccination coverage between the worst-off quantiles (Q1–Q2) and the best-off quantiles (Q3–Q5) over time.43 55 56
We then modelled changes in vaccination coverage over the study period, studying baseline differences and annual changes in overall coverage and in economic and geographical inequalities for the HSS catchment and the rest of the district. For this, we performed a separate logistic regression mixed model for each vaccine, with the household cluster as random intercept. To study baseline differences between HSS catchments we included a dummy variable reflecting whether clusters where located in the initial HSS catchment. We included the natural logarithm of the wealth score to study differences in socioeconomic groups, and distance to health centre (in tens of kilometres) to study differences in geographical groups, both as continuous variables. We included two time-varying variables, one to reflect annual changes in vaccination coverage in the whole district, and another to reflect changes per year of HSS intervention in the HSS catchment. Finally, we included interaction terms of these two variables with wealth and distance to study the evolution of inequalities in each area. We included children aged 12–59 months in these analyses to allow for adequate sample sizes for each model. Model selection procedures were identical to those described above for the analysis of health system data. To understand which population groups could reach recommended vaccination coverage targets in the HSS catchment and in the rest of the district, we predicted in-sample vaccination coverage for 2018 from each of the reduced multivariate models, at varying levels of socioeconomic class and proximity to health centres.
Finally, we studied the difference in timeliness of vaccination between the HSS catchment and the rest of the district in the subset of children 12–59 months with vaccination cards at the time of the interview in any of the cohort waves (N=786). For this, we estimated the child’s age at vaccination from the date of birth and the date of vaccination. Timely vaccination was estimated for each vaccine based on the recommended age of vaccination by the national EPI in Madagascar: in the first month of life for BCG (recommended to be given at birth), in the fourth month for polio third dose and DTP third dose (recommended to be given the 14th week), and in the 9th month for measles.37
Results
Trends in the rates of per capita immunisation at Ifanadiana’s health centres
Between January 2014 and December 2018, a total of 28 407 BCG, 31 476 polio third dose, 33 241 DTP third dose and 30 371 measles immunisations were delivered by the 19 health centres in Ifanadiana District. Average monthly per capita immunisation rates (age specific, children 12–23 months) at health centres varied from 0.02 to 0.21, with an average of 0.08. Higher rates were observed on average in the HSS catchment, during months where VWs took place and with an apparent increase over time in the whole district (figure 1). These immunisation trends were similar for all the different vaccines considered (figure 1). Results from multivariate analyses revealed that per capita immunisation rates were similar for different types of health centre and HSS catchment at baseline (table 1). Immunisation rates for all vaccines increased over time and varied seasonally, with higher rates during the dry season (peak in August) and lower rates during the rainy season (bottom in February). Annual increase was higher for BCG and measles (OR 1.23 and 1.1, respectively), which require one single dose, than for polio and DTP (OR=1.06 for both), which require three doses. VWs were associated with approximately a doubling in immunisation rates in the months where they took place (OR between 1.88 measles and 2 for polio).
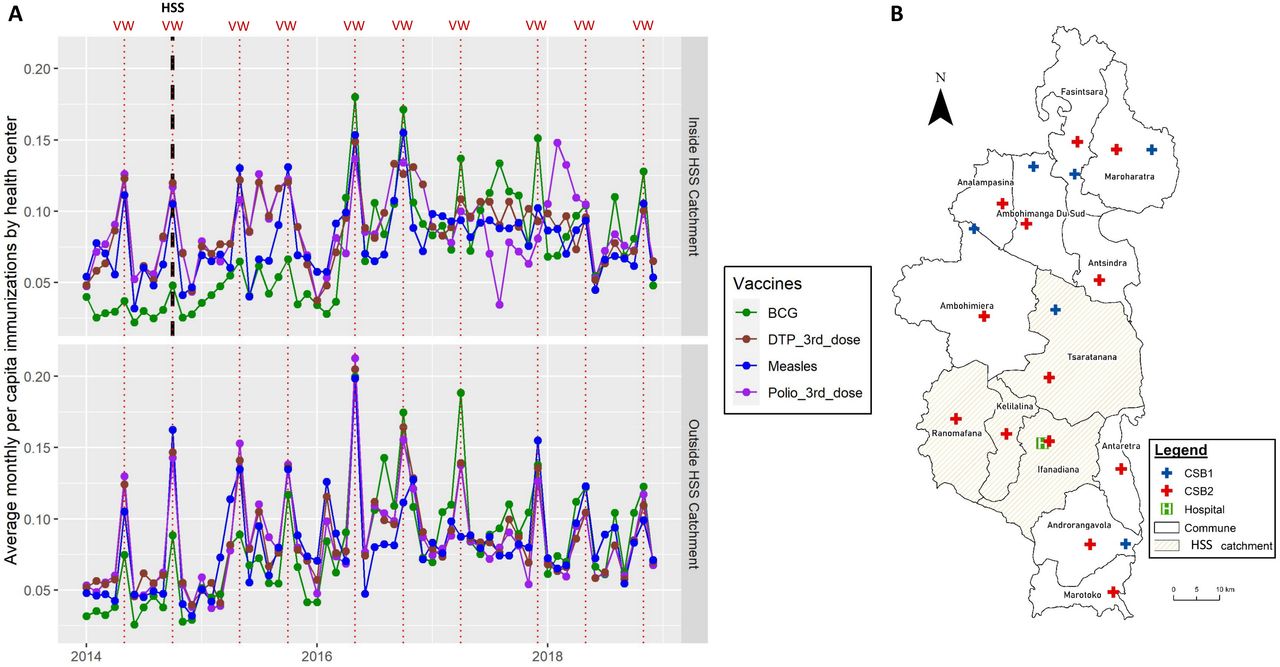
Changes in monthly immunisation rates for children 12–23 months at health facilities in Ifanadiana District, 2014–2018. (A) Average number of monthly immunisations per capita (age-specific, 12–23 months) delivered by health centres over time in the HSS catchment and in the rest of the district, with colours representing different vaccines. (B) Map of Ifanadiana district and its health facilities. The initial HSS catchment is shown as yellow shaded areas, whereas the rest of the district is shown as white areas. DTP, diphtheria, tetanus and pertussis; HSS, health system strengthening; VW, vaccination weeks.
Determinants of per capita monthly immunisations at health centres in Ifanadiana district, 2014–2018 (Generalized Linear Mixed Model (GLMM), multivariate results*)
The HSS intervention, implemented since October 2014 in one-third of Ifanadiana district, was associated with a significant increase in immunisation rates (OR between 1.22 for measles and 1.49 for DTP), although this effect diminished over time (OR for interaction of HSS with annual change between 0.91 for DTP and 0.95 for BCG). Interestingly, the relative contribution of VWs to overall immunisation rates was lower in the HSS catchment following the HSS intervention, with an OR for the interaction with VWs between 0.62 for polio and 0.77 for measles (table 1). Full multivariate models that included all explanatory variables regardless of statistical significance (online supplemental table S4) had results consistent with those described here using reduced models, although estimates of HSS impact were smaller in considering the full set of control variables.
Changes in population-level vaccination coverage from the longitudinal cohort
Trends in vaccination coverage and inequalities
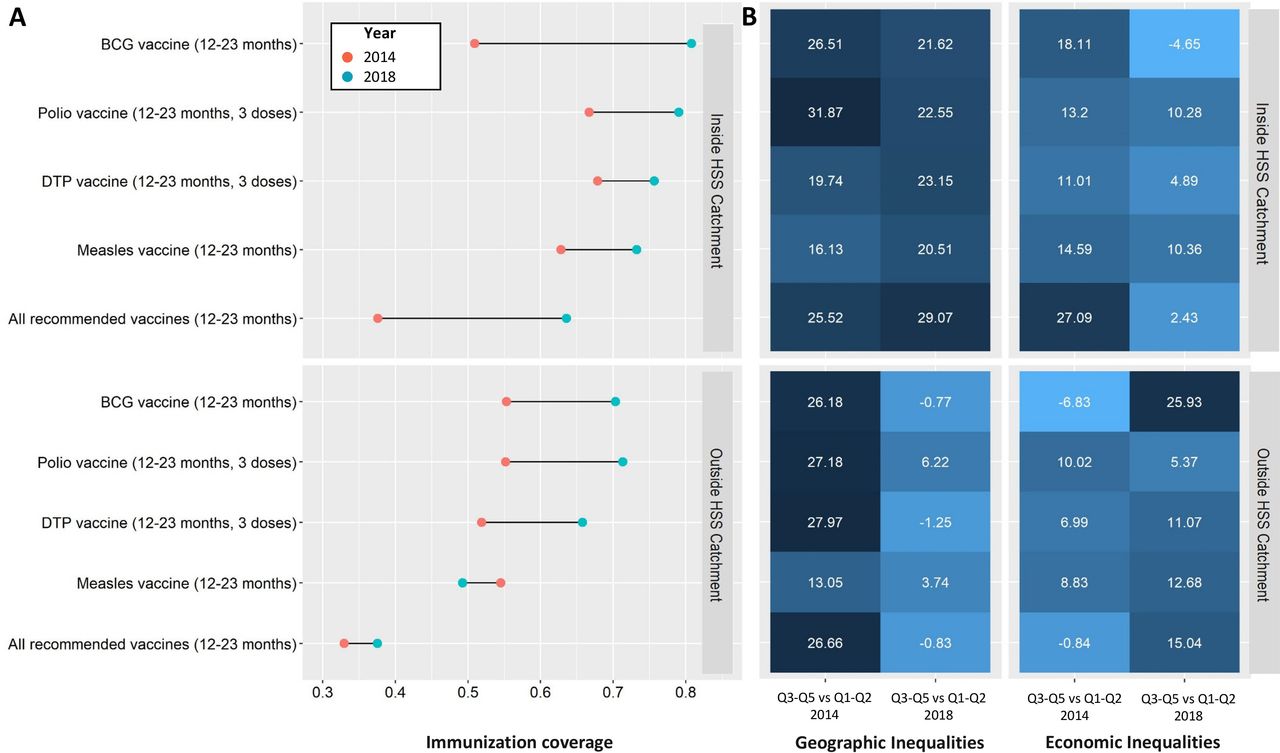
In total, data from 2699 children between 12 and 59 months of age were obtained from the longitudinal cohort. Of these, 651 were between 12 and 23 months old, the age at which all four immunisations studied here should be completed. Vaccination coverage for children 12–23 months was very low at baseline, ranging from about 54%–59% depending on the vaccine. Only 34.6% of children 12–23 months were fully vaccinated in 2014. Consistent with analyses of health system data, coverage for most vaccines improved substantially during the study period, especially in the HSS catchment (figure 2). In 2018, 63.6% were fully vaccinated in the HSS area, compared with only 37.5% in the rest of the district. Coverage in 2018 varied for each vaccine considered; BCG had the highest coverage (80.8% inside and 70.3% outside the HSS catchment), whereas measles had the lowest coverage (73.2% inside and 49.2% outside the HSS catchment). The minimum recommended coverage of 90% was not reached for any of the vaccines, either inside or outside the HSS catchment.

Changes in vaccination coverage for children 12–23 months and associated inequalities in Ifanadiana district, 2014–2018. (A) shows changes in immunisation coverage over time, split by HSS catchment and type of vaccine. (B) shows inequalities in coverage over time, according to geographical quantiles (distance to health centre, left panel) and economic quantiles (wealth score, right panel). Colour gradient shows the difference in coverage between the best-off groups (quantiles 3–5) and the worst-off groups (quantiles 1 and 2), from dark blue (greater difference, more inequalities) to light blue (smaller difference, less inequalities). Results from an equivalent analysis of inequalities but comparing Q4–Q5 vs Q1–Q2 is available in online supplemental figure S2. DTP, diphtheria, tetanus and pertussis; HSS, health system strengthening.
Disparities in immunisation coverage were observed according to households’ geographical distance to health centres and wealth, with different trends in the HSS catchment and in the rest of the district (figure 2). In 2014, the difference in coverage between households living closer (quantiles Q3–Q5) and further (Q1–Q2) from health centres ranged from 25% to 32%, except for measles vaccine. Differences between wealthier (Q3–Q5) and poorer (Q1–Q2) households were smaller, between 5% and 15% for most vaccines. After 4 years, economic inequalities in vaccination coverage were substantially reduced in the HSS catchment, with little change in geographical inequalities. In contrast, in the rest of the district geographical inequalities were greatly reduced, while economic inequalities increased for all vaccines except for polio. Online supplemental table S2 shows vaccination coverage rates in each of the cohort years (2014, 2016 and 2018) and these different population groups.
Determinants of vaccination coverage trends and predictions of coverage targets
Multivariate analyses of vaccination coverage trends between 2014 and 2018 revealed consistent predictors for most of the vaccines studied (table 2). Baseline differences between the HSS catchment and the rest of the district were observed for only two vaccines, BCG (OR=0.6) and DTP (OR=1.65). Coverage of each of the four vaccines was positively associated with household wealth and negatively associated with household distance to health centres. The odds of vaccination for children in remote households was between half (OR=0.52, measles) and a fifth (OR=0.22, BCG) for every additional 10 km from the nearest health centre. Vaccines with three required doses were the most associated with household wealth, with an OR of 2.58 for DTP and 2.85 for polio. District-wide improvements in vaccination coverage were associated with a reduction in geographical inequalities over time and not with a homogeneous improvement for all population groups. Indeed, the OR of the interaction between annual change and distance to health centre ranged from 1.17 (all vaccines) and 1.31 (BCG and polio), meaning that each year households living far from health centres had progressively better coverage, closing the gap with those living in close proximity. Changes in the HSS catchment were distinct from the rest of the district. First, every year of HSS intervention was associated with an increase in the odds of vaccination in the HSS catchment between 1.18 (measles) and 1.43 (BCG), except for DTP. Unlike the rest of the district, children from wealthier households in the HSS catchment had lower odds of vaccination over time (OR of interaction ranging from 0.73 to 0.83), meaning that baseline economic inequalities were progressively reduced. However, the decrease in the odds of vaccination over time for more remote households in the HSS catchment (OR of interaction ranging from 0.72 to 0.84) effectively compensated the positive effect observed in the district as a whole, meaning that geographical inequalities were only reduced outside the HSS catchment. Full multivariate models that included all explanatory variables regardless of statistical significance (online supplemental table S5) had results consistent with those described here using reduced models.
Determinants of vaccination coverage at the population level in Ifanadiana district, 2014–2018 (Generalized Linear Mixed Model (GLMM), multivariate results*)
In-sample predictions from these multivariate models for 2018 revealed stark differences for achieving international coverage targets depending on HSS support and population characteristics (figure 3). Overall, a 90% coverage (recommended coverage at the national level) could only be achieved for BCG, and just for populations who live in close proximity to a health centre with HSS support and who are among the wealthiest in the area. When the target is relaxed to 80% coverage (minimum coverage recommended for every district), there were some population subgroups for which this target could be achieved in the HSS catchment for every individual vaccine. The range of socioeconomic and geographical groups for which minimum coverage rates could be reached was much larger for BCG and polio than for DTP and measles (figure 3). Coverage targets for all recommended vaccines simultaneously (instead of each independently) could not be achieved for any population group. In areas outside of the HSS catchment, a 90% coverage was not achieved for any of the recommended vaccines or population subgroups. Only those in the top percentiles of wealth and proximity to a health centre achieved an 80% coverage for BCG vaccination without HSS support.
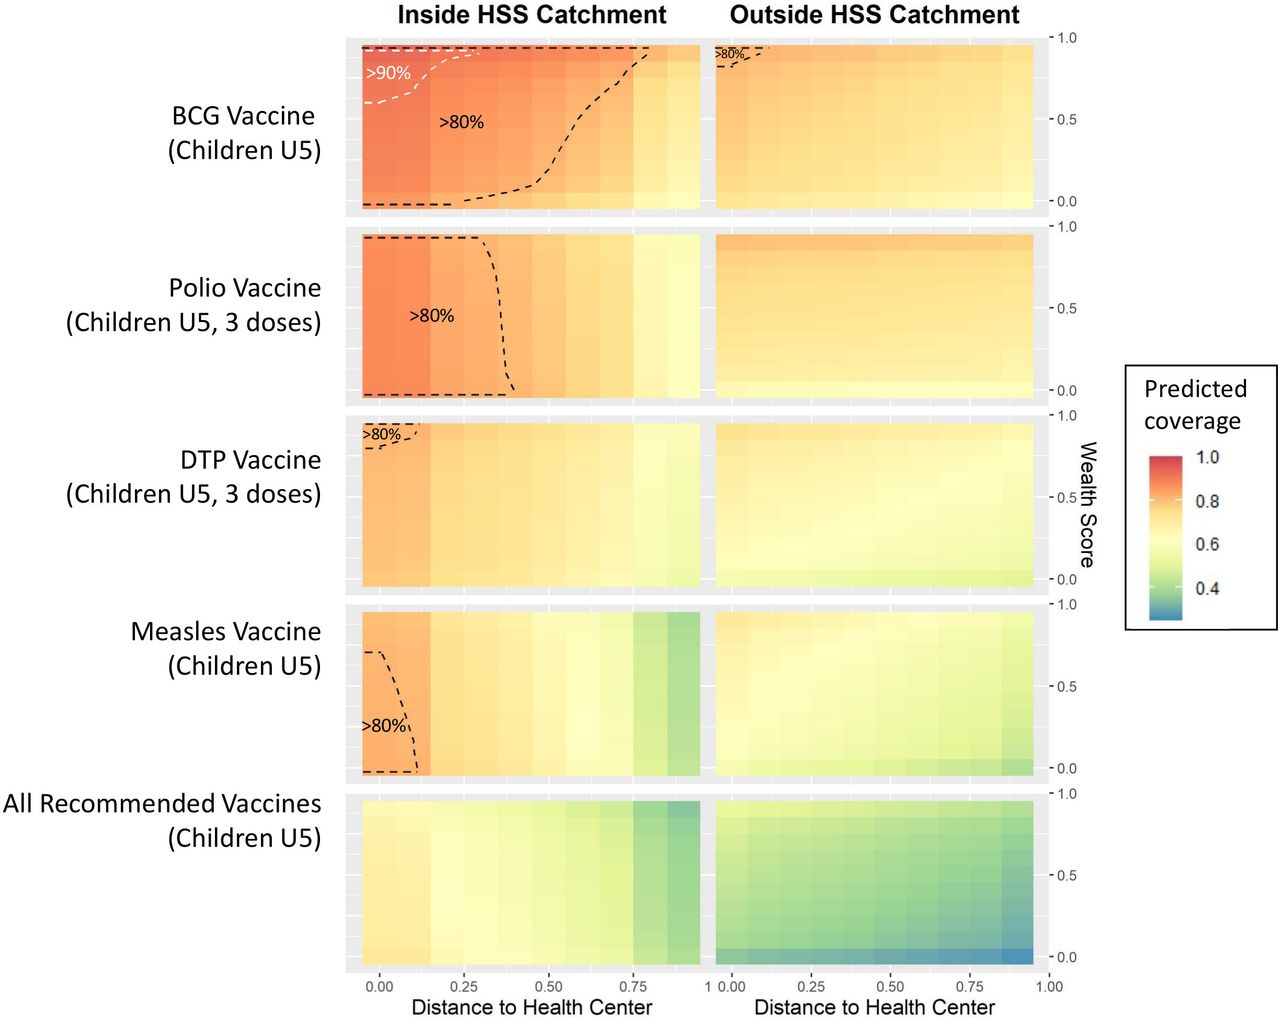
Predictions for achieving vaccination coverage targets for different population groups in Ifanadiana district. Graphs show in-sample predictions of vaccination coverage for the year 2018, estimated from models fitted with the cohort dataset (coefficients available in table 2). For this, vaccination coverage was estimated for every combination of household distance to health centre and wealth (split into deciles) in the HSS catchment and in the rest of the district, using the fixed effects of each model. Areas with predicted coverage greater than 90% or 80% are surrounded with white dashed lines or black dashed lines, respectively. DTP, health system strengthening; HSS, health system strengthening.
Timeliness of vaccination
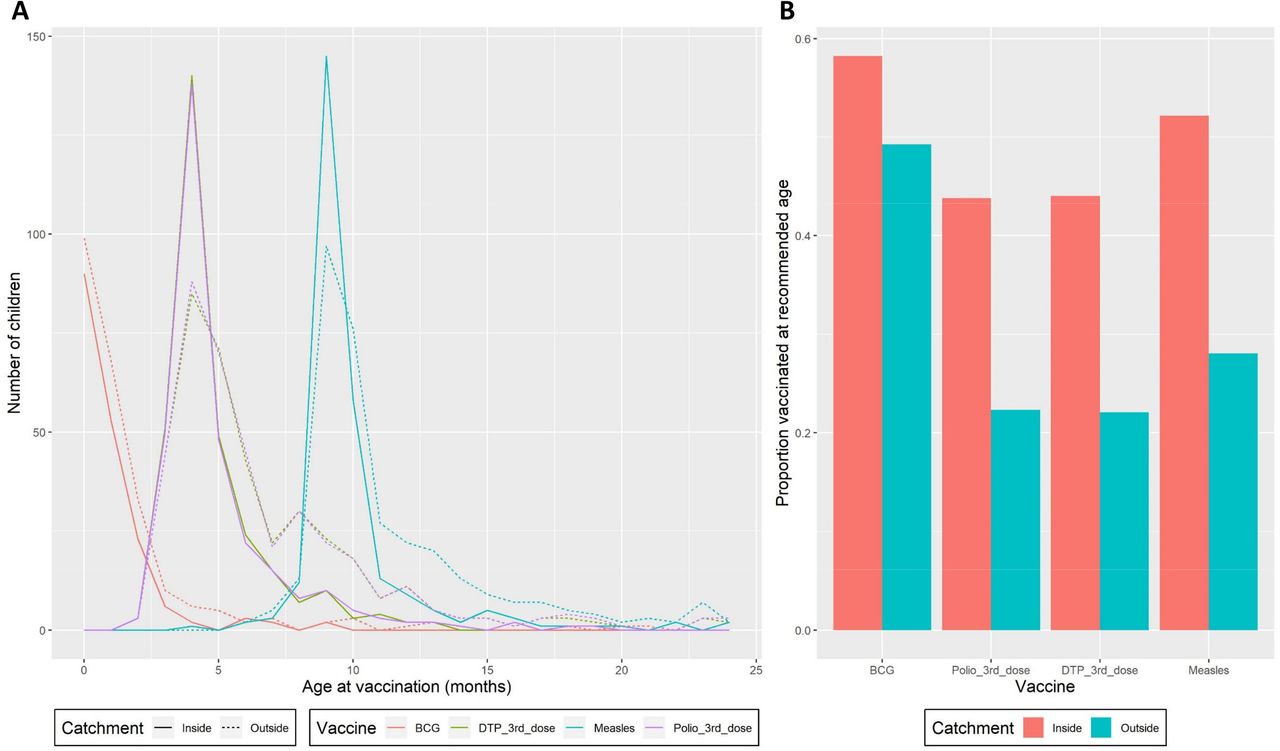
Among the 786 children aged 12–59 months who had a vaccination card at the time of the interview, timeliness of vaccination varied widely depending on HSS support and the vaccine considered (figure 4). Most children were vaccinated in the first month of life for BCG, at 4–5 months for the third dose of polio and DTP, and at 9–10 months for measles (figure 4A). Vaccination occurred later than recommended in national policies (see methods section) for many children, especially those outside the HSS catchment. As a result, the proportion of children vaccinated at the recommended age was higher in the HSS catchment, ranging between 58% for BCG and 44% for polio and DTP (figure 4B). In the rest of the district, this proportion was significantly lower and ranged between 49% for BCG and 22% for polio and DTP. Timeliness of vaccination improved between 2014 and 2018 in the HSS catchment for all vaccines except for BCG, while it only improved for measles in the rest of the district (online supplemental figure S1).

Timeliness of vaccination among children 12–59 months in Ifanadiana district. (A) Age of vaccine administration (in months) as reported in children’s vaccination cards inside the HSS catchment (solid lines) and in the rest of the district (dashed lines), with colours representing each type of vaccine. (B) Proportion of children vaccinated at the recommended age for BCG (1st month), third dose of polio (4th month), third dose of DTP (4th month) and measles (9th month), as per the Madagascar Expanded Programme on Immunisation. DTP, diphtheria, tetanus and pertussis; HSS, health system strengthening.
Discussion
The COVID-19 pandemic has brought renewed attention to the benefits and challenges of ensuring global access to vaccines as the most effective means to reach herd immunity, halt epidemic spread and save countless lives.57 58 For routine childhood immunisations, delivery strategies have not substantially changed in decades: vaccines are delivered by healthcare professionals, either at health facilities or through outreach activities in the form of vaccination campaigns. Understanding how these delivery strategies can be improved in order to achieve vaccination coverage targets is essential, especially in rural areas of the developing world where delivery is significantly more challenging due to the fragility of health systems and associated health budgets. Using a comprehensive dataset on childhood immunisations at both the health system and population levels in a rural district of Madagascar, we show here how strengthening local health systems can help improve key indicators of vaccination coverage, with different impacts on routine and outreach immunisations. The HSS intervention led to an increase in RI, resulting in higher vaccination coverage, a reduction in economic inequalities, and a higher proportion of timely vaccinations. Yet, these gains disproportionately benefited those who lived in closer proximity to health facilities. Lower contribution of outreach activities in the HSS catchment was associated with a persistence of inequalities in geographical coverage in the area, which prevented achieving international coverage targets for many population groups.
There is widespread agreement that RI should be the basis and the foundation of immunisation programmes, but questions remain on how to optimise the delicate balance between providing long-term support to RI and improving short-term access via outreach activities.16 59 The multiplicity of barriers to accessing health facilities for populations in low-resource settings requires mass vaccination campaigns and other outreach activities to maintain or increase coverage, but these strategies can have, in turn, negative effects on the rates of RI.13 28 For instance, RI in Madagascar decreased in the months after SIAs and VW, resulting in seasonal gaps in immunisation and delays from the recommended age of vaccination.13 Here, we provide complementary insights: where RI improved due to ongoing HSS efforts, the contribution of outreach activities to overall vaccination coverage diminished, with mixed impacts on coverage inequalities. Timeliness of vaccination was better in the HSS catchment, with twice the proportion being vaccinated at the recommended age for polio, DTP and measles in the HSS catchment than in the rest of the district. Timely vaccination is key to ensuring that children are fully protected against common childhood illnesses by the time when they are most at risk, and can help prevent episodic outbreaks.26
We found that the HSS intervention was associated with a 20%–50% increase in the odds of monthly per capita immunisations, which resulted in a 20%–40% increase in the odds of coverage per year from 2014 to 2018, and a reduction in economic inequalities over time. This effect may seem counterintuitive, as immunisations are provided free of charge at health facilities across Madagascar as part of the national EPI. However, it has been widely reported that despite childhood vaccines being free of charge, children of poorer households frequently have lower vaccination coverage than their peers,60–63 which is consistent with our findings. Seeking healthcare for healthy children may not be always be a priority for people living under severe poverty, especially given the disproportionate impact of the loss of income associated with seeking care, indirect transportation costs, and lower reported awareness of the long-term benefits of vaccination.60–63 This may explain why BCG vaccination coverage decreased significantly as a function of distance to the health centre, as most deliveries in remote areas occur at home. The HSS intervention included, among others, renovations to health facilities, hiring of additional health staff, community sensitisation and expanded support for reproductive health, including deliveries in health facilities, antenatal and postnatal care, all of which could have improved the confidence on the health system and increased awareness, particularly among mothers of young children. In addition, the removal of user fees at health facilities, which resulted in a tripling of primary care utilisation for individuals of all ages over this period and significant increases in maternal health services,55 could have had the indirect benefit of increasing health seeking for services that were already free of charge, as adults and mothers get more used to visiting health centres. An increase in perinatal health services could indeed explain why BCG vaccination coverage was consistently higher than measles coverage, since BCG is delivered right after birth as opposed to measles, which is delivered 9 months later. Health system approaches such as the one implemented in Ifanadiana are increasingly recognised as potential solutions to achieve, not only vaccination coverage targets, but also progress towards universal health coverage.64 65
Despite HSS efforts to support vaccination delivery at the community level during VW and other outreach activities, geographical inequalities in vaccination coverage persisted or even increased for certain vaccines in the HSS catchment, probably as a consequence of the higher contribution of facility-based immunisations to overall vaccination coverage in the area. Distance to healthcare facilities is a known determinant of low vaccination coverage,60 66 67 especially in countries like Madagascar, where coverage is lower than average.17 Outreach activities during VW and mass vaccination campaigns can be effective ways to reduce geographical inequalities,21 and these took place in both the HSS catchment and the rest of the district. The higher contribution of outreach activities to overall vaccination coverage in the area of Ifanadiana not supported by the HSS intervention would explain why most of the gains in vaccination coverage were seen via a reduction of geographical inequalities over time (remote populations benefited more than populations living closer to health centres). However, previous modelling studies have shown that eliminating geographical inequalities alone will not achieve coverage targets across Africa, and that parallel increases in routine vaccination rates are necessary.17 This is consistent with our results, where only certain population groups in the HSS catchment (those of higher socioeconomic level and living in proximity to health centres), but none in the rest of the district, actually reached international coverage targets required for herd immunity. Additional efforts are therefore necessary to sustain improvements in the district, including the geographical expansion of HSS efforts, and a particular focus on supporting outreach activities in the HSS catchment (eg, more frequent vaccination campaigns, routine expeditions by mobile teams).
Our study had several limitations. First, we used official MoPH data on population size for children aged 12–23 months in our analysis of per capita immunisations at health centres. These are notoriously inaccurate and can lead to estimated coverage rates above 100%, which would be the case in our setting if we had used annualised rates. This is unlikely to have affected our analysis unless inaccuracies in population data were highly structured across health centres (much overestimated in some and underestimated in others). The consistency between health system and cohort results suggests that there was limited bias in the analyses of per capita immunisations. Second, less than one-third of the children studied in the cohort had a vaccination card at the time of the interview, so their vaccination status (and therefore estimates of coverage) depended largely on the mother’s report. Although potentially flawed due to recall bias, vaccination coverage figures used by most international organisations and national governments are based on surveys (DHS, MICS, etc) that use the same methods, and the proportion of children with vaccination cards was not lower here than in other settings.68 Third, our analysis of vaccination timeliness used exclusively children with vaccination cards and we observed that this group was significantly wealthier and closer to health facilities than children without vaccination cards (online supplemental table S3), so timeliness results may not be generalisable to the whole district population. Fourth, although we account for baseline differences between the two areas in our models, the HSS catchment had significantly better socioeconomic indicators than the rest of the district,44 which could have impacted the positive results observed in the HSS catchment over time. Finally, although the IHOPE cohort includes over 8000 individuals, the sample size for children aged 12–23 months is relatively low, which precludes the robust estimation of vaccination coverage predictors with complex statistical models. For this reason, we expanded the age range of the cohort statistical analyses to children aged 12–59 months. This could have had an impact in the interpretation of results if trends observed for children 12–59 months were greatly different from those in children 12–23 months.
In conclusion, our study shows that strengthening local health systems can help improve vaccination coverage and timeliness of immunisation in rural, low-resource settings, even when those interventions do not target specifically vaccine improvements themselves. By increasing the contribution of RI over other immunisation strategies such as VW or mass campaigns, the intervention helped reduce economic inequalities in vaccination coverage, but failed to reduce geographical inequalities. Overall, the target of 90% immunisation coverage was not achieved for any vaccine, but many populations in the HSS intervention area achieved immunisation levels above 80%. Explicit efforts are necessary in areas undergoing HSS to vaccinate children in remote areas so that immunisation goals can be reached.
Data availability statement
Data used in this study are available from the corresponding author on request.
Ethics statements
Patient consent for publication
Ethics approval
This study was approved by—Madagascar National Ethics Committee (041/MSANP/SG/AGMED/CERBM)—The Harvard Medical School Institutional Review Board (IRB16-0347).
Acknowledgments
The authors acknowledge the contributions and support Herrnstein Family Foundation, and Benjamin Andriamihaja. They are grateful to all of the staff at PIVOT for their field support and their remarkable work in strengthening the health system in Ifanadiana. Thanks are due to the Madagascar Ministry of Health, at both the district and the central levels, for their continuous support and valuable insights. The authors also thank the Institut National de la Statistique (INSTAT) field teams for their involvement in the district wide population survey. Special thanks to Amy Wesolowski for insightful discussions.
References
Supplementary materials
Supplementary Data
This web only file has been produced by the BMJ Publishing Group from an electronic file supplied by the author(s) and has not been edited for content.
Footnotes
Handling editor Seye Abimbola
Twitter @CJEMetcalf
Contributors Conceived and designed the experiments: ER, AG, ACM, MHB and CJM. Collected the data: BRaz and MR. Performed the analysis: ER and AG. Wrote the initial draft of the manuscript: ER and AG. Revised the manuscript and accepted it in its final form: ER, MHB, ACM, FAI, LC, BRat, FHR, KEF, RJLR, GC, BRat, FR, MR, EMR-F, AR, CJM, BRo and AG. Act as guarrantor of the study: ER and AG.
Funding This study was funded by Institut de Recherche pour le Développement (Allocation de Recherche pour une Thèse au Sud (ARTS)); Herrnstein Family Foundation; NGO PIVOT Madagascar.
Competing interests None declared.
Provenance and peer review Not commissioned; externally peer reviewed.
Supplemental material This content has been supplied by the author(s). It has not been vetted by BMJ Publishing Group Limited (BMJ) and may not have been peer-reviewed. Any opinions or recommendations discussed are solely those of the author(s) and are not endorsed by BMJ. BMJ disclaims all liability and responsibility arising from any reliance placed on the content. Where the content includes any translated material, BMJ does not warrant the accuracy and reliability of the translations (including but not limited to local regulations, clinical guidelines, terminology, drug names and drug dosages), and is not responsible for any error and/or omissions arising from translation and adaptation or otherwise.