Article Text

Abstract
Introduction Interest in multisectoral policies has increased, particularly in the context of low-income and middle-income countries and efforts towards Sustainable Development Goals, with greater attention to understand effective strategies for implementation and governance. The study aimed to explore and map the composition and structure of a multisectoral initiative in tobacco control, identifying key factors engaged in policy implementation and their patterns of relationships in local-level networks in two districts in the state of Karnataka, India.
Methods Social network analysis (SNA) was used to examine the structure of two district tobacco control networks with differences in compliance with the India’s national tobacco control law. The survey was administered to 108 respondents (n=51 and 57) in two districts, producing three distinct network maps about interaction, information-seeking and decision-making patterns within each district. The network measures of centrality, density, reciprocity, centralisation and E-I index were used to understand and compare across the two districts.
Results Members from the department of health, especially those in the District Tobacco Control Cell, were the most frequently consulted actors for information as they led district-level networks. The most common departments engaged beyond health were education, police and municipal. District 1’s network displayed high centralisation, with a district nodal officer who exercised a central role with the highest in-degree centrality. The district also exhibited greater density and reciprocity. District 2 showed a more dispersed pattern, where subdistrict health managers had higher betweenness centrality and acted as brokers in the network.
Conclusion Collaboration and cooperation among sectors and departments are essential components of multisectoral policy. SNA provides a mechanism to uncover the nature of relationships and key actors in collaborative dynamics. It can be used as a visual learning tool for policy planners and implementers to understand the structure of actual implementation and concentrate their efforts to improve and enhance collaboration.
- health policies and all other topics
Data availability statement
Data are available upon reasonable request. De-identified participant data can be made available upon reasonable request to the corresponding author.
This is an open access article distributed in accordance with the Creative Commons Attribution Non Commercial (CC BY-NC 4.0) license, which permits others to distribute, remix, adapt, build upon this work non-commercially, and license their derivative works on different terms, provided the original work is properly cited, appropriate credit is given, any changes made indicated, and the use is non-commercial. See: http://creativecommons.org/licenses/by-nc/4.0/.
Statistics from Altmetric.com
Key questions
What is already known?
Multisectoral collaborations are essential in efforts to solve ‘wicked’ policy issues, as the solution lies beyond the remit and resources of a single sector.
Effective multisectoral collaborations rely, in part, on efficient governance and implementation mechanisms.
What are the new findings?
This study provides a map of implementation structures in local districts, identifying key actors and relationships among them.
The district health department acts as the lead organisation in governing and steering the implementation of tobacco control programmes.
Measures of network centralisation, density and reciprocity at the district level can be used to indicate interaction and information sharing across stakeholders and government departments.
Despite similar design and resources, the network maps show variation in implementation across districts.
What do the new findings imply?
The mapping of key actors and their connectedness offers a better understanding of implementation structure and the interaction patterns that have implications for governance practices.
The identification of key actors (leaders and brokers) and their role in these structures can provide valuable insights on how to best deliver and monitor interventions.
Social network analysis can be a useful tool to analyse the structure of implementation and help improve intervention in multisectoral settings.
Introduction
The Sustainable Development Goals provide a critical global perspective towards collaborative action across policy sectors.1 2There is a growing literature in health systems research that emphasises the importance of multisectoral governance to address the social determinants of health and to further the cause of achieving equity.3–6 Multisectoral collaborations are complex and dynamic, requiring multilevel systems action and are often prone to conflict and tensions.7 At the core, the challenge lies in governance itself, where traditional hierarchical command and control methods need to adopt more coordinated, consensus-seeking mechanisms that can engage multiple sectors and organisations.8 Thus, successful multisectoral action relies on coordination, mediation of relationships, and the alignment of goals and interests.9
Conceptually, networks—defined as a set of actors connected to one another through one or more dependencies—provide a useful frame for analysing governance in multisectoral policy settings. According to Hjern and Porter,10 policy and programme ‘implementation structures’ in multiorganisational settings often serve as networks, as policies are rarely implemented by a single organisation, but rather by subsets of organisations involved in the programme. These networks manifest architectural complexity as they challenge traditional hierarchal authority through the formation of horizontal relations based on the exchange of resources and trust, rather than top-down command and control mechanisms.11–13 Network structures focus on capturing the patterns of relationships, self-organisation and emergent properties for sustainability, thus providing a useful scope to investigate social complexity and human agency.14 15 Network mapping and analysis enables a better capture of the complexity of multisectoral policy implementation. Networks can enhance collaborative outcomes in service-oriented groups and organisations,16 17 thus making them suitable to be studied as a structural unit for multisectoral policy that engages multiple sectors and stakeholders in policy implementation.
Social network analysis (SNA) is a research approach that can be used to examine implementation structures in a multisectoral policy setting, as it seeks to characterise and quantify the existence of specific types of relationships or interactions between actors.18 It enables the analysis and mapping of patterns of relationships between actors and their supporting actors in the network. In a network, a tie (edge) between two nodes (actors) can represent similarities (shared characteristics, membership), interactions (communication, advice), social relations (kinship, affective, friendship) or flows (beliefs, information, resources, personnel).19 An application of this approach offers insights into the nature of relationships in a system and the network structure of these interactions.19 Such networks include formal roles grounded in mandated institutional positions as well as the informal self-organisational elements of individual actors that expose the dynamics of interactions18 and make them more challenging to assess in traditional evaluation frameworks and methodology. SNA has been used in the understanding of complex healthcare delivery interventions, such as how healthcare staff adopt new practices,20 communicate,21 collaborate,22 seek face-to-face advice and perform joint learning.23 More recently, its application has been tested to understand levels of engagement and network dynamics among participating sectors and organisations in the planning of multisectoral nutrition programmes.24 Thus, SNA provides distinctive methods to map, measure and analyse how social relationships within a network are established and evolve.25 26
This study focuses on multisectoral policy implementation and governance, using the case of tobacco control policy at the district (local) level in Karnataka, a southern Indian state. Local-level implementation is critical for policy success; moreover, being closer to the field, the local level is better attuned to the need for the policy adaptations required to suit particular contexts.27 28 In this study, we focus on the composition and structure of the multisectoral district implementation units by: identifying the key actors that provide support and steer the tobacco control networks and describing how they relate to other actors; examining relationships among tobacco control actors at the district level based on their interaction, information-seeking and decision-making practices; and investigating the structure of tobacco control networks by comparing across two district networks. Ultimately, we provide a structural map of existing implementation networks and identify ways to intervene and strengthen them. The study concludes by drawing lessons on how SNA enables a better understanding of implementation structures and offers suggestions for health systems actors to use SNA as an operational tool to assess, monitor and intervene in the implementation of multisectoral programmes at the local level.
Methods
The case: National Tobacco Control Program
In India, tobacco control initiatives took a deliberate step forward in 2003 through national legislation to promote action on the prevention of tobacco use, known as COPTA: The Cigarettes and Other Tobacco Products (Prohibition of Advertisement and Regulation of Trade and Commerce, Production, Supply and Distribution) Act, 2003. The National Tobacco Control Program (NTCP) was initiated to aid COPTA implementation across the country and create awareness about the harmful effects of tobacco consumption and facilitate strategies for prevention. In 2007–2008, the NTCP was initially launched as a pilot, followed by the release of an implementation guide in 2012 that incorporated learning from the pilot and led to gradual scaling up in other districts.29 During the stepwise scaling-up, the programme’s implementation was merged with the National Health Mission’s overall efforts at the district and subdistrict level to include detailed activities and the provision of required financial support. In this study, we focus on two district levels in Karnataka, a southern Indian state, as districts serve as the main implementation units of the programme across India. Below, we share the structure and activities of the programme at the district level.
Structure
The NTCP has a three-tier structure at the national, state and district levels. Each level has a tobacco control cell with designated human resource and financial support. At the state level, the cell is responsible for planning, implementation and monitoring and is led by a state nodal officer who is supported by a state consultant and a legal consultant. However, the districts remain the unit of implementation, where each cell is staffed with a district nodal officer, district consultant, social worker and a psychologist/counsellor.30
Implementation activities
The activities at the district level focus on: (1) the implementation and monitoring of the COTPA 2003 by conducting information, education and communication (IEC) activities, school programmes and enforcement of COTPA by district teams (comprising health, education, police, food and municipal officers), (2) the training and sensitisation of representatives from police, education and panchayati raj institutions (local governance institutions), transport personnel, non-governmental organisations, health professionals, district enforcement teams, (3) the review by district-level coordination committee, led by a deputy commissioner or assistant deputy commissioner of the district and (4) provision of tobacco cessation support.
Patient and public involvement
Patient and public were not involved
Study design
This survey developed in the study was part of a more extensive mixed methods research project conducted in Karnataka, India. The data was collected from two districts, which were selected based on compliance with the COTPA. We used the district compliance data of 2018–2019, collected by the state antitobacco cell (SATC). The compliance survey measures the implementation of sections 4, 5, 6(a), 6(b), of COTPA, which relates to the prohibition of smoking in public places, prohibition of advertising, promotion and sponsorship of all tobacco products as well as prohibition of sale to minors and near educational institutes. State-level implementers use this survey to track and monitor the progress of the programme across districts. We purposefully selected two districts (table 1) in order to be as similar as possible in all key salient areas expected to affect policy implementation, but with different compliance rates to allow for a comparative perspective in network structure; one with greater (district 1) and another with lesser (district 2) compliance. The selection of districts was shared and discussed with the state-level team, and their perception and experience of working with the districts also supported the selection. In 2018, the NTCP had been scaled-up across both districts, with the same number of subdistrict units, staffing, administrative and financial support. Both of the districts had established a District Tobacco Control Cell (DTCC) by 2019.
Characteristics of the two selected districts
We followed the three steps identified by Blanchet and James25 to use SNA in applied health systems research, namely: defining the set of actors in the network; collecting data using the survey and analysing the structure.
Defining the actor set in the network
The first step was to identify the set of individual actors in each of the district-level implementation networks. We defined our network boundary (set of actors) a priori as implementers and managers across different departments and organisations engaged in the implementation of the NTCP at the district level, including subdistrict officials. We also included a medical college, a media representative and a non-governmental organisation that engaged with the programme. We did not include educational institutions, specifically primary and secondary schools, as we focused on mapping actors with administrative and/or managerial roles in implementation. The actors were identified using a list shared by the department of health that included the details of the designated officers. This list was verified and adapted with inputs from the DTCC, as each district varied in terms of the departments engaged with the NTCP. Additionally, district-level documents and circulars were reviewed to identify the actors and their engagement with NTCP. The survey tool also included an option to identify any other important actor that was not on the list. After adapting the list, a final actor set was available for each district.
Instrument and data collection
The second step was to define the relationships between actors using a survey instrument, which included both sociodemographic information and network information. First, the survey covered demographic and socioeconomic information for each respondent, including age, sex, highest academic degree, organisation, years in the organisation, administrative position, years in position and association with NTCP. Second, for the network information, the survey instrument required the interviewees to identify the individuals from the actor list whom they interact with (for programme sensitisation), and who they go to for information (implementation assistance) and decision-making support (programmatic or financial approvals). The tool was piloted with respondents from three different departments, and the survey tool was adjusted accordingly to each district to capture the different engaged departments in the tobacco control programme. The three specific network interests (programme sensitisation, information-seeking and decision-making) evolved during the tool piloting, as they were defined as three broad categories of interaction defined by the implementers. Interaction relates to general sensitisation about the programme, whereas information-seeking and decision-making denote specific purpose or reason behind the interactions, with respect to the tobacco control programme.
The survey (online supplemental file 1) was administered to all the actors across different departments, including the departmental heads with higher administrative ranks. In order to increase the response rate and minimise missing data, SM and SLo administered the survey themselves in person. The actor list was presented to each participant, and they were asked to identify individuals with whom they interacted one-to-one, via face-to-face or telephonic conversation, while working on the NTCP in the preceding 12 months. The participants could also name other actors not on the list but with whom they had discussed the implementation of tobacco control in the past year. The field work was facilitated by a letter from state department of health, providing permission to conduct the study. This letter was further used by the DTCC to inform the departments and respective organisations about the study and the requested for time. The overall study was also facilitated by the Institute of Public Health, Bengaluru, which has engaged in tobacco control in Karnataka for over a decade, and connected the lead author to state and district-level networks.
Supplemental material
Data management and analysis
Each participant in the survey was anonymised and assigned a numerical identifier. The data were entered onto an Excel spreadsheet, which was consolidated and imported to R-Software (V.1.3.1093) and packages (I graph and isnar) for analysis and generation of network maps. To overcome the challenge of missing data, we retained those members in the implementation network who declined or could not participate but were mentioned by other participants. However, their personal networks and reciprocal relations were not included in the analysis. We calculated descriptive statistics on sociodemographic information collected, conducted sociometric analysis and calculated network metrics and generated sociograms from the network data. Table 2 describes their analysis and selection, along with the significance and utilisation in the multisectoral policy implementation network, drawn from network literature and its application.16 31–37
Describes the network measure, its interpretation and application for multisectoral implementation network in the study
Results
In this section, we share the results from the analysis, organised as follows1: analysis of sociodemographic characteristics across the two districts; and2 sociograms (social network maps) and network-level measures for (2a) the interaction network, (2b) the information network and (2c) the decision-making network in both districts.
Sociodemographic characteristics of actors across two districts
The survey was administered to 108 respondents, 51 in district 1 and 57 in district 2. Table 3 presents the characteristics of the survey respondents. The survey response rate was 89% in district 1 and 83% in district 2. We observed a difference in the departments that engaged with NTCP in each district. District 1 had additional members across judiciary, labour and other (medical college and media) departments, while district 2 had additional members from the Women and Child Development department. The most engaged departments across both districts were health, education, police and municipal.
Sociodemographic characteristics of the survey respondents of NTCP across two districts
Beyond these sociodemographic characteristics, we collected data on NTCP engagement. Among the total, four respondents from district 1 and two from district 2 stated they did not engage at any given point. These six participants had delegated the programme task to a junior official within their respective departments and did not participate in the programme directly. There was a difference observed in attendance for district coordination committee meeting and training in both districts. District 1 had a higher attendance for training while district 2 had a higher attendance for committee meetings. Participants who had not received any training were briefed on their role by their departmental superior or by the district nodal officer for tobacco control.
Network-level measures and sociograms
District-level interaction network
The interaction networks mapped in figure 1 show nodes (actors) as circles, and ties between them are represented as lines (edges). We used the in-degree centrality measure, where the size of the node indicates in-degree centrality, while the thickness of edges (ties) represents how frequently they interact. The frequencies of interaction were used as weights. The key actors across both networks were the DTCC members, especially the district nodal officer, district health officer, district consultant and subdistrict health officers. The centralisation was higher in district 1 than district 2. Structurally, district 1 was more centralised with one main node (actor), whereas district 2 had more nodes of similar importance. District 2 had a higher number of nodes with higher betweenness centrality; these nodes that represent subdistrict health managers can be referred to as broker nodes as they connect other nodes to the network at the subdistrict level.
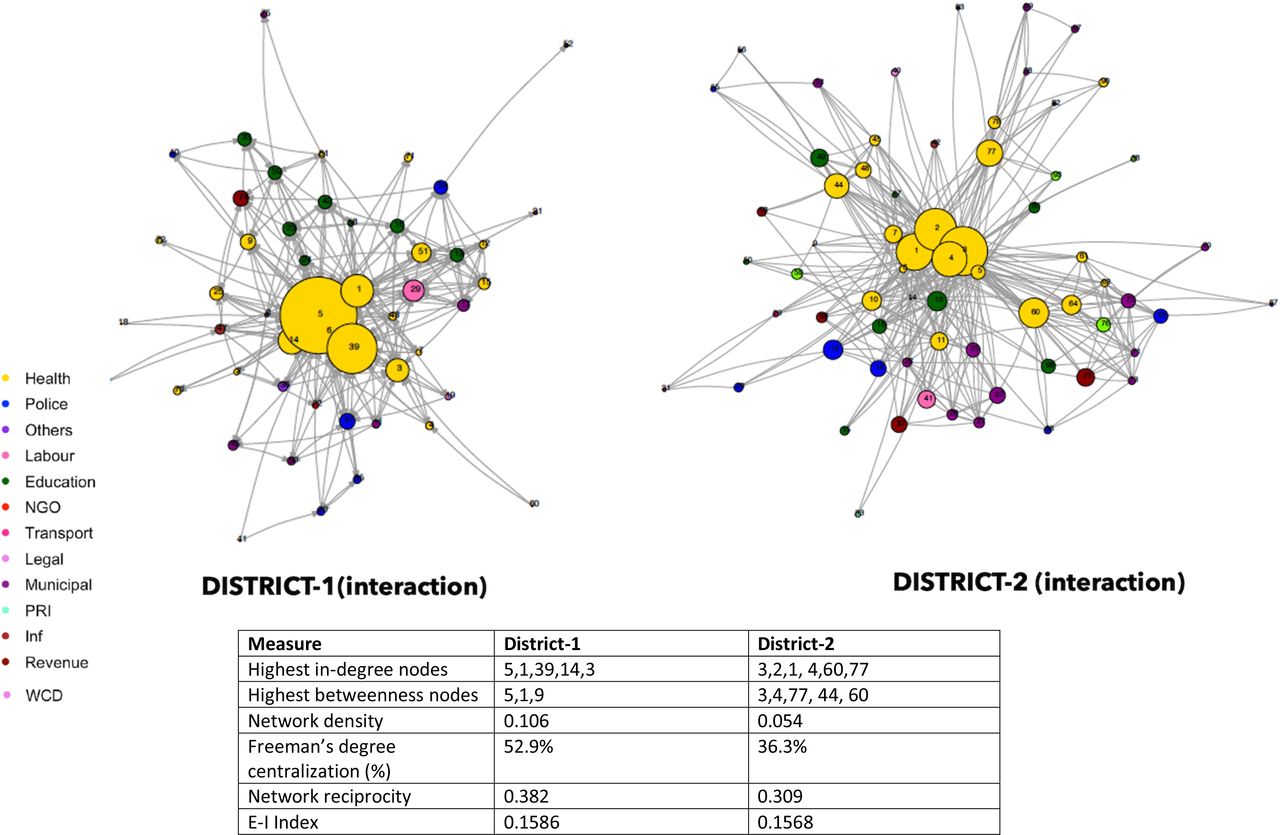
Interaction graphs of the NTCP for both districts. NTCP, National Tobacco Control Program; Inf, Information and Broadcasting; PRI, Panchayati Raj; WCD, Women & Child Development; NGO, Non-Governmental Organisation.
District 1 also had higher values of density and reciprocity. We did not find any isolated actors in either district, meaning that everyone is connected to some network member. The interaction network was the largest of the three networks.
District-level information-seeking network
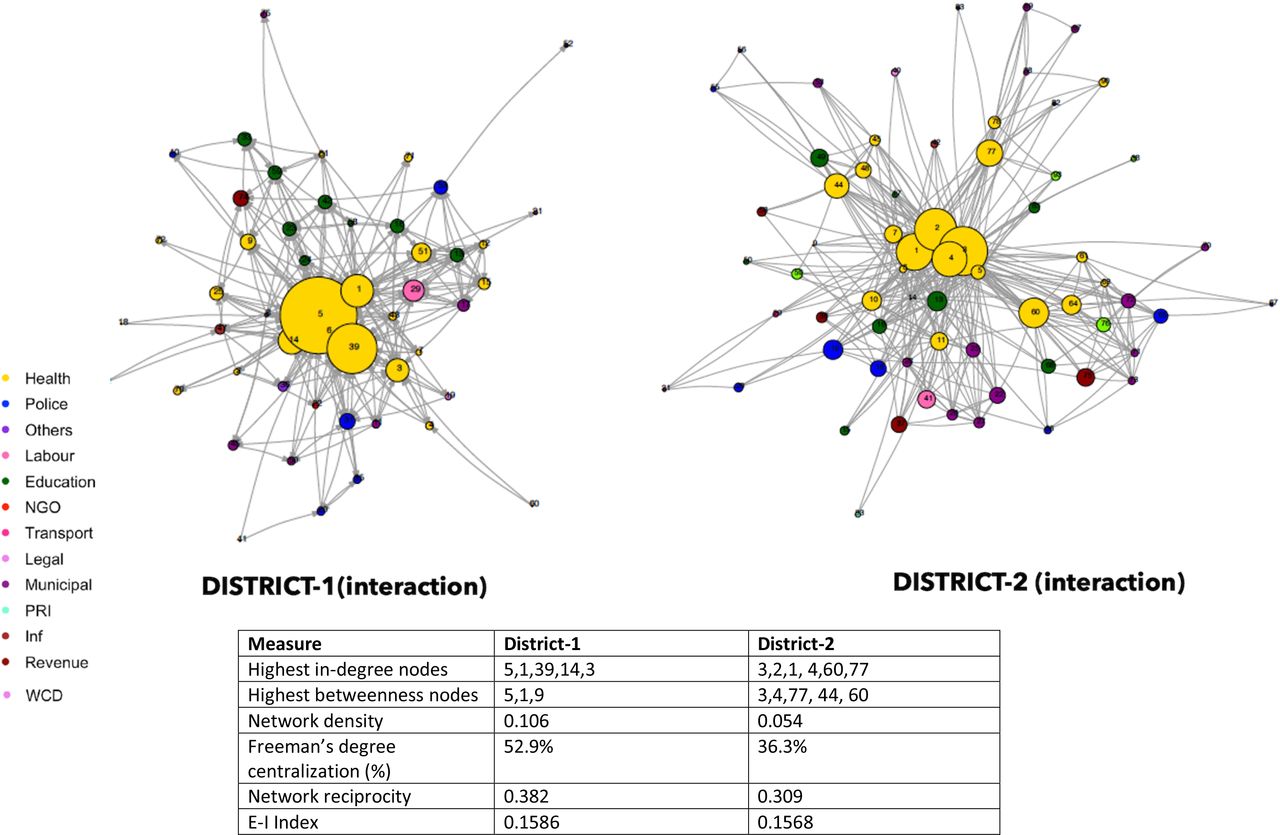
Figure 2 shows the information-seeking networks across two districts. Actors were asked to identify resources for implementation within the network, including clarification of guidelines, advice around planning COTPA enforcement drives and training activities. During the survey, several participants mentioned that they focused on their specific assignment and did not seek information about programme implementation. This information was mostly sought by mid-level managerial staff responsible for providing guidance to the field-level implementers.

Information-seeking graphs of the NTCP for both districts. NTCP, National Tobacco Control Program; WCD, Women & Child Development.
The information-seeking map reveals a similar pattern. The actors from the department of health remain central in terms of providing information on the programme. The most central nodes in the information-seeking map were the same as in the interaction map. District 1 also had a similar centralisation pattern, led by the nodal officer, as previously noted. However, district 2’s information network was led by district consultant, and brokering roles for intermediate-sized nodes, representing subdistrict managers, were more distinct. We also observed two isolated pairs in district 1 and one pair in district 2. These were the police and municipal department members, who reached out to their own departments for information support. The members of the DTCC were supported by the SATC members to provide information support across both districts.
District-level decision-making network
Figure 3 shows the decision-making network across two districts. The respondents required inputs and approvals to make decisions regarding financial and programme planning. Very few actors in the district were identified as having such a decision-making role. In district 1, we observed a similar centralisation pattern for decision-making, which corresponds to higher network centralisation, where the nodal officer was key in providing decision-making support to the network such as disbursing funds. In district 2, the pattern of centralisation was diminished, with more dispersed decision-making nodes. Here, the subdistrict health managers played an essential role. We also note that participants from the municipal, education, health and police referred to their own department for decision-making support. The central actors from the health department, meanwhile, sought decision-making support from the police and revenue department.

Decision-making graphs of the NTCP for both districts. NTCP, National Tobacco Control Program.
Discussion
Our study identifies the structure of local-level implementation networks, key actors and their relationships within the networks. In rendering the relationships between actors more explicit, these network maps contribute to better understanding network dynamics. In this section, we compare the networks across the two districts to understand the similar and different patterns observed and discuss practical implications for researchers and policymakers.
Network structure and district characteristics: cues about programme compliance
We mapped, illustrated and studied the implementation network of tobacco control programmes across two districts. We uncovered some similarities across both districts. First, the actors most frequently engaged in the programme were from the departments of health, education, police and municipal. Second, health remained the lead organisation, with high centralisation and key actors from the district cells (DTCC), especially in interaction and information-seeking networks. Third, district-level health department leads relied on state teams for information support. Fourth, a positive E-I Index indicates that the DTCC built connections beyond their own departments to implement the programme. Finally, regarding decision-making support, we found that the most important health actors relied on other departments such as revenue and police.
We also found that the two districts differed with respect to the departments engaged, the respective central actors leading the networks, and network measures. In district 1, the judiciary, labour, media and members of the medical college were involved, while in district 2, women and child development were engaged in the tobacco control network. Across the three network maps encompassing interaction, information and decision-making, a similar pattern emerged for both districts. In the first district, the nodal officer for tobacco control was the lead actor, well connected to other members across the district. District 1 also produced higher values for density, reciprocity and network centralisation. The second district revealed the key role of sub-district health managers, beyond the district team members, who were led by the district consultant.
The differences identified between district networks are indicative of a plausible explanation, which can help pinpoint factors that affect compliance. District 1, the more centralised network, had the potential for rapid diffusion of information, characterised by high reachability to people in the network who can act as broadcasters. The centralised networks also share more power and influence with the central actors.33 The network lead for district 1 is the district nodal officer for tobacco control, the designated lead for whole district who formally implements and coordinates the programme in the entire district. Thus, in such a case, if the central actors are active and embrace the idea of networking and working across departments, diffusion and coordination can be more effective. In district 2, the subdistrict health managers appear to play an important role as they have high betweenness centrality in the network. This indicates that the identified person or node plays a significant part in allowing information to pass from one part of the network to the other, especially with other subdistrict members of the tobacco control programme. We found they acted as bridges or brokers to the main network as they facilitate the flow of information and resources within the groups of people separated from the main network.36 These actors can maximise a network’s benefits by reaching actors and people who are difficult to reach.38 Engagement and participation from these brokered nodes can facilitate or inhibit joint action of the actors within the network. These subdistrict managers are not the designated or full-time members of the district-level tobacco control team but are important managers of information and resources at the subdistrict level coordinating all health programmes. A more engaged participation or allocating designated implementation roles to these subdistrict managers may lead to an increased cooperation and coordination among the participating actors at the sub-district level.
Previous studies have shown that actors in a highly centralised network, where most of the interaction is with one or two key actors, completed tasks more easily and effectively.39 This may be related to the explanation that, in a dispersed network, establishing chains of communication require more intensive efforts to involve, establish and maintain the links.40 A dense and reciprocal communication network can lead to higher rapport, cohesion and trust41 and, hence, facilitate coordination to improve performance. This can be beneficial in a complex multisectoral policy environment, where the dynamic setting needs effective, frequent and open channels of communication between members of the network. As the central tenet of multisectoral collaboration is relationship building, these dense and open information channels can facilitate the mutual understanding, trust and accountability needed to achieve shared goals and opens up mechanisms to provide feedback on processes, and potentially the adaptation required to identify and achieve emergent needs.8 42 43 Such observed patterns of centralisation, density and reciprocity can help us understand the structural differences we observed in the two districts, enabling the identification of key nodes or actors that can be effective and robust channels of communication to provide scope for better coordination.
Lead organisation governance—network management and steering
In describing network governance, Kenis and Provan44 identify three governance forms: participant governed, lead organisation governed and governance by network administrative organisations. The governance practices we observed in tobacco control best align with lead organisation governance. The department of health leads the network governance, either through a central role by the nodal officer for tobacco control and the district tobacco consultant, or through a brokered role by subdistrict managers. The lead organisation guides the governance practices in part, by providing administrative costs, resources to enable coordination, and the network’s goals are best aligned with their own goals.44 In India, the tobacco control programme (NTCP) primarily nests within the department of health at the national and state levels. Both levels contribute to the programme’s financial and human resources. However, to promote coordination across all departments, the head of district administration known as the district commissioner (from the department of revenue) chairs the district-level coordination committee and serves as chair for the overall programme to provide guidance, ensure monitoring and conduct performance review. Hence, in the decision-making network, we observe that the health department does rely on the revenue department to take programmatic and planning decisions. Thus, in practice, the health department leads and coordinates the tobacco control programme and takes all operational decisions,45 but there is a need for cooperation and coordination from other network members to reach their mutual goals. In both districts, we noted that the key health department actors had to make multiple connections with members of different departments. A positive E-I Index in both districts indicates they make connections beyond their own department for programme implementation.
The measure of in-degree centrality is the most frequently used network measure of opinion leadership.46 At the district level, the tobacco nodal officer in district 1 and the tobacco consultant in district 2 demonstrate the highest in-degree centrality and influence in providing guidance for implementation. These leaders or central actors need to coordinate network-level activities through network management, which broadly refers to efforts and activities employed to bring in relevant actors, implement joint efforts and enable problem-solving47–49 in order to fulfil network functioning. The importance of network management50 and the network manager role51 becomes essential for realising network goals and actions. The importance of network management and steering is pronounced in India’s bureaucratic setup, which remains very hierarchical and segmented, with departments working in silos with limited avenues for integration. As the ownership of the programme remains with the health sector, these central actors can act as significant information resources for implementation. This finding is concurrent with the literature revealing how network managers play significant roles in exploring innovative ideas52 and in guiding interactions. Enhancing network efficiency would require supporting and building capacities of network managers, both central actors and brokers, to steer and guide the network. In addition to technical knowledge, several authors have indicated a variety of necessary skills for such managers. These include network diagnostic skills, to reduce and manage uncertainties in complex relationships,52 and skills that enable better comprehension of how to implement appropriate network activities.48 Hence, further building such leadership skills and supporting these leaders can enhance network coordination and efficiency.
Implications for research, practice, and policy
As a means of mapping and exploring implementation of multisectoral coordination, SNA provides a visual structural map of district-level implementation network. A diagnosis in the form of a network map can inform discussions about how different networks can be strengthened. The results of SNA provide more explicit descriptions or ‘mapping’ of key actors, relationships and decision-making, offering insights into health system leaders regarding effective implementation. In this study, both districts relied on key central players for the diffusion of innovation, knowledge and network interventions.53–55 In district 2, we also identified health managers who act as brokers and play a crucial role in coordination and building linkages between different groups in the system,56 57 including the subdistrict level. Strengthening these subdistrict manager’s role in network support and cohesion can enhance participation of subdistrict stakeholder that do not rely on central mediation.
The SNA approach can also provide a pragmatic network diagnosis to facilitate the ‘rewiring’ of networks, where decision-makers might consider intervening to optimise relationships or connections; for instance, to ‘activate’ key actors who could engage with a greater role in decision-making to enhance the potential of the network.25 Network metrics can provide insights into the relationships, positions, structure and strength of a network, so as to diagnose weaker relations/ties which have not been fully utilised. Moreover, SNA can be used as a learning instrument by state and district stakeholders to study these districts as ‘learning sites’ for formalised, continuous research and partnerships to promote continuous learning and create an overlap between policy development and implementation. Simultaneously, this can also provide the scope for the improvement of everyday practices at local level and to promote cooperation and coordination for the programme by sharing the visual network diagrams that build awareness and invite different departmental partnerships.
SNA can be of value during pilot or developmental, implementation and evaluation phase. During the early phases of intervention, it can enable understanding of complex implementation, by deciphering the networks of multiple professionals and associated sectors. Using the mapping exercise, it can help design strategies considering the social context of programme members, its delivery, determining the appropriate methods and channels of communication needs and identify particular change agents and opinion leaders to widen the outreach of network. During the implementation and evaluation phases, when coupled with a mixed methods design, SNA can help analyse network as a whole system and at individual organisational level. Thus, enabling identification of points of influence to create and improve selected strategies for a group or organisation. Therefore, SNA as a tool can be adopted to diagnose, map, monitor and intervene in complex multisectoral health programmes.
SNA is context sensitive,19 33 hence contextual knowledge in designing the tool is crucial. The lead author and coauthor (SM and SLo) spent 2 months visiting the districts, in order to establish relationships and observe implementation activities. This led to an understanding of the implementation context, activities and actors engaged in the network. It was time intensive to seek appointments from various departments, especially from the high-ranking district officers of each department. The state and district tobacco control teams facilitated this survey by providing the permission and making the introduction to other departments. Thus, an SNA that has multisectoral outreach will require a deep understanding of context, programmes and facilitation in the collection and interpretation of the data. The emerging findings were also shared with the state tobacco control team, to help interpret the preliminary findings and situate the research in context. The state team especially appreciated the following findings: (1) the visual representation of the actors and departments engaged at the district level, (2) the identification of most engaged departments beyond health in both districts, (3) identifying the key actors providing information and decision support to the network and (4) recognising the variation of network structure across the two chosen districts.
Limitations
The study also has several limitations. Out of resource constraints, we mapped the networks at a single point in time. While such a snapshot is useful, the networks are indeed dynamic and studying them over time is important to understand how networks evolve and what shapes these networks. Similarly, while the quantitative approach to SNA that depicts positions and transactions across actors is useful, it falls short of capturing the qualitative nature of these relationships. We explored these qualitative aspects in a larger study, the findings from which are reported in a separate paper (Mondal et al, forthcoming). We had high and comparable response rates in the two districts we studied. Yet, we did miss out on some of the actors, whose positions we depicted in the networks but had no data on how they relate to others in the network. The non-response in our study was mainly due to logistical reasons, and the missing data were not concentrated in any specific cadre of officers. While such data could have enhanced our understanding of the networks, it is unlikely that it would have changed our findings substantially. Finally, while we find differences in the network features across the two districts, and such differences could be linked to the differences in the programme implementation in these districts, our study was neither aimed at nor designed to explain this association. Future research could potentially explore how network features could explain such programme implementation scenarios.
Conclusions
Collaboration and cooperation among actors across sectors and levels of governments are crucial for the implementation of complex social policy/programmes, especially in hierarchical bureaucratic systems with limited opportunities for integration. In such scenarios, SNA is very useful to create a visual depiction of actual implementation structures that include key actors, their departments and their relationships. SNA is also useful as an analytical tool to inform policymakers and programme managers about the entry points and strategies to intervene in networks. Such network structures could potentially help explain the results of policy and programme implementation.
Data availability statement
Data are available upon reasonable request. De-identified participant data can be made available upon reasonable request to the corresponding author.
Ethics statements
Patient consent for publication
Ethics approval
This study involves human participants and was approved by Ethics names and IDs: Institutional Ethics Review Board at IPH (IEC-ER/01/2018), Faculty of Medicine Institutional Review Board at McGill University (A05-E24-18B). Participants gave informed consent to participate in the study before taking part.
Acknowledgments
The authors would like to thank the state anti-tobacco cell and district tobacco control units and the Institute of Public Health Bengaluru for their support, facilitation of the study and valuable insights. We also acknowledge Dr. David Loutfi for guidance and support for the analysis and review of initial drafts of the manuscript.
References
Supplementary materials
Supplementary Data
This web only file has been produced by the BMJ Publishing Group from an electronic file supplied by the author(s) and has not been edited for content.
Footnotes
Handling editor Seye Abimbola
Contributors SM designed the study, developed study instruments, collected the data, conducted the analysis, interpretation and wrote the manuscript. SLo helped with the data collection and interpretation. UB, SL, AM and SVB provided feedback on the design, analysis, interpretation and writing of the manuscript. All authors read, edited and approved the final manuscript. SM is the guarantor of the published work.
Funding Shinjini Mondal received doctoral funding from The Common Threads through the Commonwealth Canadian Queen Elizabeth II Diamond Jubilee Scholarship Program (CTC-QES Program) at McGill University and the Fonds de Recherche en Santé du Québec. Upendra Bhojani is supported by DBT/Welcome Trust India Alliance fellowship (IA/CPHI/17/1/503346). The fieldwork was supported by the International Development Research Centre (Canada) through a doctoral research grant.
Competing interests None declared.
Provenance and peer review Not commissioned; externally peer reviewed.
Supplemental material This content has been supplied by the author(s). It has not been vetted by BMJ Publishing Group Limited (BMJ) and may not have been peer-reviewed. Any opinions or recommendations discussed are solely those of the author(s) and are not endorsed by BMJ. BMJ disclaims all liability and responsibility arising from any reliance placed on the content. Where the content includes any translated material, BMJ does not warrant the accuracy and reliability of the translations (including but not limited to local regulations, clinical guidelines, terminology, drug names and drug dosages), and is not responsible for any error and/or omissions arising from translation and adaptation or otherwise.