Article Text

Abstract
Background HIV self-testing (HIVST) has been shown to be acceptable, feasible and effective in increasing HIV testing uptake. Novel testing strategies are critical to achieving the UNAIDS target of 95% HIV-positive diagnosis by 2025 in South Africa and globally.
Methods We modelled the impact of six HIVST kit distribution modalities (community fixed-point, taxi ranks, workplace, partners of primary healthcare (PHC) antiretroviral therapy (ART) patients), partners of pregnant women, primary PHC distribution) in South Africa over 20 years (2020–2039), using data collected alongside the Self-Testing AfRica Initiative. We modelled two annual distribution scenarios: (A) 1 million HIVST kits (current) or (B) up to 6.7 million kits. Incremental economic costs (2019 US$) were estimated from the provider perspective; assumptions on uptake and screening positivity were based on surveys of a subset of kit recipients and modelled using the Thembisa model. Cost-effectiveness of each distribution modality compared with the status-quo distribution configuration was estimated as cost per life year saved (estimated from life years lost due to AIDS) and optimised using a fractional factorial design.
Results The largest impact resulted from secondary HIVST distribution to partners of ART patients at PHC (life years saved (LYS): 119 000 (scenario A); 393 000 (scenario B)). However, it was one of the least cost-effective modalities (A: $1394/LYS; B: $4162/LYS). Workplace distribution was cost-saving ($52–$76 million) and predicted to have a moderate epidemic impact (A: 40 000 LYS; B: 156 000 LYS). An optimised scale-up to 6.7 million tests would result in an almost threefold increase in LYS compared with a scale-up of status-quo distribution (216 000 vs 75 000 LYS).
Conclusion Optimisation-informed distribution has the potential to vastly improve the impact of HIVST. Using this approach, HIVST can play a key role in improving the long-term health impact of investment in HIVST.
- health economics
- HIV
Data availability statement
Data are available on request. Data will be made available on request.
This is an open access article distributed under the terms of the Creative Commons Attribution IGO License (CC BY NC 3.0 IGO), which permits use, distribution,and reproduction in any medium, provided the original work is properly cited. In any reproduction of this article there should not be any suggestion that WHO or this article endorse any specific organization or products. The use of the WHO logo is not permitted. This notice should be preserved along with the article’s original URL.Disclaimer: The author is a staff member of the World Health Organization. The author alone is responsible for the views expressed in this publication and they do not necessarily represent the views, decisions or policies of the World Health Organization.
Statistics from Altmetric.com
Key questions
What is already known?
HIV self-testing (HIVST) is an acceptable and feasible testing strategy that is also effective in increasing HIV testing uptake.
Testing strategies which focus on high yield populations (eg, female sex workers) and high-volume distribution modalities (eg, taxi ranks and workplaces) have been found to be more cost-effective than some community-based or any facility-based testing strategies.
What are the new findings?
Secondary distribution to partners of antiretroviral therapy patients has the largest impact in terms of saving life years lost due to AIDS; however, it is one of the least cost-effective strategies.
Taxi rank and workplace distribution is the most cost-effective, even cost-saving of strategies.
An optimisation-informed distribution of scaling up HIVST can greatly improve the impact of HIVST and result in a more cost-effective strategy compared with a status quo distribution of scaling up HIVST.
What do the new findings imply?
Determining the optimal mix of HIVST kit distribution is crucial in ensuring the most effective and cost-effective strategy for national roll-out of HIVST.
Introduction
South Africa has the highest number of HIV infections worldwide, with an estimated 7.8 million people living with HIV (PLHIV) and 5.0 million on antiretroviral therapy (ART) in 2019.1 Despite having the largest ART programme in the world, over 23% of all deaths in South Africa in 2019 were AIDS-related.2 HIV transmission and AIDS-related deaths can be greatly reduced by identifying PLHIV who are unaware of their HIV status early, linking all PLHIV to ART and retaining them in care.3 The South African government is dedicated to meeting the UNAIDS 95-95-95 fast-track targets by 2025,4 which aim to have 95% of PLHIV diagnosed, 95% of those diagnosed on ART and 95% of those on ART virally suppressed by 2025. In 2017, a HIV household survey showed that 85% of South African PLHIV aged 15–64 years had been diagnosed, although men had a lower rate of diagnosis compared with women (80% vs 89%, respectively).5 Increasing the uptake of HIV testing services (HTS) by introducing novel testing strategies is critical to achieving the UNAIDS target to diagnose 95% of PLHIV in the coming years.
In order to expand HIV testing coverage, the South African National Department of Health (NDoH) has implemented community-based testing to accompany existing conventional HTS, which is most frequently conducted at primary healthcare (PHC) clinics. Recently, HIV self-testing (HIVST) technology has been introduced to give people the opportunity to self-diagnose their HIV status. HIVST involves a person being able to privately collect their own specimen (most often oral fluid), performing the rapid diagnostic test and interpreting the result themselves, either assisted by HIVST distribution staff or unassisted.6 Recent studies in sub-Saharan Africa, including South Africa, have shown that HIVST is acceptable, feasible and effective in increasing HIV testing uptake,7–9 providing an alternative testing strategy that can overcome sociostructural barriers associated with conventional HTS in a clinic setting, including the stigma associated with accessing testing and limited hours of clinic availability.10
Furthermore, many health services have been disrupted due to COVID-19 as governments across high HIV prevalence countries instituted lockdowns and other forms of restrictions to curb the spread of COVID-19.11 Though many of the restrictions have since been lifted, there remains a concern that with the pandemic still ongoing, people might be reluctant to attend PHC clinics for HIV testing. For this reason, US President’s Emergency Plan for AIDS Relief (PEPFAR) and PEPFAR-supported partners have recently recommended scaling up decentralised access to HIVST.12 Since 2016, the Unitaid-funded Self-Testing AfRica (STAR) Initiative started distributing HIVST kits through a variety of approaches/modalities in Malawi, Zambia and Zimbabwe, and later expanded to eSwatini, Lesotho and South Africa. Coordinated economic analyses alongside this roll-out found that the cost per kit distributed (in 2019 US$) was $8.91 in Malawi, $14.70 in Lesotho, $14.90 in Zimbabwe and $17.70 in Zambia using community-based distribution strategies,13 14 $12.82 in circumcision clinics in Zambia14 and $8.66 in Malawi, $9.15 in Zimbabwe, $5.37 in Zambia and $13.40 in South Africa when kit distribution was integrated into public primary care facilities.15 A cost-effectiveness analysis of an array of community-based distribution approaches and settings in Sub-Saharan Africa showed these can be cost-effective if implementation is targeted based on HIV prevalence and health benefits, and if costs are considered over a relatively long time horizon.16 In our analysis of South Africa’s distribution programme, we found that facility-based distribution modalities had on average higher cost per kit distributed than community-based distribution approaches, which was unlike observations in Zambia and Zimbabwe.17 18
Previous modelling work by our team in 2019 using preliminary cost and effectiveness data on HIVST from other settings, showed that out of ten testing modalities analysed, HIVST combined with home-based testing would have the greatest impact on the proportion of PLHIV who are diagnosed, increasing the fraction of diagnosed PLHIV to 96.5% by 2030 and would be highly cost-effective compared with currently funded HIV interventions.19 More recently, using data on intermediate outcomes such as person screened positive, tested positive in confirmatory testing and initiated on ART from the STAR-supported HIVST roll-out in South Africa, we established that testing strategies which focus on high yield populations such as female sex workers and high-volume distribution modalities such as taxi rank and workplace distribution were more cost-effective than other community-based or any of the facility-based testing strategies.18
This work is an update to our previous work, using data collected under the STAR Initiative to inform both effectiveness and cost parameters in the Thembisa model,1 in order to model the impact and cost-effectiveness of different HIVST distribution modalities over a 20-year time horizon (2020–2039) and, based on these outcomes, determine the highest impact and most cost-effective combination of HIVST distribution modalities in a mathematical optimisation.
Methods
Outcomes
To assess the epidemiological impact of different testing strategies, we used the Thembisa model, a deterministic compartmental model set up to simulate HIV testing in South Africa.20 The model stratifies the population by sex and individual age and further divides the population into a number of sexual behaviour risk groups. Previously, the model simulated three HIV testing modalities: testing through antenatal clinics, testing of patients with opportunistic infections and ‘general’ HIV testing. For each modality, rates of testing uptake are specified by age and sex, based on routine testing data and survey data on the proportions of adults who had ever been tested for HIV.20 21 All individuals are stratified according to their HIV testing history, into one of three compartments: never tested for HIV, previously tested but not diagnosed positive and diagnosed positive. Newly diagnosed individuals are assigned a probability of starting ART in the month of diagnosis, and a lower monthly rate of ART initiation is assumed for those who do not start ART in the month of diagnosis. The model allows for rediagnosis of previously diagnosed individuals, with relative rates of testing in previously diagnosed and treated individuals being set in such a way that the model matches historic trends in HIV testing yields (declining from 25.8% in 2004–2005 to 6.25% in 2018–201922). A more complete description of the model is provided elsewhere.1
For this analysis, we modelled the impact of six HIVST distribution modalities (fixed-point, taxi ranks, workplace, secondary distribution to partners of ART patients at PHC, secondary distribution to partners of pregnant women at PHC, primary PHC distribution using Thembisa). A more detailed description of each modality is provided in the online supplemental appendix table S1, but briefly-fixed-point distribution involves testing tents set up near busy, preselected locations within communities. Taxi rank distribution involves distributing HIVST kits in densely populated public taxi ranks and train stations. Facility-based modalities such as secondary distribution through pregnant women and ART patients focused on the individuals taking the HIVST kits to their partners, while primary PHC is focused on the individual using the HIVST kit for themselves. Workplace distribution involved primary and secondary distribution in large male-dominated workplaces in industries such as manufacturing, mining, construction and so on.
Supplemental material
The impact of HIVST in Thembisa was parameterised using data from the STAR initiative for each of the six modalities that were incorporated into the model, with the exception of primary distribution to PHC (which was conducted by implementing partners and not PHC staff in STAR). Surveys of a subset of 4% of HIVST recipients (n=40 834), conducted telephonically at 2-week, 4-week and 6-week intervals postdistribution, provided information on the numbers of tests used, the age and sex profile of recipients, the self-reported test results (for those test kits that were used) and the proportions of those diagnosed positive who subsequently started ART, for each of the first five HIVST models. For each of these five models, the Thembisa assumptions about the age and sex profile of testers was set to match (approximately) that observed in the STAR data, but because the STAR data are not nationally representative and because HIV prevalence in South Africa is highly heterogeneous, we did not attempt to match the self-reported fraction of HIVST results that were positive (more detailed information is supplied in the online supplemental appendix). Model assumptions about test wastage (distributed HIVST kits which were reportedly not used) were also set to match those observed in the STAR data, although these could not be reliably determined in the case of the secondary distribution models, as many of the interviewed individuals did not know if their partner had actually used the test. A more detailed description of each modality and the self-testing extensions to the model is provided in the online supplemental appendix.
Data for the sixth model, primary distribution to PHC clients, were not based on STAR data as the only models supported by STAR in South Africa were non-integrated (ie, using stand-alone distribution staff rather than clinic staff) and as such not representative of likely routine roll-out. Because we lacked data on the uptake of HIVST in primary PHC, we assumed that the patterns of uptake would be the same as for conventional facility-based HTS, with primary PHC distribution of HIVST effectively replacing a proportion of the HIV testing in PHC. To ensure this distribution modality was representative of how it would be conducted within the PHC, we assumed the same screening positivity as conventional HTS and used the results of previous cost analyses work of conventional HTS at PHC level.19
Model outcomes reported are life years lost due to AIDS, HIV infections averted and AIDS deaths over 20 years (2020–2039). HIV infections are averted both as a result of reduced infectiousness of individuals on ART and an assumed 56% reduction in unprotected sex after HIV diagnosis.1 No specific linkage to prevention services (or change in sexual behaviour) is assumed for people who test negative. Life years lost are calculated with reference to the life expectancies obtained from the West Level 26 lifetable.23
Cost analysis
To aid comparability across countries, the methods for the analysis of cost and outcomes of HIVST distribution through the six modalities were similar to the other economic analyses under STAR and are described in detail in Matsimela et al.18 Briefly, costs were estimated from the provider perspective using a detailed expenditure analysis complemented by activity-based observations (time in motion analysis) and micro-costing and included capital cost items such as start-up training, sensitisation and equipment, as well as recurrent cost items such as personnel, test kits, other supplies, transportation, building operation and maintenance. Research costs and other costs that were only relevant to STAR and not related to routine implementation were excluded. To align the cost of primary HIVST distribution at PHC more closely with services offered within PHC, the cost per test kit distributed through this modality was estimated based on ingredients and prices adapted from previous work.19 Capital costs were annualised over the 2 years’ duration of the project using a 3% discount rate, in keeping with the methods used in other countries.
In order to capture downstream programmatic effects, we modelled the impact of HIVST distribution on the cost and impact of the entire South African HIV programme over a 20-year time horizon; we included, among others, the cost of ART, medical male circumcision, condom distribution, prevention of mother-to-child transmission and conventional HTS with rapid tests through both facility-based and mobile testing modalities.24 Additional information of costs of other interventions included in the HIV programme are shown in online supplemental appendix table S2. Costs are presented undiscounted and converted to 2019 US dollars (US$) using the period average of 14.45 South Africa Rand (ZAR)=1 US$.25
Scenarios
We consulted with a stakeholder panel of experts from the National Department of Health and from research organisations focused on HIVST regarding their expected outlook for HIVST distribution for South Africa beyond the STAR initiative, specifically for distribution through the six different modalities under analysis. The result constitutes our baseline scenario, a status-quo distribution, with 60% of HIVST kits assigned to primary PHC distribution, 20% to workplace distribution, 7% to secondary distribution to partners of women attending antenatal care (ANC) at PHC, 5% through fixed point distribution in communities, 5% to taxi rank distribution and 3% to secondary distribution to partners of ART patients at PHC. For our main analysis, we included two overarching coverage scenarios, defined by the number of HIVST distributed annually. Scenario A assumes that 1 million HIVST kits will be distributed annually, in keeping with the current volumes of programme implementation, while Scenario B represents a target volume, scaling up to a maximum of 6.7 million HIVST kits distributed annually by 2030 (equivalent to replacing 40% of conventional HTS). The consultation also resulted in choosing a target population for each of the six HIVST distribution modalities as well as a ‘feasible maximum’, that is, a maximum number of people in each target population who can feasibly be screened for HIV with HIVST (see online supplemental appendix table S1).
Cost effectiveness analysis
To calculate the incremental cost-effectiveness of each HIVST distribution modality in turn, we assumed that 100% of available HIVST kits would be distributed through one of the six distribution modalities in turn, for both coverage scenarios A and B. We estimated the incremental cost of HIVST as the change in the cost of the entire HIV programme and calculated the incremental cost per HIV infection averted, cost per life year saved and cost per AIDS death averted over the 20-year time period, incremental to the status quo distribution of 1 million HIVST.
Optimisation
We used a fractional factorial design to determine the optimal set of configurations between the different HIVST distribution modalities, resulting in the largest epidemiological impact and the most cost-effective configuration. This analysis was performed under both coverage scenarios A (1 million HIVST kits annually) and B (6.7 million HIVST kits annually), where we modelled all possible combinations of modalities at set increments, constrained only by the feasible maximum number of target population members reached in each modality. We compared all model runs to the status quo distribution of 1 million HIVST annually. We present different distributions across the different HIVST modalities and the impact on life years saved (LYS) and corresponding cost-effectiveness. Additional results regarding the impact on HIV infections averted are presented in the online supplemental appendix figures S1 and S2. We additionally compared the optimal distribution of HIVST in Scenario B to a scenario where the current status quo distribution of test kits was scaled up to meet the 6.7 million HIVST target. Additional analyses for both scenarios A and B were conducted in which the baseline scenarios containing no HIVST are given in the online supplemental appendix figures S3 and S4.
Patient and public involvement
Patients were not directly involved in this study; this analysis was conducted using data derived from a previous study.18
Results
Outcomes
Scenario A
After accounting for uptake, the number of HIVST kits used ranges between 0.5 and 1.0 million kits across the six modalities (table 1). Compared with the status quo distribution of HIVST (table 1), primary distribution of all 1 million HIVST kits annually through PHC was dominated, due to the lower positivity yields compared with the HIVST modalities included in the status quo distribution, increasing new HIV infections and life years lost due to AIDS over 20 years (depicted as negative infections averted or LYS) (table 2). The distribution strategy with the highest epidemiological impact with respect to saving life years, compared with the status quo, was distributing all HIVST kits to partners of PHC ART patients, which saved 119 000 (0.3%) life years. All remaining distribution modalities (fixed point, taxi ranks, secondary distribution to partners of ANC clients, workplaces) were more effective than the status quo distribution and were estimated to save between 40 000 and 63 000 (0.1%–0.2%) life years and averted 9000–28 000 (0.4%–1.1%) HIV infections over 20 years.
Description of modelled HIVST distribution modalities
Impact of HIVST distribution modalities on HIV infections, life years lost due to AIDS and incremental cost (2019 US$) on the HIV programme, over 2020–2039, compared with a baseline status quo distribution of 1 million HIVST annually
Scenario B
When scaling up the number of HIVST to 6.7 million kits distributed annually by 2030, exclusive primary distribution to PHC clients was dominated (table 2). Secondary distribution through PHC ART patients had the highest impact, saving 393 000 (1.1%) life years and averting 112 000 (4.3%) new HIV infections over 20 years (table 2), while fixed point and workplace distribution modalities had a moderate impact (205 000; 0.6% and 156 000; 0.4% LYS, respectively). Distributing all kits through taxi ranks and partners of ANC clients had the least impact of all distribution modalities (98 000; 0.3% and 66 000; 0.2% LYS, respectively).
Costs
Scenario A
Due to the lower cost per test kit distributed, workplace distribution was estimated to be cost-saving compared with the status quo, saving an estimated $76 million over 20 years (table 2). HIVST distribution to partners of PHC ART patients and ANC clients were the most costly of the distribution strategies ($166 million each over 20 years), while distribution through taxi ranks and fixed point distribution had an incremental cost to the HIV programme of $9 million and $44 million, respectively.
Scenario B
Compared with the status quo, distribution of 6.7 million HIVST kits through workplaces was cost-saving ($52 million over 20 years) (table 2). Distributing all HIVST kits through other modalities was more costly compared with the status quo, having an estimated incremental cost ranging between $198 million (for taxi ranks) and $1.6 billion (for distribution to partners of ART patients) over 20 years.
Cost-effectiveness
Scenario A
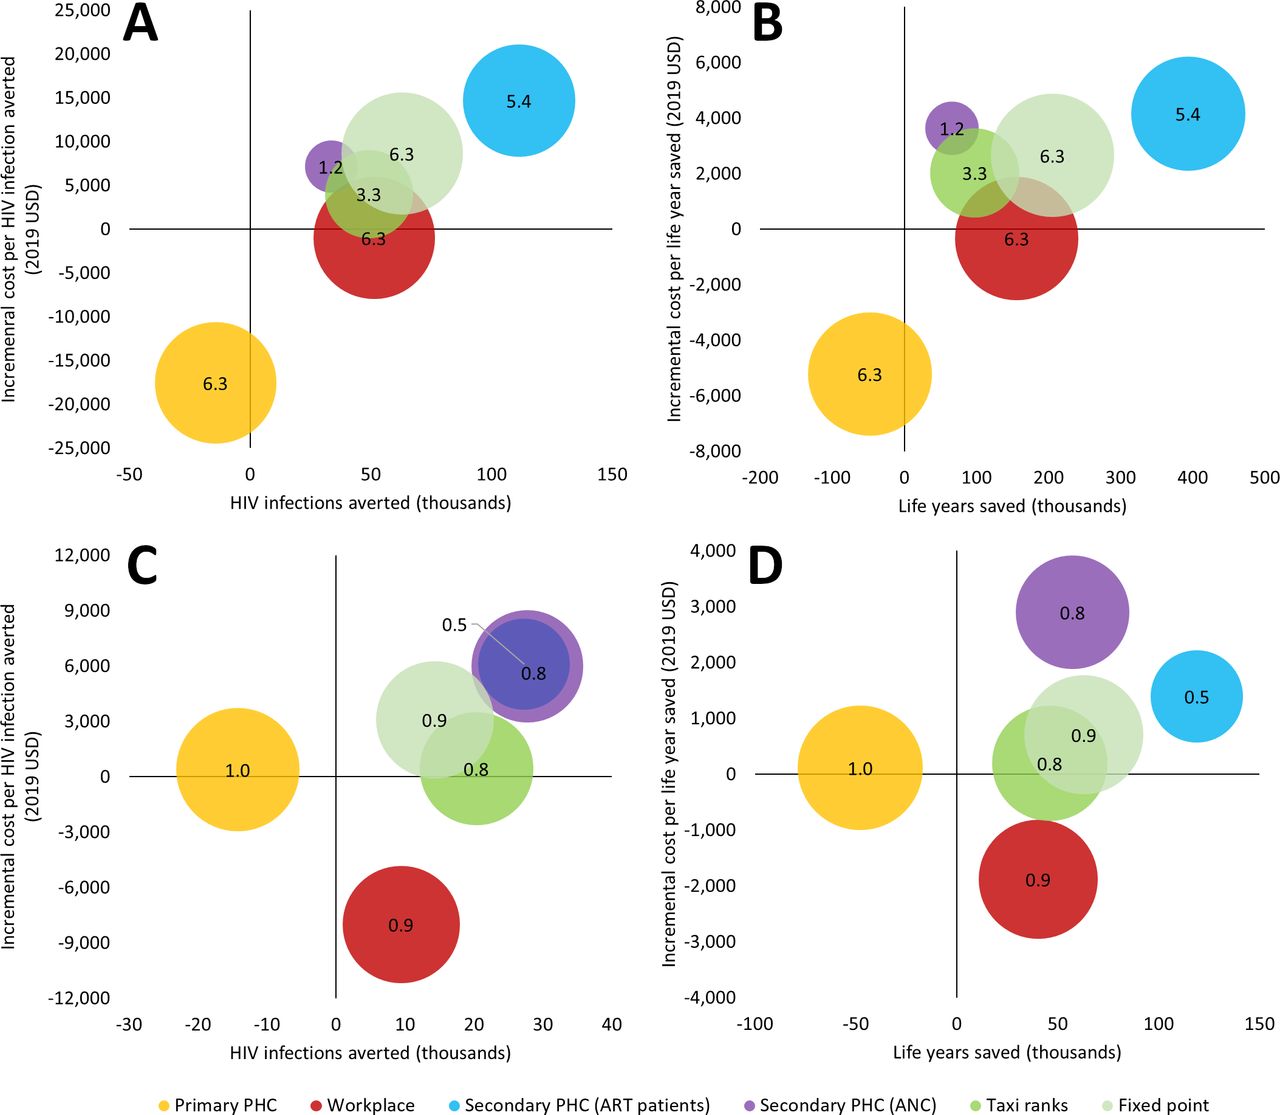
With the exception of workplace distribution, which was cost-saving, the HIVST distribution modality with the lowest incremental cost effectiveness ratio (ICER) over 20 years was distribution through taxi ranks ($194/life year saved and $438/HIV infection averted) (figure 1, table 2). Fixed point distribution was the second most cost-effective ($705/life year saved and $3092/HIV infection averted), while secondary distribution through ART patients and ANC clients were the least cost-effective distribution modalities ($1394 and $2899/life year saved, respectively) (table 2).

Impact and cost-effectiveness of redistribution all HIVST to different testing strategies, 2020–2039. For distributing 1 million HIVST annually, impact on HIV infections averted (A) and life years saved (B); for distributing up to 6.7 million HIVST annually, impact on HIV infections averted (C) and life years saved (D). Bubble size represents the number of HIVST distributed to each population annually. HIVST, HIV self-testing.
Scenario B
Increasing distribution of HIVST kits up to 6.7 million and directing it all to taxi ranks had the lowest ICER relative to the other distribution modalities, compared with the status quo ($2030/life year saved and $4019/HIV infection averted), whereas secondary distribution to partners of ANC clients and ART patients at PHC were the least cost effective ($4162/life year saved and $14 688/HIV infection averted) (figure 1, table 2). The relative cost-effectiveness of secondary distribution to partners of ANC clients differed from scenario A as these clients were limited to a feasible maximum limit of 1.2 million people who could receive HIVST, thereby curtailing the incremental cost and impact overall.
Optimisation
Scenario A
Distributing the majority (IQR 38%–63%) of the 1 million HIVST kits through workplaces led to cost savings over 20 years, compared with the status quo distribution; LYS was estimated to range between 100 and 24 000 (figure 2A). Beyond the cost-saving configurations, ICER/LYS was lowest when a large portion of HIVST kits were distributed to workplaces (IQR 13%–38%), while there was a mixed distribution for the other modalities: IQR 0%–38% each for fixed point and taxi rank distribution, IQR 0%–25% each for secondary distribution to partners of ART patients and primary distribution to PHC clients, while secondary distribution to partners of ANC clients had the lowest allocation (IQR 0%–13%) (figure 2B). The biggest epidemiological impact resulted from distributing the majority of HIVST (IQR 50%–75%) to partners of ART patients (ranging between 32 000 and 46 000 LYS), and these configurations were in the higher range of ICERs with an IQR of $2100–$2600 per life year saved (figure 2B). Configurations of HIVST distribution relying mainly on secondary distribution to partners of ANC clients (IQR 25%–63%) or primary PHC distribution (13%–50%) were the least cost-effective, with ICERs upwards of $4000 per life year saved, and even dominated (if 60% or more of HIVST was distributed to primary PHC) (figure 2B). Similar patterns were obtained when using HIV infections averted as an outcome (online supplemental appendix figure S1).

(A) Number of life years saved over the status quo and (B) incremental cost-effectiveness ratio, incremental cost per life year saved (2019 US$), distributing up to 1 million HIVST distributed per year. Status quo: 1 million HIVST distributed to fixed point (5% of HIVST), taxi ranks (5%), secondary PHC (ANC) (7%), secondary PHC (ART patients) (3%), workplace (20%) and primary PHC distribution (60%). ANC, antenatal care; ART, antiretroviral therapy; HIVST, HIV self-testing; PHC, primary healthcare.
Scenario B
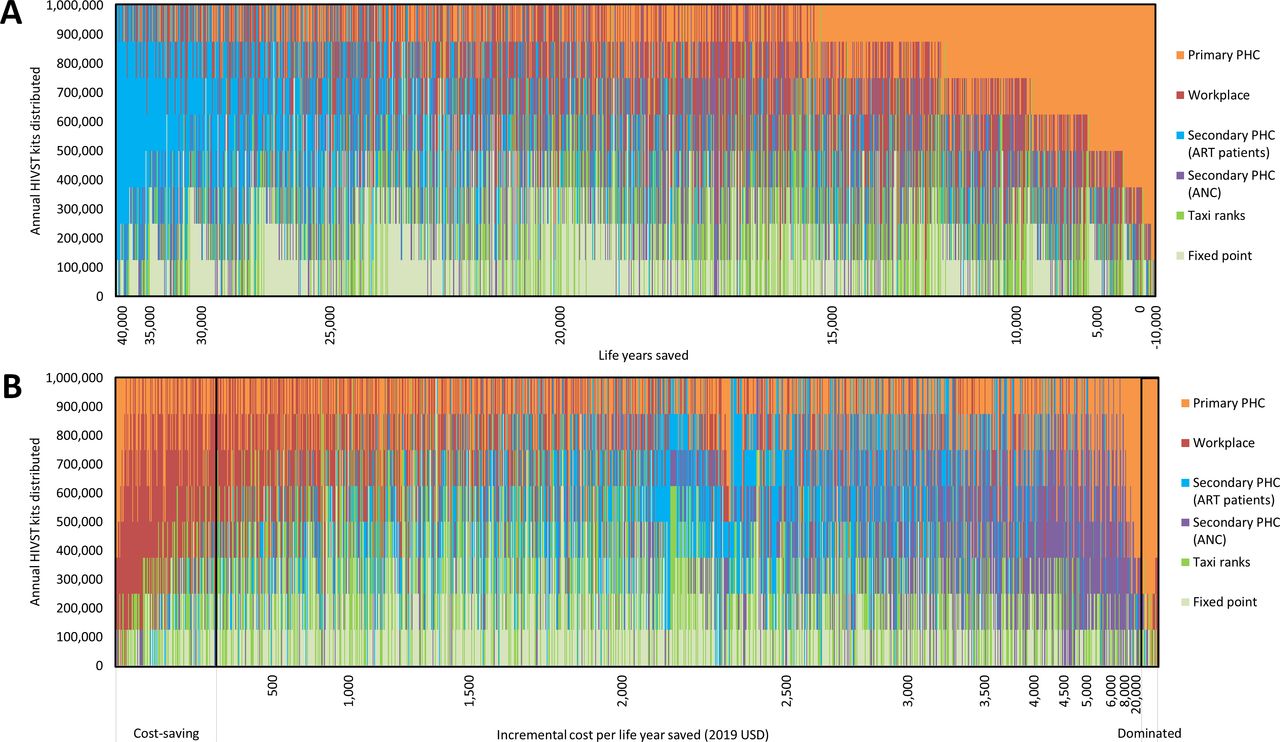
In comparison to the status quo distribution of 1 million HIVST kits distributed annually, if scaled up to 6.7 million HIVST annually, the largest impact was achieved when most HIVST kits (IQR 55%–64%) were distributed to partners of ART patients, saving between 200 000 and 241 000 life years over 20 years, while ICERs for these configurations ranged between $2400 to $4300 per life year saved (figure 3A,B). Using the set of configurations that result in the median impact as the optimal distribution strategy, the optimal HIVST kit distribution would look as follows: 64% to partners of ART patients, 9% each epidemiological fixed point, taxi ranks and workplaces and none to partners of PHC ANC clients and primary PHC clients. Compared with the status quo distribution of 1 million HIVST annually, an optimised scale-up of distribution to 6.7 million tests annually would result in an almost threefold increase in LYS compared with the same volume scale-up at the current status-quo distribution (table 2) (216 000 vs 75 000 LYS), and it would have a lower ICER ($3990 vs $4493 per LYS). Distribution to workplaces was cost-saving only when 100% of all HIVST were distributed through this modality, and it had a moderate impact: saving 137 000 life years over 20 years (figure 3). The distribution strategies with the lowest ICER/LYS were those where majority of HIVST kits were distributed to workplaces. Distributing more than 50% of HIVST kits to primary PHC showed the least impact relative to other configurations (<100 000 LYS), and it was the least cost-effective strategy, with ICERs upwards of $4000 per LYS (figure 3A,B). We see similar patterns when analysing the impact on HIV infections averted (online supplemental appendix figure S2).

(A) Number of life years saved over the status quo and B) incremental cost-effectiveness ratio, incremental cost per life year saved (2019 US$), distributing up to ~6.7 million HIVST per year by 2030. Status quo: 1 million HIVST distributed to fixed point (5% of HIVST), taxi ranks (5%), secondary PHC (ANC) (7%), secondary PHC (ART patients) (3%), workplace (20%) and primary PHC distribution (60%). *Indicates single configuration where results are cost-savings (ie, 100% distribution to workplaces). ANC, antenatal care; ART, antiretroviral therapy; HIVST, HIV self-testing; PHC, primary healthcare.
Comparing against a baseline of no HIVST
In scenario A, when comparing against a baseline with no HIVST, we see similar patterns of distribution configurations where HIVST distributed mainly to partners of ART patients produced the largest epidemiological impact (ranging 75 000–93 000 LYS), while ICERs are upwards of $2000 per LYS (online supplemental appendix figure S3). HIVST distributed mostly (>50%) through secondary distribution to partners of ANC clients was the least cost-effective strategy with the highest ICERs among all configurations. Distributing most HIVST (>40%) to workplaces is the most cost-effective strategy, with ICERs falling below $1100 per life year saved (online supplemental appendix figure S3). When scaling up to 6.7 million HIVST kits distributed annually, compared with a baseline with no HIVST, distribution to partners of ART patients was the strategy that yielded the largest impact (>235 000 LYS), although it had high ICERs relative to the other configurations (>$3200/life year saved) (online supplemental appendix figure S4). Primary PHC distribution was the least cost-effective (>$4000/life year saved) and least impactful strategy (<165 000 life year saved). Workplace distribution was the most cost-effective strategy (ICER <$2000/life year saved) but had a moderate epidemiological impact, ranging between 170 000 and 200 000 LYS (online supplemental appendix figure S4).
Discussion
The distribution of HIVST kits is expected to have a large impact on averting new HIV infections and AIDS deaths over 20 years, compared with a baseline status quo where HIVST kits were already distributed through different modalities with a set distribution pattern (60% to primary PHC, 20% to workplaces, 7% to secondary distribution to partners of ANC clients in PHC, 5% to taxi ranks, 5% to fixed point and 3% to secondary distribution to partners of ART patients). Importantly, we have shown the importance in determining the optimal configuration of testing modalities as HIVST scales up. An optimisation-informed scale-up—instead of proportionally scaling-up the current distribution of HIVST testing modalities—is expected to nearly triple the number of LYS. Redirecting all HIVST towards any distribution strategy other than primary PHC performs better in terms of saving life years and averting HIV infections over 20 years than the planned status quo; however, results vary in terms of costs and cost effectiveness. We showed that secondary distribution to partners of ART patients will have the biggest epidemiological impact but will be the least cost-effective strategy due to its high cost, while distribution of HIVST to workplaces will be cost-saving but have only a moderate impact on averting HIV infections. Distribution to primary PHC is not cost-effective due to the lower HIV positivity yielded and may even be dominated compared with other distribution strategies.
There are several limitations to this work. First, cost data for the different distribution strategies were based on an initiative that was managed and implemented by non-governmental organisations, and therefore both cost and screening positivity could change once introduced and managed in the public sector. Second, for primary PHC testing, we assumed the same screening positivity as conventional HTS. It is plausible that screening positivity could be higher if implemented in the real world as PHC clients concerned about their HIV status might prefer self-screening over conventional HTS within the clinic setting to avoid stigma or have more control over the testing procedure. However, we do posit the screening positivity of primary PHC to remain lower than those of the higher performing distribution strategies, and indeed this was shown to be the case in the vertical, non-integrated PHC testing strategy included in Matsimela et al.18 Third, the model estimates of HIV testing yields were in some cases inconsistent with those reported in the STAR data, suggesting that matching the age and sex profile of HIV test recipients may be insufficient to reasonably capture the different HIV risk profiles associated with different testing modalities. However, the STAR data are not nationally representative, and implementation has not been uniform, with different HIVST modalities being piloted in different areas by different implementers. Some divergence between observed testing yields and yields estimated in a national model is therefore to be expected, and it will be important to continue to monitor testing yields as different HIVST modalities are scaled up nationally.
Future work on HIVST should include the evaluation of the different testing strategies once scaled up in the public health system to understand the real cost and screening positivity. The positivity rate may decline differentially between testing modality as demand saturates, and therefore understanding the optimal timing and frequency of testing by modality will need to continue in order to help guide effective implementation.
Conclusion
In evaluating the impact and cost-effectiveness of different HIVST distribution modalities using a HIV transmission model and data collected alongside large-scale routine implementation under the STAR initiative, we were able to generate findings that could help inform policy makers making decisions on the most effective strategy to prioritise for national roll-out: the secondary distribution of HIVST to partners of ART patients. However, this will be a costly approach. The optimal distribution of HIVST is estimated to be a mix between secondary distribution of HIVST kits to partners of ART patients and pregnant women in care at PHC, workplace testing and fixed point HIVST distribution. Further, in the face of the global COVID-19 pandemic affecting all health services, including HIV testing, scaling up HIVST in order to limit patient contact with health services and providing an option of self-screening to those reluctant to attend a PHC clinic, would assist greatly in maintaining or increasing progress towards testing targets.
Data availability statement
Data are available on request. Data will be made available on request.
Ethics statements
Patient consent for publication
Supplementary materials
Supplementary Data
This web only file has been produced by the BMJ Publishing Group from an electronic file supplied by the author(s) and has not been edited for content.
Footnotes
Handling editor Edwine Barasa
Twitter @ccasejohn, @brookenichols
Contributors LJ and GM-R conceptualised the study. LFJ developed the epidemiological model. LJ did the analysis and drafted the manuscript. LJ, GM-R and LFJ contributed to the interpretation of the results. All authors contributed to the interpretation of the results, revision and approval of the manuscript.
Funding This analysis was funded through the grant “Enhancing the evidence-base of HIV self-testing for young men” (BMGF OPP1189095) to Ezintsha, a division of Wits RHI, and HE2RO.
Competing interests None declared.
Provenance and peer review Not commissioned; externally peer reviewed.
Supplemental material This content has been supplied by the author(s). It has not been vetted by BMJ Publishing Group Limited (BMJ) and may not have been peer-reviewed. Any opinions or recommendations discussed are solely those of the author(s) and are not endorsed by BMJ. BMJ disclaims all liability and responsibility arising from any reliance placed on the content. Where the content includes any translated material, BMJ does not warrant the accuracy and reliability of the translations (including but not limited to local regulations, clinical guidelines, terminology, drug names and drug dosages), and is not responsible for any error and/or omissions arising from translation and adaptation or otherwise.