Article Text

Abstract
Introduction The majority of low-income and middle-income countries (LMICs) have incomplete death registration systems and so the proportion of deaths that occur at home (ie, home death percentage) is generally unknown. However, home death percentage is important to estimate population-level causes of death from integration of data of deaths at home (verbal autopsies) and in hospitals (medical certification), and to monitor completeness of death notification and verbal autopsy data collection systems. This study proposes a method to estimate home death percentage using data readily available at the national and subnational level.
Methods Data on place of death from 152 country-years in 49 countries from 2005 to 2019, predominantly from vital registration systems, were used to model home death percentage standardised for population age and cause distribution. A national-level model was developed using Bayesian model averaging to estimate national, regional and global home death percentage. A subnational-level model was also developed and assessed in populations where alternative data on home death percentage were available.
Results Globally, it is estimated that 53.4% (95% uncertainty interval (UI) 50.8%–55.9%) of deaths occur at home, slightly higher (59.7%, 95% UI 56.5%–62.7%) in LMICs, substantially higher in low-income countries (79.5%, 95% UI 77.3%–81.5%) and much lower (27.3%, 95% UI 25.2%–29.6%) in high-income countries. Countries with the highest home death percentage are mostly found in South, East and Southeast Asia and sub-Saharan Africa (above 90% in Ethiopia, Chad and South Sudan). As expected, the national model has smaller error than the subnational model.
Conclusion The study demonstrates substantial diversity in the location of deaths in LMICs and fills a significant gap in knowledge about where people die, given its importance for health systems and policies. The high proportion of deaths in LMICs that occur at home reinforces the need for routine verbal autopsy to determine the causes of death.
- indices of health and disease and standardisation of rates
- medical demography
- public health
- health systems
Data availability statement
Data are available in a public, open access repository. Data used in the study are located here: https://figshare.com/s/e18acdff54a23858181f Code used to generate the findings are located here: https://figshare.com/s/8cf7a6ebb84c3af4bc33
This is an open access article distributed in accordance with the Creative Commons Attribution Non Commercial (CC BY-NC 4.0) license, which permits others to distribute, remix, adapt, build upon this work non-commercially, and license their derivative works on different terms, provided the original work is properly cited, appropriate credit is given, any changes made indicated, and the use is non-commercial. See: http://creativecommons.org/licenses/by-nc/4.0/.
Statistics from Altmetric.com
- indices of health and disease and standardisation of rates
- medical demography
- public health
- health systems
Key questions
What is already known?
It has been reported that most of the deaths in low-income and middle-income countries (LMICs) occur at home.
However, there is uncertainty about what percentage of deaths occur at home in most LMICs because mortality data are incomplete and no previous study has systematically estimated this for all countries.
What are the new findings?
The study estimates that 60% of deaths in LMICs occur at home, compared with 27% in high-income countries.
There is considerable variation in percentage of deaths occurring at home in LMICs, being highest in countries in South, East and Southeast Asia and sub-Saharan Africa.
What do the new findings imply?
The high proportion of deaths in LMICs that occur at home highlights the importance of routine verbal autopsy to determine the causes of death in these settings.
The subnational model presented in the study can be used by analysts to estimate the percentage of deaths in local populations that die at home.
The estimates and models presented can aid monitoring of death notification and verbal autopsy interventions and enable estimation of population-level causes of death using data for hospital and home deaths, which can be used to track Sustainable Development Goals.
Introduction
In most low-income and middle-income countries (LMICs), reliable determination of causes of death in the population is a major challenge. There is often no or poor quality cause of death data because the majority of deaths occur in the home, often with minimal or no contact with medical services.1 Those deaths that occur in hospitals also commonly have poor quality cause of death data due to suboptimal quality medical certification practices.2 3 Recent interventions in civil registration and vital statistics (CRVS) systems have focused on verbal autopsy (VA) methods to estimate cause-specific mortality fractions (CSMFs) for deaths that occur at home and where ascertainment of the cause of death by a physician using a medical certificate of cause of death is not possible.1 In parallel, there has been an increased focus on improving the quality of medical certification of causes of deaths in hospitals.2
Recently, a method has been proposed to integrate cause of death data from VA for home deaths and medical certification for hospital deaths to estimate CSMFs for a population and hence measure national and international health indicators, including for the Sustainable Development Goals.4 This method relies on estimation of the number and proportion of deaths that are estimated to occur at home and in hospital, so that CSMFs for home (ie, from VAs) and hospital (ie, from medical certification) deaths can be appropriately weighted to produce population cause of death estimates. However, knowledge of the fact of death (ie, all-cause mortality) is challenging because such data in LMICs are commonly incomplete due to poor quality death notification and registration within CRVS systems, for which several interventions have been introduced to address.1 5 Where mortality reporting is incomplete, methods exist to estimate the extent of (in)completeness and hence the likely total number of deaths that occur each year in the population.6 Despite this, incomplete mortality reporting greatly complicates efforts to combine CSMFs from both VA and medical certification data to generate national mortality and cause of death estimates, because the proportion of unreported deaths that occurred in hospitals or at home is generally unknown.4 While some form of hospital death reporting is operational in almost all countries, not all hospitals in a given area will routinely report their inpatient deaths to a central authority, or if they do, not all deaths may be reported. For example, in Papua New Guinea, larger hospitals do not report deaths to the Ministry of Health District Health Information System every year, and smaller health facilities commonly have dramatic fluctuations in the number of deaths reported each year which result from inconsistent reporting.7 Hence, it is possible or even likely that unreported deaths comprise deaths that occurred both in hospitals and at home, but with their composition unknown.
To increase the policy value of incomplete mortality data sets, it is important to know reliably the proportion of deaths that occur in hospitals as well as at home. This would increase confidence in the interpretation of statistics derived from application of the method to integrate CSMFs from both VA and hospital mortality data to produce population-level cause of death estimates required for monitoring progress with health goals. Additionally, this information could also be used to monitor and improve the completeness of death notification and VA data collection systems (ie, the proportion of home deaths for which a death has been notified or a VA has been conducted) which in turn would increase the policy value of CRVS and VA data.4 Furthermore, knowledge of where people die is, of itself, valuable information for policymakers to understand the interaction of people with health facilities immediately before death. Somewhat surprisingly, very little is known, or at least published, about the proportion of deaths in LMICs that occur at home. Typically, it has been reported that ‘most’ of the deaths in LMICs occur at home, but with no further information on the precise fraction, nor the distribution by age, sex and cause.8 Previous studies have focused on high-income countries, where only a minority of deaths occur in the home.9–11
To address this critical information gap, this study proposes a method to estimate the percentage of deaths in a population that occur at home (ie, home death percentage), using data readily available at the national and subnational level, thus enabling countries to better understand the distribution of the place of occurrence of deaths in their population. The applicability of the method at the subnational level is validated against observed data. The method is also applied to all countries to provide a comprehensive estimate of the fraction of deaths that occur at home for each country, globally and by broad income group.
Methods
Data on place of death from 49 countries from 2005 to 2019, of which 28 are classified as LMICs by the World Bank, were identified from a search of country national statistical office and ministry of health websites and academic literature and compiled into a database.12 The database only comprises countries reporting at least 75% of deaths which are estimated to have occurred in a given year and which report the place of each death, determined using the empirical method for assessing death registration completeness.6 The 75% completeness threshold was chosen as a compromise between ensuring the representation of LMICs, which commonly do not report all deaths, and the expectation that completeness below this level would result in place of death data that are biased due to significant under-reporting. As a result, data for the majority of LMICs could not be included in the model development. Data sources mostly comprise vital registration or, for many high-income countries, figures reported by Broad et al (online supplemental file: Data sources).9 Other sources of data included household surveys in Mozambique and Nepal and, in Papua New Guinea, estimates of the percentage of deaths occurring in facilities and total deaths from a separate study.13–15 Sources that only report mortality from hospitals and not from other locations were not used, because there is no reliable means of estimating completeness of these data sets, unlike for national death registration or reporting systems for which such methods are available.6 A maximum of 5 years of data per country was used (the five most recent years available) to ensure countries with large number of years of data do not disproportionately affect results. This resulted in 152 country-years of data. Countries for which data were included in the database are listed in table 1, grouped into World Bank Income groups and Global Burden of Disease (GBD) regions (online supplemental file: GBD region classification).12 16
Supplemental material
Countries and years in database, by World Bank income group and region
The quantity of interest to estimate is home death percentage, which is defined as the number of deaths occurring at home (excluding deaths in residential aged care or nursing homes) divided by the total number of deaths. While the vast majority of deaths in all populations occur either in hospitals/health facilities or at home, a small percentage of deaths occur elsewhere, primarily in public locations, mostly due to road traffic accidents and homicides. These deaths were excluded from home deaths because these cases are typically subjected to separate medico-judicial enquires rather than a VA. In the database, the country with the largest percentage of deaths occurring in public places was Ecuador (with place of death reported as ‘other’ for 7% of deaths); other countries with high public location fractions, primarily due to homicides, include Brazil (5%) and Colombia (4%). Four countries only report hospital and non-hospital deaths (Sri Lanka, Panama, Thailand and Botswana)—in the absence of any other information, all non-hospital deaths were assumed to be home deaths.
Differences in the percentage of home deaths between countries are likely to be biased by differences in the age and cause composition of deaths. Hence, it was required to standardise the home death percentage by age and cause (online supplemental file: Further description of models). The predictors of the logit of the age-cause-standardised home death percentage were modelled at the national level using Bayesian model averaging (BMA), using the bma command in Stata/SE V.16.0.17 18 BMA involves estimation of a regression model that accounts for uncertainty in selection of covariates. The final coefficients based on BMA are estimated as the average of estimates based on all possible models, weighted by the strength of each model in predicting home death percentage. This circumvents a key issue with conventional regression models of having to choose one model with specific covariates. This method is particularly suitable for this study, given there are several possible covariates, representing health system, geographical and socio-economic characteristics, that are expected to affect the national home death percentage. The health system covariates used were the log of health expenditure per capita (current, 5-year and 10-year average),19 the GBD’s Universal Healthcare (UHC) effective coverage index,20 and the percentage of births that occur at home (current and average of last two reported figures).21–23 The socio-economic covariates used were the GBD’s Socio-Demographic Index (SDI)24 and the United Nation’s Human Development Index education index (as a measure of mean years of schooling) and income index, and the geometric mean of these two indexes.25 The geographical covariates used were the percentage of the population living in urban areas26 and the region in which the country is located (see table 1). Further detail of the covariates and their inclusion in the BMA is provided in the online supplemental file: Covariates used in the models.
Model performance was only assessed using the estimated home death percentage in LMICs, and not in high-income countries as well, since these are the locations where the models are most likely to be applied. Using this model, the home death percentage was estimated for every country in 2019 (including 95% uncertainty intervals (UIs)), except for those countries in the database for which the most recent year was 2010 or later (and for which 95% UIs were calculated assuming a binomial distribution). When using the models to predict home death percentage in North America and Central Asia, the coefficient for Europe was used because those regions were not represented in the models. The home death percentage (and 95% UIs) was estimated for each level of the World Bank’s income groupings, each region and also globally.
A subnational model was also developed to predict variations in home death percentage within countries, recognising the limited covariates commonly available at the subnational level across different countries. Subnational applications of estimated home deaths are likely to be particularly useful in monitoring the success of death notification and VA data collection strategies, particularly in rural and remote areas. To do so, the logit of the age-standardised home death percentage was modelled (online supplemental file: Further description of models). Only covariates commonly available at the subnational level could be included, such as the percentage of births that occur at home and urbanisation. Also included was the national level variable of log health expenditure per capita (10-year average), as well as the region the country is located in. BMA was not used for this model because only one of the auxiliary covariates was included at the national level. This subnational model was developed using the same national database as before.
To assess the performance of the subnational model against observed data, home death percentage was estimated for 100 subnational areas of 13 countries (online supplemental file: Data sources). For nine subnational areas in seven countries, estimates are compared with data from health and demographic surveillance system (HDSS) sites and a Sample Vital Registration with Verbal Autopsy study, where death reporting is assumed to be close to complete, and that are located in sub-Saharan Africa, which is under-represented in the database, and Bangladesh. The remaining 91 subnational areas in six countries are subnational data of countries in the database.
Results
National model
Table 2 presents the final estimates of coefficients from the BMA modelling. Urbanisation, a stronger health system and higher socio-economic status (overall) predict a lower home death percentage, as might be expected. Of the health system variables, both average and current home birth delivery percentage are positively related with home death percentage, with the latter having a larger coefficient. Each of the three measures of health expenditure per capita and UHC are negatively related with home death percentage, with stronger coefficients for average expenditure than current expenditure and UHC. SDI, income, education and the geometric mean of income and education are also negatively related with home death percentage. Of the regions, compared with Andean Latin America, Tropical Latin America, South Asia, sub-Saharan Africa and Oceania predict lower home death percentage while East Asia and Southern Latin America predict higher home death percentage.
National model of age-cause standardised home death percentage
Estimates of the home death percentage for LMICs in the data set are presented in table 3, and for all country-years (online supplemental table 1). The root mean squared error (RMSE) of the final estimates in LMICs is 6.2% points, with a mean absolute error (MAE) of 4.6% points. For 64% of country-years the prediction error around the estimate was less than 5% points, and in 88% of countries the error was less than 10% points. Notably, there is relatively high divergence of the estimated from observed all-age home death percentage in countries where the estimated figure is between 25% and 40%. These countries include Argentina and Colombia (where the model overestimates home death percentage) and Botswana, Mexico and Malaysia (model underestimates). At the highest levels of observed home death percentage, where there is lowest representation of countries in the data set, the model appears to be relatively accurate (Papua New Guinea, Nepal, China and Mozambique), with an error within 5% points.
Estimated and observed all-age home death percentage, low-income and middle-income countries, most recent year in the data set
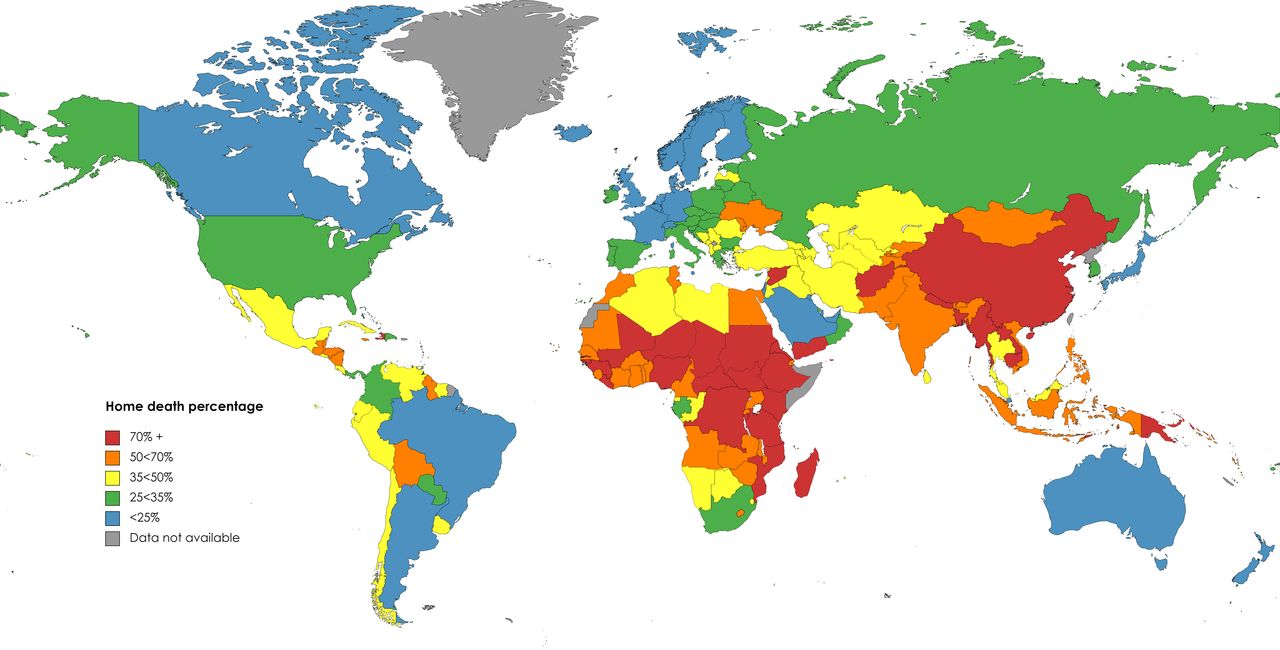
Next, the model was applied to estimate the home death percentage in all countries. The results are given in table 4 and online supplemental table 2, including the observed figure for countries in the data set. Globally, it is estimated that 53.4% (95% UI 50.8%–55.9%) of deaths occur at home, slightly higher (59.7%, 95% UI 56.5%–62.7%) in low LMICs and substantially lower (27.3%, 95% UI 25.2%–29.6%) in high-income countries. As expected, the fraction of home deaths is much higher (79.5%, 95% UI 77.3%–81.5%) in low-income countries. Figure 1 shows that countries with the highest home death percentage are mostly found in South, East and Southeast Asia and more northern parts of sub-Saharan Africa. Lower home death percentage is found in countries in Western Europe, South America (eg, Brazil and Argentina), high-income Asia-Pacific and North America.
Estimated and observed home death percentage by income group and country*, 2019
Map of home death percentage* by country, 2019. *Based on estimated and observed home death percentage in online supplemental table 2. In some locations home death percentage could not be estimated because data were not available for all covariates in the model. Map created using mapchart.net.
More than 90% of deaths are estimated to occur at home in the sub-Saharan African nations of Ethiopia (91.2%), Chad (92.3%) and South Sudan (90.7%), and more than 80% in Niger, Sudan, Guinea, Eritrea, Madagascar and Central African Republic. There are also high levels of home death percentage in other regions, estimated to exceed 80% in Myanmar (Southeast Asia), Afghanistan (Middle East and North Africa), Yemen (Middle East and North Africa) and Haiti (Caribbean). Among countries with most deaths, India is estimated to have 53.2% (95% UI 39.1%–67.0%) of deaths occurring at home, Indonesia 59.2% (95% UI 45.6%–71.8%), Nigeria 75.0% (95% UI 64.3%–83.8%) and Pakistan 61.2% (95% UI 48.3%–73.1%).
Subnational model
The predictions from the subnational model were compared with the observed home death percentages for subnational areas of 13 countries for which meaningful data were available (table 5, model coefficients in online supplemental table 3). The model itself is, as expected, slightly weaker than the national model as measured by the RMSE and MAE (online supplemental table 3). The MAE when applied to these subnational areas was 7.3% points. The MAE was higher in the nine subnational areas without national data in the database (9.3% points) than in those with national data (7.1), where the MAE was over double that of the national estimates (3.3). This is to be expected given that the available covariates at the subnational level are unlikely to capture the impact of all relevant deterministic factors, nor how they vary subnationally. Thirty-three of 100 subnational locations have an error at least 10% points. Among the nine subnational locations where there are no national data in the database, the model overestimates home death percentage in all but one location, by more than 15% points in Kilifi HDSS, Kenya and Dande HDSS, Angola, and less than 2% points in Korogwe HDSS, Tanzania and Kilite-Awlaelo HDSS, Kenya. The model performed poorest in Guatemala, where the MAE is 9.2% points, with the error reaching 22.9% points in Jalapa department. The lowest MAE is found in Papua New Guinea (5.2% points). Full results are shown in online supplemental table 4.
Mean absolute error (MAE) of estimated home death percentage at the subnational level, 13 countries
Discussion
Understanding how the fraction of deaths that occur at home varies across and within countries can be of enormous relevance for tracking the implementation of health system and health information system initiatives, including the introduction of death notification and VA initiatives to improve cause of death information, particularly for rural populations, as well as for generating population-level cause of death statistics that combine VA and hospital data and can be used to measure national and international indicators, including for the Sustainable Development Goals. In this study models have been developed for estimating the national and subnational home death percentage for countries where there is incomplete death reporting or where the place of death is not available for all deaths. It is estimated that about 60% of deaths in LMICs occur in the home, ranging from 80% in low-income countries to 56% in upper-middle income countries. The highest levels of home death percentage are found in countries in the northern areas of sub-Saharan Africa and in South, East and Southeast Asia. For individual countries, it ranges from 20% in Brazil to over 90% in Chad, Ethiopia and South Sudan, demonstrating the enormous diversity in the location of deaths among LMICs. This is the first study to systematically estimate home death percentage using comparable methods, filling a significant gap in knowledge about where people die, given the importance of this information for health systems and policies.
The model to estimate the national home death percentage is likely to be sufficiently reliable in most countries, based on validation metrics, for what in many cases would be its two primary purposes: to inform the amalgamation of hospital and home death CSMFs to generate population-level CSMFs for the whole country and to monitor the completeness of VA death reporting. The performance characteristics of the model, with a MAE of 4.6% points, 88% of country-years with an error of less than 10% points and national estimates for countries outside the data set having 95% UIs of an average ±12% points, are all likely to be sufficiently accurate for guiding programme implementation. The variables most closely associated with age-cause-standardised home death percentage include the percentage of births that are delivered at home and urbanisation, as expected, reflecting the accessibility of hospitals for the population. Health expenditure per capita is particularly strongly correlated with home death percentage; this variable reflects the ‘supply’ of hospitals, although it is imperfect because health spending can be directed to many areas, which may vary between countries. The data published by the WHO on hospital density were also investigated but were not included in the models since they are not available for many recent country-years and basic analysis of the data set revealed that this metric is poorly correlated with home death percentage.27 A significant advantage of this model is that it standardises for any biases introduced by age and cause composition of deaths on the home death percentage.
The subnational model is weaker than the national model due to the limited availability of data at the subnational level with which to develop such a model and the need to use national home deaths percentage. When applied to available subnational place of death data, it resulted in a MAE just over double that at the national level. The average error was slightly higher again for the nine subnational areas in countries whose national figure was not included in the database, which are predominantly in sub-Saharan Africa; however, this average error was still less than 10% points. Application of this model can be especially important for populations such as in sub-Saharan Africa with a very high percentage of deaths occurring at home and very low death registration.
A particular challenge in developing a model for home deaths for global application is the role of cultural preferences about where death occurs. For example, in Myanmar, as is undoubtedly the case in many other LMICs, a significant proportion of hospital inpatients leave the hospital to return home to die.28 The strong positive coefficient for the East Asia region suggests a cultural preference for dying at home in those countries, including China, after controlling for other variables included in the model. Similarly, there are strong negative coefficients in South Asia and Tropical Latin America, indicating a relatively low likelihood for home deaths in these locations, after adjusting for other factors. Even within Latin America there is significant variation in the regional coefficients, and within regions there are large differences, demonstrated by the greater than 10% points difference between the observed and estimated home death percentage in Argentina, Colombia and Mexico. The impact of cultural preferences on location of death requires further investigation, but as the results demonstrate, are likely to be markedly divergent in only a handful of countries.
The estimates of home death percentage for LMICs are dominated by China and India, which comprise almost half of these deaths. While place of death data are available for China, they are not for India. However, the Indian Sample Registration System (SRS) does report that 52% of deaths in 2018 did not receive medical attention at a hospital (private or government) prior to death.29 If the vast majority of deaths in India not receiving hospital-based medical attention do occur at home (with other deaths occurring in public), and if there is no significant level of people leaving hospital to die at home, then there would be approximately one-half of deaths in India that occur at home. This closely aligns to the 53% of deaths occurring in the home as estimated by the model. Application of the model to earlier years of SRS also shows quite close concordance (2011: SRS 66% non-hospital, model 70% home; 2006: SRS 72% non-hospital, model 75% home).30
A key limitation of the models is that, as mentioned, there is no accurate measure of proximity to hospitals, and rely on urbanisation as an indirect measure of what has been repeatedly shown to be an important determinant of hospital use.31 While place of birth delivery is an important predictor of home death percentage, many non-home births may occur in maternity clinics, the availability of which may not correlate with hospital availability. However, not all place of birth data reported the percentage of births occurring in such facilities. Finally, only 49 countries were able to be included in the database, even fewer from LMICs. Countries typically do not publish such data but this could also reflect the fact that most LMICs have death registration completeness that is too low to allow for such data to be reliably reported.
Conclusion
Despite these limitations, the models presented in this study yield reasonably reliable national and subnational estimates of the fraction of deaths that occur in the home, which will be of much benefit in enabling countries to integrate home and hospital cause of death fractions for national health monitoring and to measure key mortality indicators, including for Sustainable Development Goals, to plan and monitor the success of efforts to implement verbal autopsy methods to measure causes of death for those who die outside of hospitals, and to more generally understand their burden of disease by more appropriately weighting information on deaths by location. Significant and sustained efforts are necessary in many LMICs to strengthen CRVS systems to enable the production of more reliable evidence on patterns of place of death. However, in the interim, the results provided in this study provide valuable insights into where people die and how it varies across the world. By showing that most deaths in LMICs occur outside of hospitals, the study reinforces the high proportion of deaths that would require routine verbal autopsy to determine the cause of death. Additionally, the subnational model can be used by local analysts to estimate the number of deaths occurring both within and outside hospital and to understand the completeness of reporting of causes of death in each location.
Data availability statement
Data are available in a public, open access repository. Data used in the study are located here: https://figshare.com/s/e18acdff54a23858181f Code used to generate the findings are located here: https://figshare.com/s/8cf7a6ebb84c3af4bc33
Ethics statements
Patient consent for publication
Acknowledgments
Surender Pandey provided assistance in searching and compiling the data used in this study.
Supplementary materials
Supplementary Data
This web only file has been produced by the BMJ Publishing Group from an electronic file supplied by the author(s) and has not been edited for content.
Footnotes
Handling editor Seye Abimbola
Contributors TA is the sole author.
Funding This study was funded under an award from Bloomberg Philanthropies and the Australian Department of Foreign Affairs and Trade to the University of Melbourne to support the Data for Health Initiative.
Disclaimer The funders had no role in study design, data collection and analysis, decision to publish, or preparation of the manuscript.
Map disclaimer The inclusion of any map (including the depiction of any boundaries therein), or of any geographical or locational reference, does not imply the expression of any opinion whatsoever on the part of BMJ concerning the legal status of any country, territory, jurisdiction or area or of its authorities. Any such expression remains solely that of the relevant source and is not endorsed by BMJ. Maps are provided without any warranty of any kind, either express or implied.
Competing interests None declared.
Provenance and peer review Not commissioned; externally peer reviewed.
Supplemental material This content has been supplied by the author(s). It has not been vetted by BMJ Publishing Group Limited (BMJ) and may not have been peer-reviewed. Any opinions or recommendations discussed are solely those of the author(s) and are not endorsed by BMJ. BMJ disclaims all liability and responsibility arising from any reliance placed on the content. Where the content includes any translated material, BMJ does not warrant the accuracy and reliability of the translations (including but not limited to local regulations, clinical guidelines, terminology, drug names and drug dosages), and is not responsible for any error and/or omissions arising from translation and adaptation or otherwise.