Article Text

Abstract
Introduction We describe COVID-19 morbidity, mortality, case fatality and excess death in a country-wide study of municipalities in Hungary, exploring the association with socioeconomic status.
Methods The spatial distribution of morbidity, mortality and case fatality was mapped using hierarchical Bayesian smoothed indirectly standardised ratios. Indirectly standardised ratios were used to evaluate the association between deprivation and the outcome measures. We looked separately at morbidity and mortality in the 10 districts with the highest and 10 districts with the lowest share of Roma population.
Results Compared with the national average, the relative incidence of cases was 30%–36% lower in the most deprived quintile but the relative mortality and case fatality were 27%–32% higher. Expressed as incidence ratios relative to the national average, the most deprived municipalities had a relative incidence ratio of 0.64 (CI: 0.62 to 0.65) and 0.70 (CI: 0.69 to 0.72) for males and females, respectively. The corresponding figures for mortality were 1.32 (CI: 1.20 to 1.44) for males and 1.27 (CI: 1.16 to 1.39) for females and for case fatality 1.27 (CI: 1.16 to 1.39) and 1.32 (CI: 1.20 to 1.44) for males and females, respectively. The excess death rate (per 100 000) increased with deprivation levels (least deprived: 114.12 (CI: 108.60 to 119.84) and most deprived: 158.07 (CI: 149.30 to 167.23)). The 10 districts where Roma formed the greatest share of the population had an excess mortality rate 17.46% higher than the average for the most deprived quintile.
Conclusions Those living in more deprived municipalities had a lower risk of being identified as a confirmed COVID-19 case but had a higher risk of death. An inverse association between trends in morbidity and mortality by socioeconomic conditions should be a cause for concern and points to the need for responses, including those involving vaccination, to pay particular attention to inequalities and their causes.
- COVID-19
- geographic information systems
- epidemiology
- public health
Data availability statement
Extracted data sheets and data dictionary will be made available immediately after publicationof this Article upon request to the corresponding author Róza Ádány DSc. These data sheetswill be shared with researchers who provide a methodologically sound proposal, after theauthors' review of requests. Requesters will need to sign a data access agreement.
This is an open access article distributed in accordance with the Creative Commons Attribution Non Commercial (CC BY-NC 4.0) license, which permits others to distribute, remix, adapt, build upon this work non-commercially, and license their derivative works on different terms, provided the original work is properly cited, appropriate credit is given, any changes made indicated, and the use is non-commercial. See: http://creativecommons.org/licenses/by-nc/4.0/.
Statistics from Altmetric.com
Key questions
What is already known?
Several studies describe inequalities in COVID-19 health outcomes, but most have focused on individual demographical risk factors, such as age, gender or underlying chronic health conditions, and only few studied COVID-19 in context with socioeconomic and geographic inequalities.
What are the new findings?
In Hungary, those living in more deprived municipalities had a lower risk of being ascertained as a confirmed COVID-19 case but had a higher risk of death during the second pandemic wave.
This picture of reduced case ascertainment and high mortality was even greater in districts with the highest representation of the Roma population.
What do the new findings imply?
Identification of vulnerable communities, as a prelude to policy measures to address their needs, is of utmost importance to mitigate the further devastating effects of COVID-19 pandemic and possible future epidemics.
An inverse association between trends in morbidity and mortality by socioeconomic conditions should be a cause for concern and points to the need for responses, including those involving vaccination, to pay particular attention to inequalities and their causes.
Introduction
Community transmission of COVID-19 was first detected in Hungary in March 2020 but the first epidemic wave was suppressed rapidly with an intensive government response.1 Nevertheless, the second wave was more severe in terms of both morbidity and mortality. There are good reasons to believe that it has not affected everyone to the same extent. This points to the need for a more detailed analysis to understand what was happening, for example, by looking at the different counties with their varying socioeconomic characteristics.2 3
COVID-19 has shone a light on longstanding inequalities in societies everywhere. Those already disadvantaged, whether on grounds of socioeconomic position, ethnicity or some other characteristic, have been most likely to become infected. When they are infected, they are more likely to become seriously ill or die. This has been found whether the disadvantage is measured at individual or community level and in many different settings, including the USA,4–7 Brazil,8–11 Columbia,12Chile13 and the UK.14 A rare exception is a single study from Rio de Janeiro that found that ‘age-standardised incidence rates were higher in wealthy neighbourhoods, mortality rates were higher in deprived municipalities during the first 2 months’ (in April and May 2020) of the pandemic.10
There is unlikely to be a single explanation for these findings. Research in Brazil pointed to inequalities in access to health facilities.8 9 11 A study in the UK concluded that deprivation explained most, but not all, of the large ethnic gaps in COVID-19 outcomes.15 Other studies have looked at different elements of the causal pathway, showing, for example, that those living precarious lives are more likely to have public facing jobs and to be less able to afford time to get tested or isolate if infected.16 Poorer people are also more likely to have the known risk factors for severe disease and death, including comorbidities such as cardiovascular disease, hypertension and diabetes.17–19 The apparently paradoxical findings in the Brazilian study may reflect differences in access to testing.
As this brief review shows, the existing body of research is limited, especially so in the European Union, even though it has been severely affected during the pandemic. There has not, to our knowledge, been any study of inequalities in COVID-19 outcomes in an entire country during the second wave of the pandemic when it might be expected that many lessons had already been learnt. We address this gap with a study from Hungary, investigating the association between socioeconomic status of the population and COVID-19 morbidity, mortality, case fatality and excess mortality.
Methods
Data collection
Data on COVID-19 cases were obtained from the Hungarian Notifiable Disease Surveillance System, operated by the National Public Health Center (NPHC). The national surveillance protocol for COVID-19, which includes case definitions, was updated several times in line with changing European Centre for Disease Prevention and Control and WHO guidance. Under the Hungarian protocol, suspected cases of COVID-19 (who met the clinical and epidemiological criteria or at the discretion of the physician) were reported to NPHC by the healthcare provider. A person with laboratory confirmation (detection of SARS-CoV-2 by PCR and, since 7 November 2020, SARS-CoV-2 antigen detection by a lateral flow test) of COVID-19 infection, irrespective of clinical signs and symptoms, was considered a confirmed case.20
The first and last days of the second pandemic wave in Hungary were defined as the days before and after the peak of the second wave when the lowest daily number of cases was recorded. These days were 22 June 2020 and 24 January 2021.
The epidemic curve was constructed using daily confirmed COVID-19 cases reported to NPHC from various data sources. Official COVID-19 data by age, gender and municipality were obtained from NPHC. Morbidity was defined as the incidence of COVID-19 cases confirmed during the second wave.
A brief explanation of the subnational divisions of Hungary is necessary. There are three territories at Nomenclature of National Units for Statistics (NUTS) 1 level, Central Hungary, which includes the capital, Budapest, Transdanubia, in the West, and the Great Plain and North, in the East. Each of these is divided into 2–3 NUTS2 territories (total 8) and these are further divided into 20 NUTS3 territories, comprising the capital and 19 counties. These are further divided, with Budapest comprising 23 districts and the counties, collectively, in 197 districts (the Hungarian names of these two types of districts differ but for the present purposes can be considered the same). The districts in counties, but not in the capital, are further divided into between 60 and 358 municipalities, a total of 3155. In this study, data on the share of Roma in the population were available only at district level, while all other data were available at municipality level (except in Budapest where the lowest administrative level is the district).
Municipalities were classified according to a Deprivation Index (DI) using data from the Hungarian Central Statistical Office (Census 2011) and the Hungarian Tax and Financial Control Administration (2011). The DI was calculated using seven municipality-level socioeconomic indicators, including income, level of education, rate of unemployment, the proportion of one-parent families and of large families, density of housing and car ownership by principal component analysis.21 A higher index value indicates municipalities with a lower socioeconomic status compared with the national average. The DI has been successfully used in several previous studies.21–29
COVID-19 related deaths were those in which COVID-19 had been previously confirmed by testing and where COVID-19 was listed as the underlying or a contributing cause of death (among multiple causes) according to the NPHC Hungarian Notifiable Disease Surveillance System data. Mortality was defined as the incidence of COVID-19 related deaths up to 13 April 2021 among COVID-19 cases confirmed during the second wave. The case fatality was calculated by dividing the number of COVID-19 related deaths up to 13 April 2021 among COVID-19 cases confirmed during the second wave by the number of COVID-19 cases confirmed during the second wave.
Data on mortality were obtained through the national Electronic Civil Registration System, for the entire year of 2020 and for January 2021. Time trends in mortality from all causes of death were disaggregated by sex, age and week of death. Excess mortality was calculated, within municipalities in each deprivation quintile, with reference to the years compared with the 2014–2019 mortality on data available as of 6 April 2021. Population data by sex and age at municipality level for the same period were obtained from the Central Office for Administrative and Electronic Public Services.
The Roma population are especially disadvantaged in Hungary and we looked separately at the 10 districts in which their share of the population was lowest (0.4%–1.8%) and highest (27.9%–39.0%), as identified in a previous country-wide survey by Pénzes et al.30 31
Statistical analysis
Disease mapping
The spatial distribution of morbidity, mortality and case fatality were mapped using hierarchical Bayesian smoothed indirectly standardised ratios, applying the ‘disease mapping’ option within the rapid inquiry facility (RIF).32 33 Relative ratios were calculated using Besag et al’s model and the integrated nested Laplace approximation method34 35 with the expected cases based on the age-specific (by 5 years age groups) and sex-specific rates of Hungarian population for the second pandemic wave. Posterior probabilities that the ratios are above 1 were visualised at municipality level to indicate the uncertainty in the risk estimates.32 36
Spatial scan statistics
Age-adjusted and sex-adjusted morbidity, mortality and case fatality clusters with elevated and lower risk were detected using spatial scan statistics (directly linking to SaTScan from RIF) to corroborate results from the disease mapping.33 37 The maximum spatial cluster size was defined as 50% of the population at risk.
Risk analysis
The aim of the risk analysis was to assess if there was an association between deprivation and morbidity, mortality and case fatality. In the risk analysis module of RIF,33 municipalities were grouped into quintiles by deprivation values and indirectly standardised ratios (relative risks) and their 95% CIs were calculated for each band, as described above. The reference was the age-specific (by 5 years age groups) and sex-specific rates of Hungarian population for the second pandemic wave. χ2 tests for homogeneity and for linear trend were performed to test the global association between deprivation and relative risks.
Excess mortality
Trends and ratios of excess mortality during the second pandemic wave were calculated using the weekly age (by 5 years age groups) and sex-specific rates for the Hungarian population from the 42nd week of 2020 to the 2nd week of 2021, applying the RIF.33
Examining excess mortality by deprivation quintile from the 42nd week of 2020 to the 2nd week of 2021, the expected cases of death were calculated using age-specific (by 5 years age groups), sex-specific and municipality-specific rates for same weeks of 2014–2019, using data derived from death certificates on 6 April 2021 (97.6% of all known deaths in that period).
Results
During the second pandemic wave, the cumulative number of confirmed COVID-19 cases reported was 356 197 (3592 cases per 100 000 population), including 12 945 deaths (crude case-fatality ratio 3.6%), among whom 83.9% (10 862 deaths) were in the 65+ years age group (recorded and validated until 13 April 2021).
The daily number of newly registered cases started to increase sharply during the last week of August 2020, followed by an increase of COVID-19related deaths 3 weeks afterwards (online supplemental file). The peak in confirmed new cases was recorded on 28 November (6817 cases, 69 per 100 000), and of deaths (by date of death) on 1 December (195 cases, 2 per 100 000). The highest crude case-fatality ratio was observed in the 80+ years age group (23.4%), followed by the 65–79 years (12.8%) and the 50–64 years age group (2.1%). No deaths were reported among those under 18 years.
Supplemental material
Of the 356 197 cases, 55.7% (198 496 cases) were female and 44.3% (157 700 cases) male (sex not reported for one case). Confirmed cases among women were higher (3864 vs 3299 cases per 100 000 population); men were 0.9 (95% CI 0.85 to 0.86) less likely to be ascertained as COVID-19 case. However, men had a 1.1 (95% CI 1.08 to 1.16) higher risk of death (167 cases vs 150 cases per 100 000 in the 18+ years population).
The spatial distribution of deprivation and of the incidence ratio of confirmed cases, relative mortality and case fatality due to COVID-19 at municipality level are shown in figure 1. The most deprived municipalities are in the north-eastern and south-western parts of Hungary, while the least deprived are in the north-western part of Hungary and in the capital city of Budapest and its neighbouring area (figure 1A).

The spatial distribution of deprivation (A), incidence ratio of confirmed cases (B), relative mortality (C), and relative case fatality (D) due to COVID-19, during the second pandemic wave in Hungary.
Areas with high relative morbidity are seen in the north-western and south-eastern parts of Hungary, while areas with low relative incidence of registered cases are in the north-eastern and mid-western parts of the country (figure 1B). Areas with high relative mortality risks were found primarily in the north-eastern part of Hungary. In addition, clusters with high relative mortality risk were identified in the central and western parts. Clusters of low relative risk of mortality were localised in the mid-western part of Hungary (figure 1C). Areas with high relative case fatality were in the north-eastern part of the country, while areas of low case fatality risk were found in the south-eastern, north-western and the north-central part of Hungary (figure 1D).
In the 10 districts with the highest share of Roma in the population, the incidence was consistently below the national average but, in most cases, death rates were higher, while in the 10 districts with the lowest Roma population the incidence was higher than the national average and mortality risk was lower.
There is a clear mismatch between morbidity and mortality clusters.
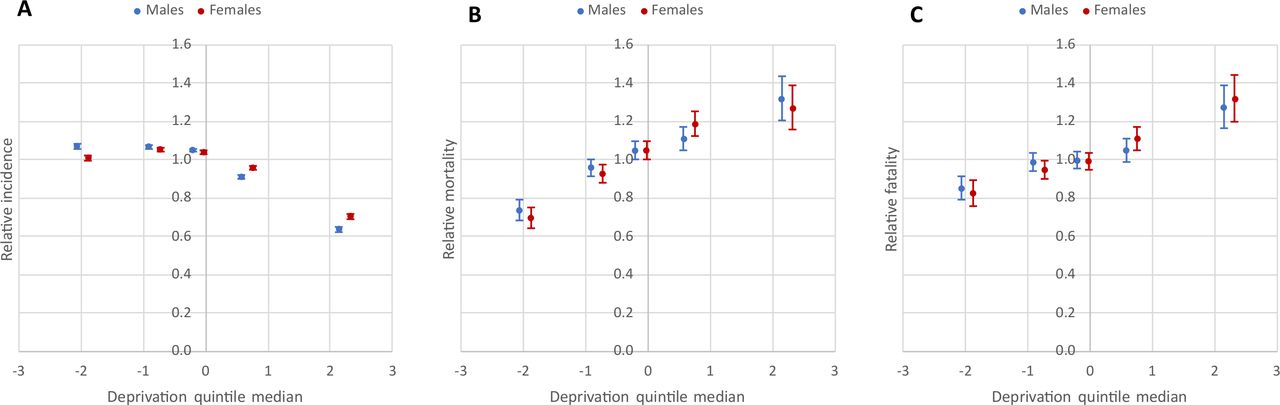
There was a negative association between relative incidence of confirmed cases and deprivation (males: χ2Homogeneity=2277.81, p=0; χ2Linearity=1687.14, p=0; females: χ2Homogeneity=1568.36, p=0; χ2Linearity=852.03, p=0), but there was a strong positive association between relative mortality and case fatality and deprivation (for mortality, males: χ2Homogeneity=122.95, p=0; χ2Linearity=118.33, p=0; females: χ2Homogeneity=154.86, p=0; χ2Linearity=145.19, p=0; for case fatality, males: χ2Homogeneity=49.81, p=0; χ2Linearity=44.68, p=0; females: χ2Homogeneity=75.44, p=0; χ2Linearity=73.39, p=0) (figure 2A–C, table 1). In the least deprived quintile, incidence was 7% higher than average for males, while for females it was at the national average. In marked contrast, relative incidence in the most deprived quintile was 36% lower for males and 30% for females (figure 2A, table 1). In the least deprived quintile mortality was about 30% lower for both sexes and in the most deprived band (V. quintile), it was about 30% higher than the national average (figure 2B, table 1). Consistent with these findings, case fatality in the least deprived quintile was 15%–18% lower and in the most deprived quintile 27-32% higher than average (figure 2C, table 1).
Relative risks of incidence of confirmed cases, mortality and case fatality due to COVID-19 during the second pandemic wave by DI quintiles and sex in Hungary

Relationship between the deprivation and relative incidence of confirmed cases (A), relative mortality (B), and relative case fatality (C) due to COVID-19 during the second pandemic wave by DI quintile in Hungary.
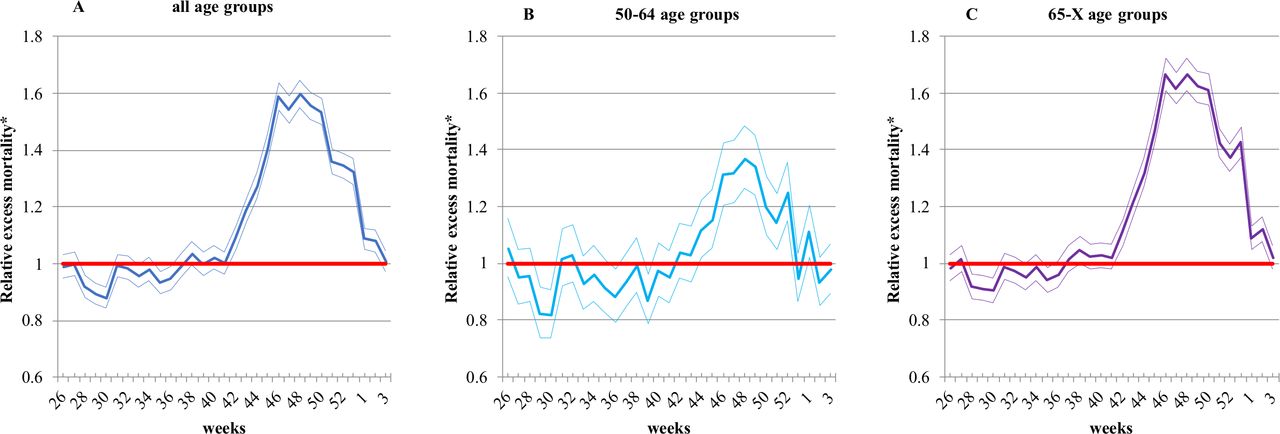
Excess mortality due to all causes of death was significantly elevated from the 42nd week of 2020 to the 2nd week of 2021 in all age groups (figure 3). The highest relative excess mortality at all ages combined (1.60 (CI: 1.55 to 1.65)) and in the 50–64 years (1.37 (CI: 1.26 to 1.49)) was observed in the 48th week (figure 3A,B), while for the 65 years and above age group it was in the 46th week (1.67 (CI: 1.61 to 1.73)) (figure 3C).
Relative excess mortality due to all causes of death during the second COVID-19 pandemic wave, compared to the average weekly mortality for the period 2014-2019 by age group in Hungary.*The thin lines indicate the 95% CIs.
Looking at the period of the second pandemic wave as a whole, excess mortality between the 42nd week of 2020 and the 2nd week of 2021 was 35% higher (excess mortality0-X years: 1.35 (CI: 1.34 to 1.36) with 12 973 (CI: 12 646 to 13 297) excess death at all ages combined, 16% higher (excess mortality50-64 years: 1.16 (CI:1.13 to 1.18) with 981.23 (CI: 834.76 to 1123.5) excess death in the 50–64 years age group and 40% higher (excess mortality65-X years: 1.40 (CI: 1.39 to 1.42) with 11 724 (CI: 11 440 to 12 005) excess deaths in the 65 years and above age group, in all cases compared with average rates in the same period in the previous 6 years (figure 3).
Looking by deprivation quintile, excess mortality in the most deprived quintile was 38,51% higher than in the least deprived one. The excess death rate in districts with the lowest representation of Roma population was 10.16% lower than the average in the least deprived quintile, while the excess death rate in districts with the highest representation of Roma population was 17.46% higher than the average in the most deprived quintile (table 2). The excess death rates observed in districts with the largest share of the Roma population were 1.81 times higher than in those with the smallest share.
Mortality figures (expected, observed and excess deaths) in the second wave of COVID-19 pandemic from the 42nd week of 2020 to the 2nd week of 2021 resulted in excess deaths in comparison with that of the relevant period of 2014–2019 by DI quintile and the districts with the lowest and the highest representation of Roma population in Hungary
Discussion
In Hungary, the second wave of the COVID-19 outbreak, which started on 22 June 2020, has been much more severe than the first.1 3 However, not everyone was affected equally. The spatial distribution of incidence disease showed reversed correlation with deprivation, as those living in more deprived areas had a lower risk of being ascertained as a confirmed COVID-19 case. In contrast, those living in more deprived areas had a higher risk of death. The risk of death was also higher among those who become ill in more deprived areas. The most obvious explanation is that many cases in the deprived north-eastern region were not ascertained, although further research would be required to confirm this.
This pattern was even more accentuated in those districts where the Roma population made up the greatest share of the population. There is extensive evidence that Roma are disadvantaged materially and in health terms in Hungary as in its neighbouring countries.38 39 In these districts, despite low reported incidence, death rates were even higher than the average for the most deprived municipalities. Although we lack the individual data needed to determine whether Roma experience higher death rates, this would be consistent with a comment from a Hungarian Roma rights advocate describing multiple deaths in single families: ‘Our people are falling like flies’.40A single study of a COVID-19 outbreak (from 8 April to 4 June 2020) in a Greek Roma settlement with about 2500 permanent residents, 142 laboratory-confirmed cases and one death were reported, but the immediate lockdown of the settlement prevented the disease from spreading beyond the settlement’s borders and no COVID-19 cases were observed in either the nearby city of Larissa or in other Roma communities in the region.41
This study is subject to several limitations. It is likely that reported COVID-19 cases almost everywhere are underestimated because of incomplete detection of cases.42 43 Hungary seems no exception and, despite consistent case definitions and reporting procedures within the country,44 it does seem likely that the relatively low reported incidence in the more deprived areas is at least in part due to artefact because of undertesting, which may have become a greater problem when the health system was under extreme pressure. Unfortunately, we have been unable to obtain data on the volume of testing at the level of municipalities to explore this further.
It is also likely that reported COVID-19 deaths are underestimated because of incomplete follow-up of all reported cases and deaths of people who had COVID-19 but were never diagnosed, although this is probably less of a concern when undertaking comparisons within rather than among countries.
We can take some reassurance from the finding that the ratio of confirmed COVID-19 deaths to all excess deaths is higher (74.07% in the most deprived quintile and 86.35% in the middle quintile) than in several other countries. The corresponding figures in 2020 (compared with death rates in 2019) were 69.5% in the EU (530 634 excess death vs 368 543 COVID-19 death), 64.8% in Spain (78 491 excess death vs 50 837 COVID-19 death), 42.7% in Romania (36 899 excess death vs 15 767 COVID-19 death) and 36.6% in Slovakia (5835 excess deaths vs 2138 COVID-19 death).45–47 The figure for the USA from 1 March 2020 to 2 January 2021 was 72.4%, but this varied considerably among states (eg, it was only 27.9% in Vermont).48 However, within-country differences still exist in Hungary, as COVID-19 deaths explain a somewhat smaller proportion of excess deaths (66.33%) in districts with a high representation of Roma population. In a recently published study, age-standardised weekly cumulative excess mortality in Hungary in the calendar year 2020, excess mortality was lower than that of the most European countries with more severe first and second waves and also lower compared with neighbouring countries where the second wave resulted in more than 10% excess mortality compared with the preceding years.49 However, that study did not consider the whole period of the second pandemic wave and the mortality data were not yet complete when the analysis was carried out.
It should be noted that several different mathematical techniques to determine the duration of the second wave could be used, such as moving averages (e.g., 7 days) or a general additive model, as well as the use of the Savitzky-Golay filter combining polynomial smoothing and moving average calculations through a two steps process to select and refine the inflection points.3 However, when we applied these approaches, the difference amounted to only a few days in the duration of the second wave and very few cases. For example, using the 7-day moving average would result in only 474 additional cases, or just over 0.1%, which does not materially affect our results.
The age of the data used to calculate the DI is an unavoidable limitation. Most of the indicators at the municipal level can only be obtained from the last census in 2011 so, inevitably, the index may become less accurate over time. However, the distribution of less developed areas remains essentially the same in 2011 as was seen 30 and 20 years ago (in censuses in 1990 and 2001); hence, it does not seem that the spatial distribution of underprivileged areas has changed to any great extent.21
Finally, it should be emphasised that the available data on deprivation may not capture the most appropriate variables for explaining COVID-19 outcomes, with others, such as irregular or informal employment potentially more useful. There is a broad consensus that descriptive epidemiology is hampered by the lack of individual-level data of important socioeconomic variables in most routinely collected COVID-19 surveillance datasets. Future analytical epidemiological studies that can tease out the complex pathways linking individual and community characteristics, illness, and death are now needed.
Conclusion
It is now well recognised that those already disadvantaged have suffered most in the pandemic in many countries, even if the magnitude of differences is rarely well described. The geographical inequalities in the health status of the Hungarian population long precede the pandemic21 25 26 28 29 but have been exacerbated by it. Those living in more deprived areas, with less education, and who are in disadvantaged groups such as Roma are more likely to have pre-existing conditions.4 8 12 14It is now well documented that people with hypertension, obesity and other metabolic disturbances have increased risk of to severe COVID-19 infections.50–54 In a 2018 study, it was showed that the prevalence of metabolic syndrome and its components (especially that of abdominal obesity, hypertension and elevated fasting glucose level) has increased significantly in the Hungarian population in the last decade, as has the number of individuals whose hypertension and metabolic disturbances remain untreated.55 They are also at higher risk of contracting the virus because they are more likely to be in public facing jobs, are less likely to be able to work remotely and find it more difficult to isolate if infected.7 14 Although Hungary has a well-developed health system, we do know that Roma in particular often have high levels of unmet need so this may also play a role.56
In summary, we have identified parts of Hungary that have been especially hard hit during the pandemic, although this could be missed with a narrow focus on incidence. Our findings point to the importance of monitoring the course of the pandemic at a much more granular level than has so far been the case in many countries.
Given the widespread use of data on incidence of COVID-19, this paper is a timely reminder of the need for caution in comparisons, as reported cases may underestimate the overall disease burden, especially in more deprived municipalities. Identification of vulnerable communities, as a prelude to policy measures to address their needs, is of utmost importance to mitigate the further devastating effects of COVID-19 pandemic and possible future epidemics.
Data availability statement
Extracted data sheets and data dictionary will be made available immediately after publicationof this Article upon request to the corresponding author Róza Ádány DSc. These data sheetswill be shared with researchers who provide a methodologically sound proposal, after theauthors' review of requests. Requesters will need to sign a data access agreement.
Ethics statements
Patient consent for publication
Ethics approval
Ethical approval was not required because individual-level, personal data were not used in this ecological study.
Acknowledgments
The authors thank János Pénzes (Department of Social Geography and Regional Development Planning, Institute of Earth Sciences, Faculty of Science and Technology, University of Debrecen) for providing data on Roma population.
References
Supplementary materials
Supplementary Data
This web only file has been produced by the BMJ Publishing Group from an electronic file supplied by the author(s) and has not been edited for content.
Footnotes
Handling editor Seye Abimbola
Contributors BO, AJ, CN, JKH and RÁ jointly conceived the study and developed the study outline. JKH compiled the data and AJ, CN and JKH did the analysis. BO wrote the first draft with input from AJ, CN and JKH. Validation was carried out by BO and JKH. All authors contributed to the subsequent drafts and to the final manuscript. The finalisation of the manuscript and supervision was carried out by MM and RÁ. All authors had access to all estimates presented in the paper and had final responsibility for the decision to submit for publication.
Funding This study was financed by the Hungarian Academy of Sciences (TK2016-78) and project no. 135784 has also been implemented with the support provided from the National Research, Development and Innovation Fund of Hungary, financed under the K_20 funding scheme.
Competing interests None declared.
Patient and public involvement statement Patients were not involved in the study.
Provenance and peer review Not commissioned; externally peer reviewed.
Supplemental material This content has been supplied by the author(s). It has not been vetted by BMJ Publishing Group Limited (BMJ) and may not have been peer-reviewed. Any opinions or recommendations discussed are solely those of the author(s) and are not endorsed by BMJ. BMJ disclaims all liability and responsibility arising from any reliance placed on the content. Where the content includes any translated material, BMJ does not warrant the accuracy and reliability of the translations (including but not limited to local regulations, clinical guidelines, terminology, drug names and drug dosages), and is not responsible for any error and/or omissions arising from translation and adaptation or otherwise.