Article Text

Abstract
Background Little is known about the contribution of community health posts and community health workers (CHWs) to geographical accessibility of primary healthcare (PHC) services at community level and strategies for optimising geographical accessibility to these services.
Methods Using a complete georeferenced census of community health posts and CHWs in Niger and other high-resolution spatial datasets, we modelled travel times to community health posts and CHWs between 2000 and 2013, accounting for training, commodities and maximum population capacity. We estimated additional CHWs needed to optimise geographical accessibility of the population beyond the reach of the existing community health post network. We assessed the efficiency of geographical targeting of the existing community health post network compared with networks designed to optimise geographical targeting of the estimated population, under-5 deaths and Plasmodium falciparum malaria cases.
Results The per cent of the population within 60-minute walking to the nearest community health post with a CHW increased from 0.0% to 17.5% between 2000 and 2013. An estimated 10.4 million people (58.5%) remained beyond a 60-minute catchment of community health posts. Optimal deployment of 7741 additional CHWs could increase geographical coverage from 41.5% to 82.9%. Geographical targeting of the existing community health post network was inefficient but optimised networks could improve efficiency by 32.3%–47.1%, depending on targeting metric.
Interpretations We provide the first estimates of geographical accessibility to community health posts and CHWs at national scale in Niger, highlighting improvements between 2000 and 2013, geographies where gaps remained and approaches for optimising geographical accessibility to PHC services at community level.
- geographic information systems
- child health
- malaria
- health systems
- health services research
Data availability statement
Data are available in a public, open access repository under the Creative Commons Attribution 4.0 Unported (CC BY 4.0) licence, which permits others to copy, redistribute, remix, transform and build upon this work for any purpose, provided the original work is properly cited, a link to the licence is given, and indication of whether changes were made. See: https://creativecommons.org/licenses/by/4.0/. Supplemental appendices 2–6, videos 1–2, and all model outputs are available in supplemental appendix 1b at https://doi.org/10.5281/zenodo.4428176. All model inputs (except existing service delivery locations) are available in supplemental appendix 1c at https://doi.org/10.6084/m9.figshare.13536779.v6. Health service delivery location data are only available through data sharing agreements with UNICEF and the Ministry of Public Health of Niger.
This is an open access article distributed in accordance with the Creative Commons Attribution Non Commercial (CC BY-NC 4.0) license, which permits others to distribute, remix, adapt, build upon this work non-commercially, and license their derivative works on different terms, provided the original work is properly cited, appropriate credit is given, any changes made indicated, and the use is non-commercial. See: http://creativecommons.org/licenses/by-nc/4.0/.
Statistics from Altmetric.com
Key questions
What is already known?
Previous studies have estimated geographical accessibility (as travel time) to health facilities, geographical accessibility to community health workers (CHWs) for subnational areas only, and assessed efficiency of the distribution of hospitals in low/middle-income countries.
What are the new findings?
The per cent of the population within 60-minute walking to the nearest community health post with a paid, full-time CHW increased from 0.0% to 17.5% between 2000 and 2013, with 15.5% within 60-minute walking to the nearest health post with a CHW trained on integrated community case management (iCCM)—making primary healthcare (PHC) services at community level and iCCM, specifically, geographically accessible for an estimated 2.3 million and 2.0 million additional people, respectively.
An estimated 10.4 million people (58.5%) remained beyond a 60-minute catchment of community health posts in 2013, with important variation across subnational geographies, training of CHWs and availability of essential commodities.
Optimal deployment of 7741 additional CHWs could increase geographical coverage of the estimated total population from 41.5% to 82.9%, providing physical access to PHC services at community level for an additional 7.4 million people not covered.
Optimised networks of community health posts increased efficiency of geographical targeting compared with the existing network by 32.3%–47.1%, depending on targeting metric.
What do the new findings imply?
The scale-up of community health posts staffed by paid, full-time CHWs improved geographical accessibility to PHC services at community level, including iCCM, between 2000 and 2013; however, efficiency of geographical targeting of community health posts was suboptimal, implying—that had scale-up been optimised—significant improvements in population coverage could have been realised, with cost-savings reinvested in further scale-up and health systems strengthening.
The approaches described in this study could inform retargeting of the existing network of community health posts and future scale-up efforts to optimise geographical accessibility of PHC services at community level in Niger and could be adapted to similar contexts within sub-Saharan Africa.
Background
Community health workers (CHWs) can play an important role in improving equitable access to quality primary healthcare (PHC) at community level in the context of Universal Health Coverage as front-line service providers and as a trusted bridge between health systems and communities.1–3 CHWs typically focus on maternal, newborn and child health and nutrition, providing a range of preventive, health promotion and curative services—including single disease or integrated community case management (iCCM).4 iCCM is the provision of integrated case management services for two or more childhood illnesses among children less than 5 years of age by CHWs, where geographical accessibility (ie, physical access) to health facility-based case management services is limited.5 In Niger, the Ministry of Public Health (MOPH) scaled up community health posts staffed by paid, full-time CHWs from the early 2000s. A midterm review of the National Community Health Strategy is planned for 2022, a Global Financing Facility (GFF) investment case is being developed and discussions on a new Health Sector Development Plan (2022–2026) are underway. Given this context, discussion on optimising geographical accessibility to PHC at community level is highly relevant. Previous studies in sub-Saharan Africa have estimated geographical accessibility (as travel time) to health facilities at national level6 7 and CHWs for subnational areas only.8–11 The efficiency of geographical targeting of health service locations has been assessed for hospitals in low-income and middle-income countries, but this did not include community health posts or CHWs.12 In this article, we describe for the first time at national scale the number and geographical distribution of community health posts and CHWs in Niger. We estimate their contribution to geographical accessibility to PHC services at community level, efficiency of geographical targeting of the community health posts and needs for further scale-up of CHWs with the aim of optimising PHC at community level.
Methods
In this section, we describe the study settings, data and methods used. Online supplemental appendix 1 provides a simplified analysis flow and additional details on the data and methods.
Supplemental material
Study settings
During the period of focus of this study, 2000–2013, Niger was divided into four political administrative levels: communes, departments, regions and national.13 The health system of Niger included a public and private sector organised in a decentralised, pyramidal structure with three administrative levels overseen by the MOPH. Details on the health system are provided in online supplemental appendix 1. Our analysis focuses on the first level (periphery) of the public sector, which is central to PHC at community level. The first level of the public sector is made up of referral facilities called centre de santé intégré (CSI) and community health posts called case de santé (CS). As of December 2012, there were 856 CSI offering a minimum package of services, focused on PHC, referral from and counter-referral to the CS, and supervision of the CS.13 CSI were typically staffed by nurses—and in certain large communes by a generalist doctor and midwives13—and, according to national norms, were intended to serve a maximum population of 5000–15 000 inhabitants, depending on population density.14 According to national norms, CS were intended to be situated 5 km beyond a supervising CSI and served a population of 2500–5000.14 CS provided a minimum package of services, focused on PHC at community level, including prevention services, health promotion services, and services for reproductive, maternal, newborn and child health, including iCCM. CS were typically staffed by a cadre of paid, full-time CHWs called agent de santé communautaire (ASC) and/or, in some cases, a nurse.14 CS and ASC were scaled up between 2000 and 2013—a period of considerable progress on under-5 mortality.15 16 As of December 2012, there were 2451 CS.13 Some CS were supported by one or more volunteer CHWs called relais communautaire (RC), providing health promotion and prevention interventions in the communities within the catchment area (typically a 5 km radius) of the CS.13 14 The MOPH in Niger plans to scale up RC—some targeted to communities beyond 5 km of CS or CSI to provide a standard package of preventive, promotive and curative services, including iCCM.17
Data
To inform our models of travel time to service delivery locations, we obtained spatial datasets for the following inputs: administrative boundaries (levels 0–3),18 a 2013 georeferenced census of health service delivery networks (CSI, CS and ASC),19 digital elevation model,20 land cover,21 roads,22 rivers and other water bodies (treated as barriers to movement where no road crossed),23 and travel scenarios. To inform our analysis of accessibility coverage, geographical coverage, RC scale-up and efficiency of geographical targeting of the CS, we obtained modelled estimates for population counts for 2000–201324 and 2015.25 Also to inform our analysis of the efficiency of geographical targeting of the CS, we obtained modelled estimates for the annual mean under-5 mortality rate in 201326 and modelled estimates for the annual mean incidence of Plasmodium falciparum (Pf) malaria among all ages (0–99 years) in 2013,27 as PHC services provided through the CS are intended to address under-5 mortality and malaria14 —with the latter being a main cause for curative consultations among children under-5 in Niger.13 We prepared the input datasets in the projected coordinate reference system WGS 84/UTM zone 32N (EPSG: 32632) for Niger at 100×100 m resolution for our analysis of accessibility coverage and 1×1 km for our analysis of geographical coverage, targeting and scale-up. Further details are in online supplemental appendix 1.
We prepared travel speed tables for two travel scenarios: (1) walking in dry conditions and (2) walking to the nearest road and then using motorised transportation (assumed to be immediately available) in dry conditions. We set travel speeds by travel scenario for each land cover class and road class. Travel speeds were adapted from previous studies and experience in Niger and broader sub-Saharan Africa.7 28
Assessing geographical accessibility
We assessed geographical accessibility through two measures: accessibility coverage and geographical coverage.
We defined accessibility coverage as the estimated percentage of people within a given travel time to the nearest health service delivery location of a given health service delivery network, accounting for travel speeds of different modes of transportation over different land cover classes and slope, with the direction of travel toward the health service delivery location.28 We estimated accessibility coverage at 100×100 m resolution for the CSI and CS-ASC (includes CS with or without ASC and the small number of ASC sites not within a CS) networks in 2013—and for the ASC network by gender, year of deployment (2000–2013), training, and availability of essential commodities—using 30-minute and 60-minute cut-offs for administrative levels 0–3 and the two travel scenarios. We used 30-minute and 60-minute cut-offs as previous analyses have shown care-seeking delays as a function of travel time after these cut-offs29 and they are clinically relevant (eg, for prompt treatment of severe illness).30 The analysis was constrained to national borders but allowed for travel across subnational administrative boundaries. We used the ‘geographic accessibility’ module within AccessMod 5 (V.5.6.48)28 to calculate travel time layers and the ‘zonal statistics’ module to calculate the zonal statistics for each travel time layer by administrative level.
We defined geographical coverage as the theoretical catchment area of a health service delivery location, within a maximum travel time, accounting for the mode of transportation and the maximum population coverage capacity of the type of health service delivery location.28 We used the ‘geographic coverage’ module of AccessMod 5 (V.5.6.48)28 to estimate geographical coverage for the CSI and CS-ASC networks in 2013 at 1×1 km resolution for the two travel scenarios. The maximum travel time was set at 60 min. The maximum population capacity was set at 10 000 for CSI and 2500 for CS-ASC based on norms of the MOPH of Niger.14 The maximum extent of a catchment was therefore delimited by the maximum travel time of 60 min except in cases where the estimated population in the catchment exceeded the maximum population capacity of the health service delivery location—in which case the extent of the catchment was smaller than the maximum travel time and was defined by the area containing the estimated population, up to the maximum population capacity.
Assessing geographical coverage of a hypothetical scale-up network of RC
To estimate the number of RC needed to maximise geographical accessibility of the population beyond the geographical coverage of the existing CSI and CS-ASC networks, we simulated a hypothetical network of RC in grid cells with at least 250 people in 2013 located beyond the geographical coverage of the existing CSI and CS-ASC networks at 1×1 km resolution, using a ratio of 1 RC per 1000 population (with a minimum threshold of 250 people to allocate 1 RC). We conducted a geographical coverage analysis at 1×1 km resolution to estimate the per cent of the estimated residual population that could be covered by the hypothetical RC network, within a maximum travel time of 60-minute walking to the nearest RC and maximum population capacity of 1000 for each RC.
Assessing efficiency of geographical targeting
We assessed the efficiency of geographical targeting of the CS-ASC network, using the concept of technical efficiency. We defined technical efficiency as the maximisation of a health outcome (geographical coverage) for a given set of inputs (the number of CS-ASC).31 We used the estimated population, under-5 deaths and Pf malaria cases (all ages) beyond the geographical coverage (60-minute walking) of the CSI network in 2013—hereafter called the estimated residual population, under-5 deaths and Pf malaria cases, respectively—as the ‘populations’ to target in our geographical targeting analysis. We assessed the efficiency of geographical targeting of the existing CS-ASC network with three metrics: (a) geographical coverage of the estimated residual population; (b) geographical coverage of the estimated residual under-5 deaths; and (c) geographical coverage of the estimated residual Pf malaria cases (all ages) beyond the catchment of the CSI network in 2013 at 1×1 km resolution compared with three hypothetical CS-ASC networks designed to optimise metrics a–c. For (a) we compared the existing CS-ASC network (n=2550) with the 2550 CS-ASC from the hypothetical network that maximised geographical coverage of the targeted population, using the MOPH norm of 1 CS-ASC per 2500 population as the maximum population capacity. There is no MOPH norm for the ratio of CS-ASC per under-5 deaths or Pf malaria cases. Assuming one CS-ASC could cover all estimated under-5 deaths or Pf malaria cases within their catchment regardless of population size would be unrealistic. Instead of making this unrealistic assumption, for metrics (b) and (c) we based the number of CS-ASC required for the existing CS-ASC network and the hypothetical CS-ASC network on the estimated number of CS-ASC needed to cover the estimated residual population in each catchment, using the MOPH norm of 1 CS-ASC per 2500 population. We then compared the estimated geographical coverage attained through the first 2550 CS-ASC of the existing CS-ASC network to the first 2550 CS-ASC of the hypothetical CS-ASC network designed to optimise metrics b–c. We assessed the potential effect of uncertainty of the estimates for under-5 deaths and Pf malaria cases among all ages on interpretation of our targeting results (see online supplemental appendices 1 and 7).
Patient and public involvement
We did not involve patients or the public in this study.
Results
Accessibility coverage
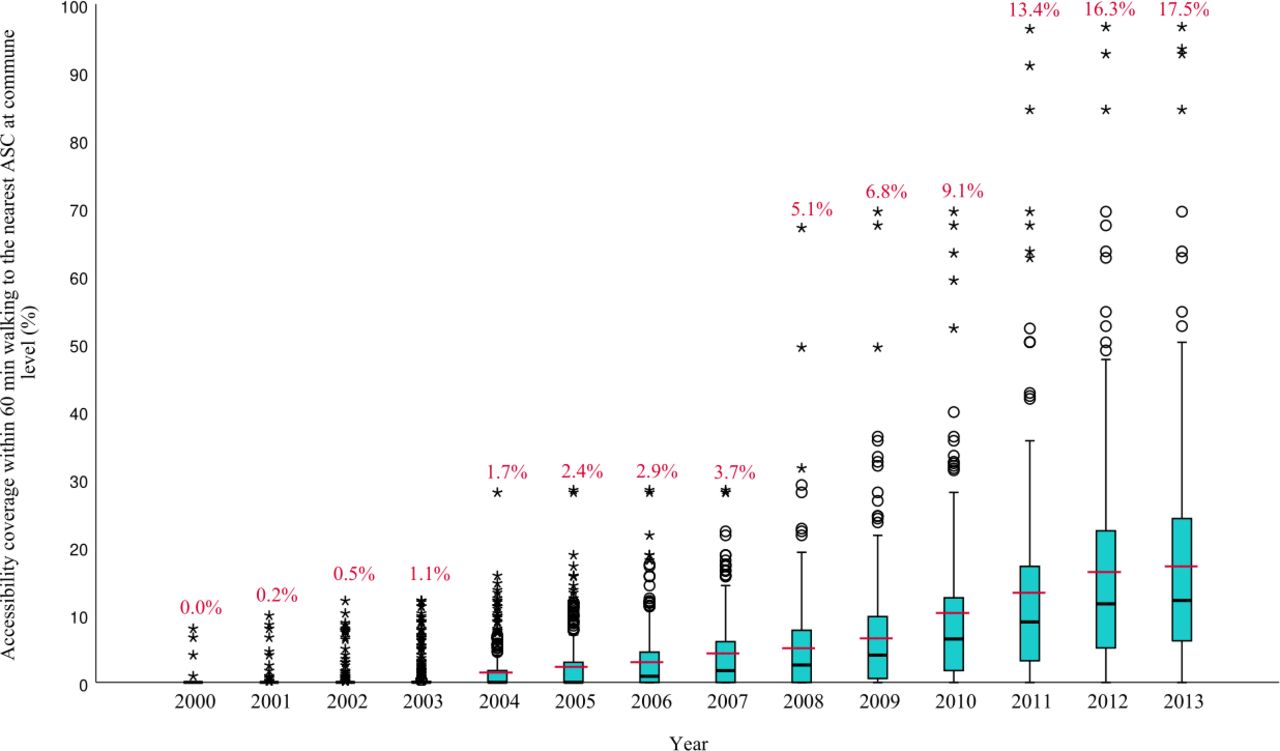
Accessibility coverage of the ASC network increased from 0.0% to 17.5% between 2000 and 2013, with large variation at subnational levels, given a 60-minute cut-off and walking scenario (table 1, figure 1, online supplemental appendix 2). Online supplemental videos 1 and 2 show the evolution of accessibility coverage of the ASC network between 2000 and 2013 by mode of transportation.
Supplementary video
Supplementary video
Accessibility coverage of the front-line health facility and ASC networks

Median and interquartile range of the percent of the population within 60 minutes walking of an ASC at commune level (administrative level 3) between 2000-2013 at 100m x 100m resolution. Black lines indicate the median at commune level. Blue boxes represent the interquartile range at commune level. Circles and stars indicate communes outside of the interquartile range. Red lines and percentages indicate the national mean. ASC, Agent de santé communautaire.
Accessibility coverage of the ASC network varied by gender of the ASC and training on specific interventions (table 1, online supplemental appendix 2 and figure 2A–L). Accessibility coverage of the ASC network trained on iCCM was 15.5% in 2013, given a 60-minute cut-off and walking scenario (table 1, figure 2D). The estimated additional contribution of the ASC network and ASC network trained on iCCM to accessibility coverage beyond the accessibility coverage of the existing CSI and CS (without ASC) networks combined, given a 60-minute cut-off and walking scenario, was 12.8% and 11.0%, covering an estimated 2.3 million and 2.0 million additional people, respectively (table 1).

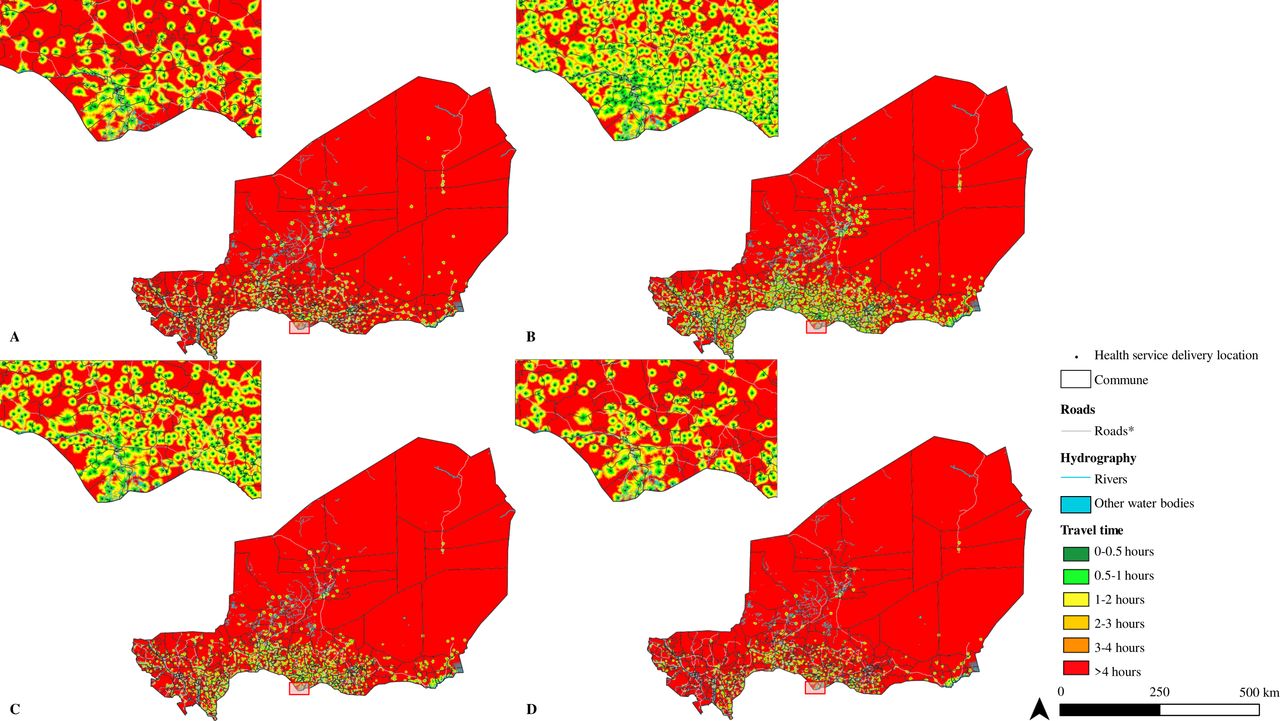
Geographic accessibility (travel time in minutes, walking in dry conditions) in 2013 at 100m x 100m resolution for A) Centre de santé intégrée, n=839; B) Case de santé / Agent de santé communautaire, n=2550; C) Agent de santé communautaire, n=1457; D) and D) Agent de santé communautaire trained on iCCM, n=1214. Inset near Madarounfa commune in Maradi region. *For visualization purposes road classes limited to motorway, trunk, primary, secondary and tertiary. **Other water bodies from landcover layer included permanent water bodies, temporary water bodies and herbaceous wetlands. iCCM, integrated community case managment.
Accessibility coverage in 2013, given a 60-minute cut-off and walking scenario, was 31.1% for the CSI network, 30.5% for the CS-ASC network and 53.7% for the combined CSI+CS-ASC network (table 1 and figure 2A–D). An estimated 8.3 million people (58.2%) remained beyond 60-minute walking to the nearest front-line health facility or ASC, without considering the maximum population capacity of these networks. Accessibility coverage of the CS network was lower when we considered availability of trained human resources (nurse or ASC) and essential commodities (online supplemental appendix 2 and figure 3A–G). Accessibility coverage of all health service delivery networks was higher when considering the walking plus motorised transportation travel scenario (online supplemental appendix 2 and figure 4A–F). We provide detailed results by administrative area in online supplemental appendix 2, tab ‘Detailed_Results’.
Geographical coverage
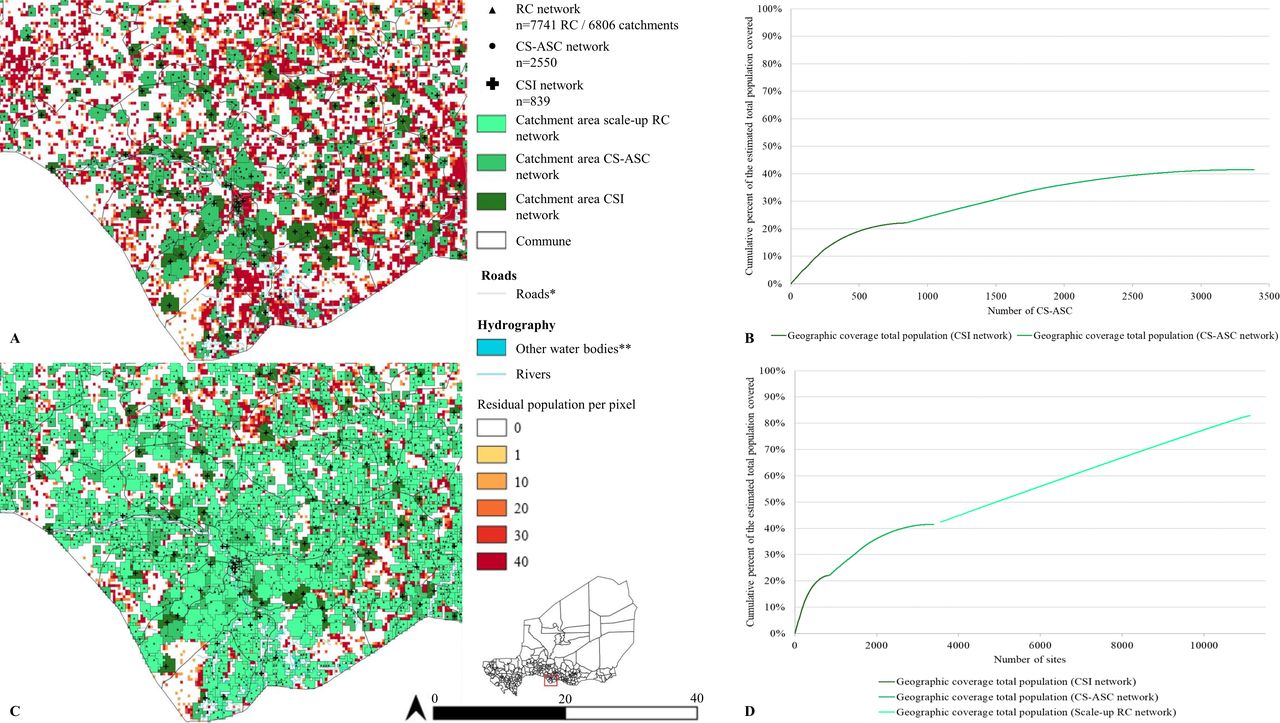
Geographical coverage of the estimated total population in 2013 by the CSI network was 22.1%, assuming a walking scenario with a 60-minute catchment and maximum population capacity of 10 000 per CSI (figure 3 and online supplemental appendix 3, tab ‘Summary’). Geographical coverage of the total estimated population in 2013 by the CS-ASC network was 19.4%, assuming a walking scenario with a 60-minute catchment and maximum population capacity of 2500 per CS-ASC (figure 3, online supplemental figure 3). Geographical coverage of the estimated residual population beyond the geographical coverage of the CSI network in 2013 by the CS-ASC network was 25.8%, providing an estimated 3·5 million additional people with physical access to PHC services, with important variation by region (online supplemental appendix 3, tab ‘Summary’ and online supplemental figure 6). An estimated 58.5% of the population in 2013—10.4 million people, predominantly rural—were beyond the geographical coverage of the combined CSI and CS-ASC networks, with 81.1% of the total uncovered population concentrated in the regions of Zinder, Maradi, Tillabéri and Tahoua (online supplemental figure 6B,C).

A) Geographic coverage at 1km x 1km resolution of the CSI (dark green) and CS-ASC networks (medium green) in 2013, 60-minute catchment (walking scenario), with inset near Madarounfa commune in Maradi region; B) Cumulative percent of the estimated total population covered within a 60-minute catchment, walking scenario (y-axis) by the number of CSI (x-axis, dark green line) and CS-ASC (x-axis, medium green line) at 1km x 1km resolution. C) Geographic coverage at 1km x 1km resolution of the CSI network (dark green), CS-ASC (medium green) and hypothetical scale-up RC network (light green) deployed to optimize geographic coverage of the residual population beyond the geographic coverage of the existing CSI and CS-ASC networks (60-minute catchment, walking scenario) in 2013, with maximum population capacity of 1000 people per RC, n=7741 RC in 6806 locations, and inset near Madarounfa commune in Maradi region; D) Cumulative percent of the estimated total population covered within a 60-minute catchment, walking scenario (y-axis) by the number of CSI (x-axis, dark green), CS-ASC (x-axis, medium green), and hypothetical scale-up RC network (x-axis, light green) at 1km x 1km resolution. The hypothetical scale-up RC network targeted 1km x 1km grid cells with at least 250 people situated beyond the geographic coverage of the existing CSI and CS-ASC networks (60-minute catchment, walking scenario) in 2013. Maximum population capacity was set to 1000 people per RC. CSI, Centre de santé intégrée; CS-ASC, Case de santé and Agent de santé communautaire; RC, Relais communautaire.
Geographical coverage of a hypothetical scale-up network of RC
A hypothetical network of 7741 RC in 6806 catchments with a maximum population capacity of 1000 people per RC, targeting 1×1 km cells with at least 250 people located beyond the geographical coverage of the existing CSI and CS-ASC networks, could cover 76.8% of this estimated residual population—providing physical access to PHC services for an estimated 7.4 million additional people in 2013 (figure 3 and online supplemental appendix 6, tab ‘Summary’). Geographical coverage of the estimated total population would increase from 41.5% covered by the existing CSI and CS-ASC networks to 82.9% by the combined CSI, CS-ASC and hypothetical RC networks in 2013 (online supplemental appendix 4, tab ‘Summary’).
Efficiency of geographical targeting
Geographical coverage of the estimated residual population beyond the geographical coverage of the existing CSI network was 37.0% by the hypothetical CS-ASC network compared with 25.8% by the existing CS-ASC network, covering an estimated 1.5 million additional people—a 43.6% gain in efficiency (figure 4 and online supplemental appendix 5, tab ‘Comparison_Population’). Notably, over one-third (830) of the existing CS-ASC realised less than 30% of their maximum population capacity, indicating redundancy stemming from suboptimal geographical targeting (online supplemental appendix 5, tab ‘rPop13_Existing’). Geographical coverage of the estimated residual under-5 deaths beyond the geographical coverage of the existing CSI network was 50.3% by the hypothetical CS-ASC network compared with 34.2% by the existing CS-ASC network, covering an estimated 11 900 under-5 deaths not otherwise covered—a 47.1% gain in efficiency (figure 4 and online supplemental appendix 5, tab ‘Comparison_U5deaths’). Geographical coverage of the estimated residual Pf malaria cases (all ages) beyond the geographical coverage of the existing CSI network was 50.2% by the hypothetical CS-ASC network compared with 38.0% by the existing CS-ASC network, covering an estimated 737 000 Pf malaria cases not otherwise covered—a 32.3% gain in efficiency (figure 4 and online supplemental appendix 5, tab ‘Comparison_Malaria’). Our uncertainty analysis for the efficiency of geographical targeting indicates bins/groups of CS-ASC catchments with relatively higher efficiency of geographical targeting could be distinguished from bins/groups of CS-ASC catchments with relatively lower efficiency of geographical targeting (online supplemental appendix 6).

Targeting of the existing CS-ASC network compared to hypothetical optimized networks at 1km x 1km resolution. A) Comparison of the percent of the estimated residual population beyond the geographic coverage of the existing CSI network (60-minute catchment, walking scenario) that was covered by the existing CS-ASC network compared to a hypothetical CS-ASC network deployed to optimize geographic coverage of the estimated residual population; B) Comparison of the percent of the estimated residual under-five deaths beyond the geographic coverage of the existing CSI network (60-minute catchment, walking scenario) that was covered by the existing CS-ASC network compared to a hypothetical CS-ASC network deployed to optimize geographic coverage of the estimated residual under-five deaths; C) Comparison of the percent of the estimated residual Pf malaria cases among all ages (0-99 years) beyond the geographic coverage of the existing CSI network (60-minute catchment, walking scenario) that was covered by the existing CS-ASC network compared to a hypothetical CS-ASC network deployed to optimize geographic coverage of the estimated residual Pf malaria cases among all ages (0-99 years). All analyses at 1km x 1km resolution. CS-ASC, Case de santé and Agent de santé communautaire; U5, children under five years of age; Pf, Plasmodium falciparum.
Discussion
Implications for policy
We understand that rational decisions on targeting and scale-up of community health posts and CHWs, like with health facilities, cannot be addressed purely through modelling, as there are many factors involved in the political economy of health system planning and decision-making that are difficult (or impossible) to capture in models.32 33 Nonetheless, in our view modelling can provide useful insight for planning and policy decisions. Below we outline key implications of our analysis for policymakers in Niger, as well as other countries of sub-Saharan Africa, with similar contexts and interest in optimising PHC at community level.
First, scale-up of the community health posts (CS) staffed by paid, full-time CHWs (ASC) greatly improved geographical accessibility of PHC services at community level between 2000 and 2013. Other research has indicated that the expansion of PHC at community level may have contributed to improvements in under-5 mortality and other health outcomes15 16 and still other research has documented the factors that led to the expansion and support for its implementation, including the use of heavily indebted poor countries’ funds to finance the construction of the community health posts under the ‘special programme’ of President Mamadou Tandja, multilateral and bilateral funding to support the monthly payment of CHWs, training and commodities, as well as loans from the World Bank conditional on removal of user fees for children under-5.32 The experience in Niger with the expansion of the community health posts staffed by paid, full-time CHWs may provide an exemplar model from West Africa from which to learn about scaling up PHC at community level.
Second, our results on the efficiency of geographical targeting of the community health post network imply retargeting of community health posts could result in significant improvements in population coverage and cost-savings that could be reinvested in further scale-up and strengthening of the health system, particularly in the regions of Zinder, Maradi, Tillabéri and Tahoua where over 80% of the uncovered population live. That said, we recognise retargeting community health posts (and thereby resources for CHW) may be disruptive and politically contentious. A less disruptive and perhaps more politically feasible option would be to apply the geographical targeting and scale-up approaches we have described here to optimise further scale-up of the community health post network staffed by paid, full-time CHWs and/or scale the volunteer CHW (RC) network. Compared with the status quo planning process, as evidenced by the inefficiency of the existing community health post network, we would anticipate this optimisation of PHC at community level would result in significant improvements in population coverage and cost-savings that could be reinvested in further scale-up and strengthening of the health system.
Regarding further scale-up of PHC services at community level, there are two additional considerations: first, if choosing between scaling the community health post network of paid, full-time CHWs (ASC) and scaling the volunteer CHW (RC) network, a key consideration is that the scope of work of the RC is more restricted than that of the ASC and the populations covered by the RC would still require geographical accessibility to PHC services that are beyond the remit of the RC but within the scope of the ASC. Depending on the package of PHC services at community level being considered, it may be more efficient and prudent from an equity perspective to optimise the scale-up of the network of community health posts with the paid, full-time CHW and progressively upgrade community health posts to referral facilities (CSI), where needed, to enable broadening of the package of services that are geographically accessible to the population rather than scale up the RC network. Second, in our analysis the scaled up RC network targeted grid cells (100×100 m) with at least 250 population beyond the catchment of the existing referral facility (CSI) and community health post (CS) networks and increased geographical coverage of the population from 41.5% to 82.9%. Covering the remaining 15%–20% of the population would require extending geographical accessibility of PHC services at community level to increasingly small, dispersed communities and will be increasingly less efficient and more logistically challenging than covering the first 80% of the population. Other countries with similar contexts in sub-Saharan Africa are likely to face this challenge. Future analysis and research through collaborative, country-led processes should aim to find optimised, context-specific solutions for covering populations at risk of being left behind.
At the time of writing this manuscript, coauthors were working with the MOPH to update this analysis using datasets from 2020 to 2021. However, we anticipate the insights above will remain valid and useful to planners and policymakers in Niger as they prepare a midterm review of the National Community Health Strategy in 2022, develop an investment case for the GFF and develop a new Health Sector Development Plan for 2024–2028. Planners and policymakers in other countries of sub-Saharan Africa with similar contexts, who are interested in optimising PHC at community level, might also benefit from these insights.
Limitations
There are important limitations to this study. First, we did not include secondary or tertiary facilities or outreach/mobile sites. We focused on the question of physical access to PHC at community level through community health posts with CHWs and the first level referral health facilities (to which the former refer), rather than secondary or tertiary health facilities and permanent, fixed service locations rather than periodic, mobile services. Several coauthors are currently working with the MOPH on an update to this analysis that will be inclusive of all facility types and CHWs based on data from 2020 to 2021. Second, our analysis is limited by the completeness and quality of the publicly available data on road and river networks. We acknowledge that more complete and/or accurate government or proprietary road and river network data may be available. For the river network, we acknowledge that some rivers, streams and other waterways may not be perennial barriers to movement. We attempted to mitigate this limitation by allowing major road classes (motorway, trunk, primary, secondary and tertiary) to cross rivers/streams and by incorporating data on the hydrographic network from the high-resolution Copernicus land cover layer21 in our merged land cover layer. We also conducted a sensitivity analysis using only waterways classified as ‘rivers’ in the rivers input layer as barriers to movement and found this made no important difference to the results (online supplemental appendix 2, tab ‘Sensitivity_analysis’). Third, our accessibility coverage, geographical coverage and targeting analyses do not account for uncertainty of the estimates of population. Previous analyses of accessibility coverage and geographical coverage have not uncounted for uncertainty of this kind, but we acknowledge this is an important limitation and area for improving future modelling. Fourth, our analysis does not account for national parks or other ‘no–go’ zones (eg, military bases) due to lack of access to the geography of these objects for 2013. Fifth, our travel speeds were based on estimated travel speeds used in similar analyses for Niger and other countries in sub-Saharan Africa in the dry season.7 28 The travel speeds used in our analysis do not account for travel speeds in the rainy season. This choice was justified given that the rainy season spans only 3–4 months of the year and the effects of the rainy season on geographical accessibility are anticipated to be limited in duration (total seasonal rainfall is estimated to result from only 40–50 rain events of which only 2.4%–4.5% are estimated to be extreme rain events) and geographically localised.34 For these reasons, adjusting the travel speeds to account for the rainy season using a generalised correction factor would be inappropriate. Adequately adjusting the travel speeds would entail use of empirical data and/or expert knowledge at the local level about the effects of rain events on travel speeds (eg, frequency, duration and location of washed-out bridges, flooding, reductions in travel speeds) which was beyond the scope of the current exercise. Our analysis also does not account for differences in travel speeds by population groups (eg, pregnant women, people with illness and caregivers carrying sick children may walk slower than the general population), river transportation, and our walking plus motorised transportation scenario assumes immediate access to a vehicle once a road is reached and does not account for road traffic or factors impacting road traffic (eg, traffic lights). In addition, we did not attempt to account for uncertainty of the travel speed estimates as some analyses have done using an arbitrary, generalised correction factor of ±20%,35 36 because in our view it would be better to use empirical data and/or local expert knowledge on this uncertainty and ascertaining such information was beyond the means of the current analysis. Sixth, our analysis does not account for the possibility of accessing health service delivery locations across national boundaries, an important consideration for cross-border and migrant populations. Seventh, the modelled population counts for 2000–2012 use the High Resolution Settlement Layer population settlement footprint from 2015,25 which may not accurately reflect the population settlement footprint for the early 2000s. Eighth, for our targeting analysis, we resampled the modelled estimates of under-5 mortality rates and Pf incidence from 5 km resolution to 1 km resolution due to lack of estimates at 1 km resolution, effectively assuming the values for these parameters at the finer 1 km resolution. However, this limitation is moot given that the aim of the targeting analysis is to optimise the order of cell prioritisation (which potential location for a community health post should be prioritised over another), cell prioritisation is concerned with the relationship between cells (not the absolute value of cells) and the relationship between cells at 5 km resolution was maintained at 1 km resolution. Lastly, the accuracy of the modelled estimates of under-5 mortality rates26 and Pf malaria incidence27 used in our targeting analysis is unknown. Despite this limitation, results from our uncertainty analysis indicated that our targeting approach could be used to confidently identify bins/groups of health service delivery catchment areas that are relatively more efficient at geographical targeting than other bins/groups—and that this information could be used to optimise geographical targeting of community health posts staffed by CHWs (ASC). An update to this analysis is planned with the MOPH for 2021 and will seek to address the above limitations.
We acknowledge that, in addition to physical accessibility, it is important to consider social and economic barriers to care-seeking (eg, social norms, intrahousehold power dynamics, costs of transportation, opportunity costs of travel time, costs of services and commodities) which may influence access to and use of health services.37 It is also important to consider the quality of health services and the potential for bypassing.38 39 Lastly, predominate modes of transportation may vary by socioeconomic status and geography40 and they may change in response to contextual factors (eg, the lockdowns due to COVID-19 in 2020).
Conclusion
Geographical accessibility of PHC services at community level improved in Niger between 2000 and 2013 through the scale-up of community health posts staffed by paid, full-time CHWs, providing an estimated 2.3 million additional people with physical access to PHC services at community level—including 2.0 million additional people with physical access to iCCM. However, as of 2013, gaps in geographical accessibility remained and efficiency of geographical targeting of community health posts was suboptimal. The approaches to geographical targeting and scale-up described here could be useful for optimising geographical accessibility to PHC services at community level in Niger and similar contexts of sub-Saharan Africa.
Data availability statement
Data are available in a public, open access repository under the Creative Commons Attribution 4.0 Unported (CC BY 4.0) licence, which permits others to copy, redistribute, remix, transform and build upon this work for any purpose, provided the original work is properly cited, a link to the licence is given, and indication of whether changes were made. See: https://creativecommons.org/licenses/by/4.0/. Supplemental appendices 2–6, videos 1–2, and all model outputs are available in supplemental appendix 1b at https://doi.org/10.5281/zenodo.4428176. All model inputs (except existing service delivery locations) are available in supplemental appendix 1c at https://doi.org/10.6084/m9.figshare.13536779.v6. Health service delivery location data are only available through data sharing agreements with UNICEF and the Ministry of Public Health of Niger.
Ethics statements
Ethics approval
The 2013 georeferenced census of health service delivery networks (CSI, CS and ASC)19 was conducted by the National Statistics Institute of Niger and the MOPH in the context of management of the public health sector and did not require ethical approval. The protocol for secondary analysis of the 2013 census of CSI, CS and ASC was approved by the Ethics Committee of the University of Western Cape (Registration no: 15/7/271).
Acknowledgments
This work would not have been possible without the efforts of the many people who contributed to the first georeferenced census of CSI, CS and ASC led by the INS, the Ministry of Public Health of Niger and UNICEF in 2013.
References
Supplementary materials
Supplementary Data
This web only file has been produced by the BMJ Publishing Group from an electronic file supplied by the author(s) and has not been edited for content.
Footnotes
Handling editor Sanni Yaya
Contributors NPO was responsible for the study conceptualisation, methodology, data curation and writing the draft manuscript. OH, IM, KB, AYG, NPO and NR collected data or provided feedback on data. NPO, NR and ZS conducted the formal analysis and were responsible for data visualisation. NPO, NR and TD verified the underlying data. TD, DJ and NR provided supervision and overall guidance. All authors contributed to reviewing and editing the manuscript.
Funding The time of TD and SM was supported by the South African Medical Research Council.
Disclaimer The views expressed in this article are the authors’ views and do not necessarily represent the views, positions or policies of the institutions with which the authors are affiliated.
Map disclaimer The depiction of boundaries on the map(s) in this article does not imply the expression of any opinion whatsoever on the part of BMJ (or any member of its group) concerning the legal status of any country, territory, jurisdiction or area or of its authorities. The map(s) are provided without any warranty of any kind, either express or implied.
Competing interests NPO reports grants (salary support) from Bill and Melinda Gates Foundation (BMGF), outside the submitted work.
Provenance and peer review Not commissioned; externally peer reviewed.
Supplemental material This content has been supplied by the author(s). It has not been vetted by BMJ Publishing Group Limited (BMJ) and may not have been peer-reviewed. Any opinions or recommendations discussed are solely those of the author(s) and are not endorsed by BMJ. BMJ disclaims all liability and responsibility arising from any reliance placed on the content. Where the content includes any translated material, BMJ does not warrant the accuracy and reliability of the translations (including but not limited to local regulations, clinical guidelines, terminology, drug names and drug dosages), and is not responsible for any error and/or omissions arising from translation and adaptation or otherwise.