Article Text

Abstract
Introduction To present an analysis of the Brazilian health system and subnational (state) variation in response to the COVID-19 pandemic, based on 10 non-pharmaceutical interventions (NPIs).
Materials and methods We collected daily information on implementation of 10 NPI designed to inform the public of health risks and promote distancing and mask use at the national level for eight countries across the Americas. We then analyse the adoption of the 10 policies across Brazil’s 27 states over time, individually and using a composite index. We draw on this index to assess the timeliness and rigour of NPI implementation across the country, from the date of the first case, 26 February 2020. We also compile Google data on population mobility by state to describe changes in mobility throughout the COVID-19 pandemic.
Results Brazil’s national NPI response was the least stringent among countries analysed. In the absence of a unified federal response to the pandemic, Brazilian state policy implementation was neither homogenous nor synchronised. The median NPI was no stay-at-home order, a recommendation to wear masks in public space but not a requirement, a full school closure and partial restrictions on businesses, public transportation, intrastate travel, interstate travel and international travel. These restrictions were implemented 45 days after the first case in each state, on average. Rondônia implemented the earliest and most rigorous policies, with school closures, business closures, information campaigns and restrictions on movement 24 days after the first case; Mato Grosso do Sul had the fewest, least stringent restrictions on movement, business operations and no mask recommendation.
Conclusions The study identifies wide variation in national-level NPI responses to the COVID-19 pandemic. Our focus on Brazil identifies subsequent variability in how and when states implemented NPI to contain COVID-19. States’ NPIs and their scores on the composite policy index both align with the governors’ political affiliations: opposition governors implemented earlier, more stringent sanitary measures than those supporting the Bolsonaro administration. A strong, unified national response to a pandemic is essential for keeping the population safe and disease-free, both at the outset of an outbreak and as communities begin to reopen. This national response should be aligned with state and municipal implementation of NPI, which we show is not the case in Brazil.
- COVID-19
- health policy
- qualitative study
- descriptive study
Data availability statement
Data are available on request. For data request, please contact the corresponding author. All data and replication code will be made publicly available on our site (observcovid.miami.edu) as well as a dedicated repository (Harvard Dataverse) on publication.
This is an open access article distributed in accordance with the Creative Commons Attribution Non Commercial (CC BY-NC 4.0) license, which permits others to distribute, remix, adapt, build upon this work non-commercially, and license their derivative works on different terms, provided the original work is properly cited, appropriate credit is given, any changes made indicated, and the use is non-commercial. See: http://creativecommons.org/licenses/by-nc/4.0/.
Statistics from Altmetric.com
Key messages
What is already known?
Latin America is the global epicentre of the COVID-19 pandemic, and Brazil is the epicentre of the epicentre.
Non-pharmaceutical interventions to combat COVID-19 vary widely across countries.
What are the new findings?
Our data demonstrate that Brazil mounted a slow, limited federal response to COVID-19 compared with other countries in the region.
Subnational governments petitioned to fill the void, but we show that their responses vary greatly in terms of the type, timing and rigour of policy implementation to combat COVID-19.
Patterns of governors’ ideological alignment with President Bolsonaro and their subsequent policy responses showcase the challenges of implementing subnational public health policy during the COVID-19 pandemic.
Opposition governors implemented earlier, more stringent sanitary measures than those affiliated with the Bolsonaro administration.
What do the new findings imply
Evaluating national responses to COVID-19 will likely be insufficient for understanding the efficacy of different NPIs.
State government responses in Brazil and elsewhere will provide crucial insights for future work to understand disease burden and control disease spread at both the state and national levels throughout Latin America and around the world.
Introduction
The COVID-19 pandemic arrived in Latin America after the first wave in Europe, Canada and the USA.1 2 Latin America was hit later, but by June, it had become a global hotspot.3–6 By early August, Latin America and the Caribbean had broken 5 million COVID-19 cases, with Brazil driving the regional surge. Brazil, the region’s largest and most populous country, now has the world’s second highest death toll, behind only to the USA.7 8 Since July 2020, the country has averaged over 800 deaths per day.7 8
The contemporary Brazilian health system emerged from democratisation in the 1980s and major public health reforms in the 1990s. The 1988 Constitution created the Sistema Único de Saúde (SUS), which guaranteed universal access to healthcare and gave responsibilities for financing and service delivery to federal, state and municipal governments. The national Ministry of Health coordinates the SUS at the national level, which entails developing policy, planning, providing most of the financing and evaluating programmes. However, the system emphasises decentralisation: municipalities deliver free, comprehensive services to residents and visitors at the local level. State and federal transfers finance these services. States also have roles in the SUS, including coordinating strategic programmes and delivering specialised services. States also supplement municipal and federal costs for expensive treatments and lead regional governance initiatives.9
Brazilian state governments drew on their regional governance duties, their coordination of strategic programmes and their responsibility for specialised services to request formal responsibility for combating the COVID-19 pandemic after the Ministry of Health failed to develop, implement or finance a national policy. A ruling by Brazil’s Supreme Court in June 2020 formalised this responsibility at the request of the states.10–15 The ruling found that, absent an approved vaccine,16 public policy measures implemented by state and municipal governments will be decisive in combating the pandemic and allowed them to impose restrictions over the objections of the Jair Bolsonaro administration.
The WHO provides guidelines to help governments adopt non-pharmaceutical intervention (NPI) to slow COVID-19, drawn from evidence for the effectiveness of masks, hygiene measures and physical distancing to decrease the rate of infection.17–24 Brazil’s states varied in their capacity and decisiveness in following these mandates. Many delayed adopting NPI, waiting weeks from the first case in the country, with considerable heterogeneity in terms of the timing, type and rigour of implementation of NPIs. This variation negatively impacted the efficacy of public policy in reducing population mobility and the opportunities for reopening safely following lockdowns.25–27
In this paper, we first present data on national-level NPI responses to the COVID-19 pandemic for eight countries in the Americas to contextualise the Brazilian response: Argentina, Bolivia, Brazil, Chile, Colombia, Ecuador, Mexico and Peru. Prior to the pandemic, developing, financing, coordinating and implementing policies to contain national threats were the full responsibility of the national government under Brazil’s national health system. However, the data show Brazil’s national response as the least stringent among the countries analysed. Hence, understanding state-level NPI in Brazil will be critical for understanding the spread of the disease and for future opportunities to bring it under control. We therefore describe the results of Brazil’s 27 states’ efforts to control the spread of COVID-19. The purpose of this article is to present original data on the adoption of 10 NPI over time and to different degrees by Brazilian states: (1) school closures, (2) workplace closures, (3) public event cancellations, (4) public information campaigns, (5) public transit closures, (6) internal travel controls, 7) international travel restrictions, (8) stay-at-home orders, (9) restrictions on gathering size and (10) the mandatory use of masks.
We analyse each of the NPI at the state level, individually and using a composite Public Policy Index. The data begin with Brazil’s first confirmed COVID-19 case on 26 February 2020 and continue through 29 October 2020. These data allow us to assess government responses to the pandemic at the state level, which is the first for Latin America and the Global South.
Assessing government responses in Brazil offers critical lessons for countries around the world for this and future pandemics. Most prominently, leaving public health policy to state and municipal governments without experience, capacity or financing creates a patchwork of subnational pandemic responses that may prolong the public health crisis and exacerbate its impact.
Background
Despite substantial improvements in access to primary, emergency and prenatal care, cracks in Brazil’s health system have been evident for over a decade.28 29 The COVID-19 pandemic has stretched a precarious health system even further.
In Brazil, health is enshrined in the constitution as a citizen’s right. The Brazilian national health system, SUS, espouses a vision of ‘health for all’. From the late 1980s to the early 2000s, Brazil made great strides towards achieving universal health coverage.30–32 However, years of political and economic turmoil have led to a much weaker set of health and social supports. Large disparities remain in access to care and health outcomes, with poorer regions and groups at the greatest disadvantage.33 34 These disparities have grown over time, with already low investment in the healthcare system exacerbated by recent austerity measures under both President Bolsonaro and his predecessor Michel Temer.33 35
Since 2016, Brazil’s federal government has withdrawn support for the SUS and one of its central programmes, the Programa Saúde da Família—established in 1994 as a community-based approach to primary healthcare—along with the innovative social welfare programme Bolsa Família. In 2016, Temer’s health ministry took steps to scale back the universal healthcare system at the height of the Zika crisis, with legislation freezing all health funding for 20 years. Two years later, Bolsonaro assured voters on the campaign trail that he would not abolish Bolsa Família, a conditional cash transfer programme that has been shown to reduce extreme poverty, inequality and hunger while improving health.28 29 36 37 Yet, the number of new families receiving benefits from the programme decreased by two orders of magnitude within the first 6 months of the Bolsonaro presidency.38
The COVID-19 pandemic has stretched a precarious health system even further. A policy ‘vacuum’ at the federal level forced state governments to petition the Supreme Court to gain authority for reducing disease spread.39 States’ newfound independent authority then led to varied responses across multiple public policy areas. State governments are responsible for relatively few aspects of health service delivery under normal conditions; the national Ministry of Health provides primary funding, coordination and planning, while the municipalities deliver services. For the most fundamental public interventions to control the pandemic—the measures to promote physical distancing and containment of COVID-19—state action was neither consistent nor synchronised.
The distribution of NPI we describe above does not imply that states with more forceful public policy responses necessarily have the lowest numbers of cases and deaths. Residents of low-income neighbourhoods and poor, densely populated states in the northeast are at high risk to contract and die from the disease, given the impossibility of physical distancing in many cases.40–42 Moreover, the COVID-19 pandemic potentially exacerbates these states’ lower capacity to administer healthcare that predates the public health crisis. Finally, significant racial/ethnic and regional variations in COVID-19 cases and mortality underscore the health and racial inequalities seen in these regions and the country more broadly.33 41 43–45
Materials
Variables that characterise public health policies
We analysed 10 NPIs related to physical distancing and containment of SARS-CoV-2 in eight countries at the national level as well as in each of Brazil’s 26 states and the federal district. Our data begin on 26 February 2020, the date of Brazil’s first reported case. We begin by following the Oxford COVID-19 Government Response Tracker V.5.0,46 which records data on countries’ responses to the pandemic at the national level. We then adjust each variable to reflect state-level public policy implementation in Brazil. We focus on indicators specific to mobility restrictions and containment of the virus, such as stay-at-home orders, school and workplace closures, transportation and travel restrictions and requirements to wear masks. In turn, these measures will likely be decisive in explaining the health impact of such policies in terms of COVID-19 cases and deaths.40
In coding, we examined whether each policy was in effect each day, from the date of the first case detected in the country. If a measure was in effect, we coded its application as partial or total, to record the policy’s rigour. Finally, we weigh the timeliness of each policy’s implementation, determined by the date of its adoption relative to the first case in the country.
Online supplemental table 1 describes the 10 variables and their possible values.1 We assign several discrete levels to the variables to achieve greater granularity in the analysis. The variables ‘school closings’, ‘suspension of work’, ‘cancellation of public events’ and ‘suspension of public transport and/or closure of public transport systems’ are categorical and take values of 0 when not implemented, 0.5 for partial implementation and 1 for total implementation.
Supplemental material
The variable ‘development of information campaigns’ records whether such a campaign exists, providing information to the public about the virus, the disease, its consequences and containment measures. It takes a value of 0 for no campaigns, 0.5 for only a federal campaign and 1 when a state implements its own campaign. The variable ‘travel restrictions within the state’ registers the implementation of internal movement restrictions in the state, such as bans on interstate and intercity travel. It takes values of 0 when there are no restrictions, 0.5 when restriction of movement is recommended and 1 when the state restricted all movement.
The variable ‘international travel control guideline’ records international movement restrictions, taking a value of 0 when no action was taken, 0.33 when only screening and/or monitoring is applied to international travellers, 0.66 when mandatory quarantines are required for travellers in high-risk regions and 1 when the state implements a travel ban to and from high-risk regions. States without a seaport, international airport or border receive the value of the national mean for this variable so as not to penalise them for their lack of points of entry.
The ‘stay-at-home order’ measures requirements to shelter in place or confine oneself to the home and takes a value of 0 when no order was issued, 0.33 when the state recommends not leaving the house, 0.66 when the instruction is not to leave the home except in ‘essential’ cases and 1 when the lockdown is complete or requires not leaving the home with minimal exceptions. The variable ‘restrictions on the size of gatherings’ refers to the cut-off size on the prohibitions of private gatherings, taking a value of 0 in the absence of any gathering size restriction, 0.25 when events of more than 1000 people are prohibited, 0.5 when events of more than 100 people are banned, 0.75 when gatherings of more than 50 people are banned and 1 when only gatherings of 10 people or less are permitted.
We also include a variable to describe mask mandates in each state. This variable takes a value of 0 if no mask requirement is in place for people in public places, 0.5 when mask use is recommended or only required in certain locations and 1 when states implement a full mask mandate. WHO did not release general guidance about the use of face coverings by the public until 5 June 2020.9 47 However, many countries, and individual states, began recommending or requiring their use months earlier.
Public Policy Index
We generated an index composed of nine of the ten variables above to effectively compare public policy implementation at the subnational level. This index summarises the actions of state governments to inform the public and restrict its movement. We keep the mask mandate variable separate, because the evidence and recommendations became available later and states began implementing mandates to help manage the reopening following restrictions on movement.2
The index is constructed as presented in equation 1:
Whereby:
 = Public Policy Adoption Index in country/state i in time t.
Ij=Public Policy Index j, where j ranges from 1 to n=9.
Dt=Days from the first registered case until time t.
dt=Days from the implementation of policy j until time t.
The  is constructed as the sum of each of the values of the nine variables weighted by the day of implementation of each in relation to the appearance of the first case. The index gives greater weight to early implementation relative to the first case in the country. As such, the index acquires higher values the earlier a policy has been implemented.
The ratio  is continuous and goes from zero, when policy j has not yet been implemented in state i at time t, up to one, in instances where public policy has been implemented at the same time t in which the first case appears. This makes it possible to take into account that public containment policies have less effect on containing the virus the later they are adopted. To this end, we raise the ratio
  to the power 0.5, to reflect decreasing policy efficacy with delays in policy implementation. For more detail, please review the methodological appendix.
In the aggregate, each country and state i receive a daily score between 0 and 10, which reflects the sum of the different policy dimensions, and then normalised to 100. The maximum value of the index is 100, but obtaining a score of 100 would not be realistic or even desirable because it would imply a total closure of the state the day after the first case in the country.
Finally, we also compile Google data on population mobility by state to describe changes in mobility throughout the COVID-19 pandemic. Google uses Global Positioning System (GPS) chips in users’ phones to track their movement and reports anonymised data on population mobility relative to 2 weeks prior to the first case in the country by state.48
Sources of information
We gathered data from three types of publicly available sources. First, we reviewed official government websites and state registers for each of the 26 states and the federal district, to capture laws, decrees and news items specifying implementation of each public policy variable. Then, we cross-referenced this material against multiple news outlets’ database of Brazilian state laws and decrees. Finally, we gathered information on policy implementation shared by public representatives on official state social media accounts, primarily Facebook. We programmed a web scraper in Python using WebScrapy to collect these materials. The data that we present in this article are from 26 February 2020 to 29 October 2020.
A double-blind review was carried out by two of the authors to ensure the quality of the data. The double-blind review first consisted of randomly selecting members of the group to review randomly selected scores from among those that others coded. Next, these coders recoded data for those states without having seen the original scores. The second coder did not know who coded the original data, and the original coder did not know who would do the review. In cases of discrepancy, the whole working group deliberated on the coding until consensus was reached.
The full list of sources by state is presented in the appendix.
Patient and public involvement
No patients were involved in this study.
Results
Figure 1 presents a graph of the Public Policy Index at the national level for Argentina, Bolivia, Brazil, Chile, Colombia, Ecuador, Mexico and Peru.
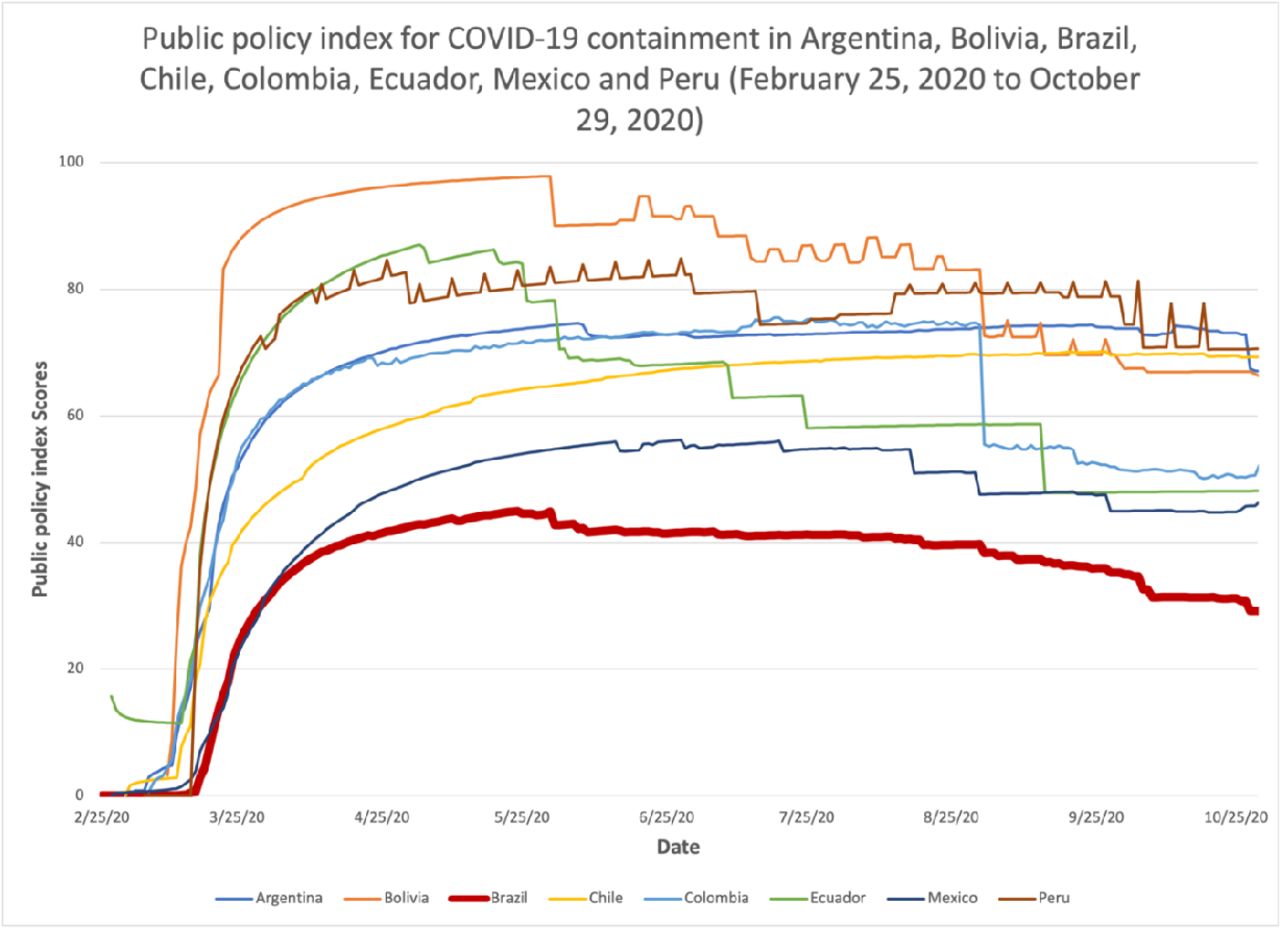
This shows Brazil as the country with the least stringent national response over the course of the COVID-19 pandemic.
Figure 2 presents a plot of the Public Policy Index for Brazil by state, from 26 February 2020 to 29 October 2020.3 We find that no Brazilian state implemented comprehensive containment policies, though some implemented more policies than others. The development of information campaigns was the most frequently implemented public policy across the states, with the least amount of variation among them. The national weighted mean for this variable is 0.89, out of a possible score of 1, with 181 days of implementation. However, the variable ranges from 0.67 with 136 days of implementation in Acre to 0.92 and 187 days in Tocantins. This indicates that the vast majority of Brazilian states launched public information campaigns roughly 3 weeks after the first case in the country.

This provides an illustrative description of the timing and rigour in the adoption of policies at the state level in Brazil during the pandemic. The graph reflects great heterogeneity in the timing of policy implementation to mitigate the spread of COVID-19. Some states such as Rondônia, the federal district, Pernambuco and Tocantins were the first to introduce policies for the containment of the virus. Other states such as Mato Grosso do Sul, Acre, Mato Grosso and Paraíba acted later, although the differences in the timing of implementation are much smaller than the differences in the number of policies adopted and the intensity of implementation.
School closures are the second most frequently implemented policies, with a national score of 0.86 (out of 1) and 181 days of implementation, followed by the cancellation of public events, with 0.76 and 163 days of implementation.
Stay-at-home orders were the least frequently implemented public policy, which only reached a national level of 0.02 and 6 days of implementation, but with greater variation, ranging from 0 in 20 states, and therefore 0 days of implementation, to 0.16 in Ceará and 63 days of implementation. The second and third least implemented measures were the suspension of public transportation, with a mean score of 0.05 and 17 days of implementation, and the introduction of international travel controls, with a mean score of 0.06 and 19 days.
All Brazilian states implemented a mask mandate in some form, primarily between mid-April and mid-May. Notably, mask mandates preceded the WHO’s guidelines, which did not officially recommend the use of face masks for the general public until 5 June. The values range from 0.20 in Mato Grosso do Sul to 0.63 in Bahia, the state with the highest score. Following Bahia is Santa Catarina, with 0.58, and Sergipe with 0.53. The national mean for this variable was 0.47.
The correlation of each of the 10 individual public policy indicators in the observed period (from 26 February to 29 October) was very high, ranging from 0.64 to 0.86. The use of face masks behaves differently from the other measures, as expected. This is because mask recommendations or requirements in Brazil are a feature of the reopening and are not designed to restrict movement. They were implemented much later than the other indicators we collect and with much less rigour.
Results across states
We compare the timing and rigour of NPI across Brazilian states through the cumulative, 7-day moving average for the entire period as the indicator of the accumulated trend during the 226 days of the pandemic considered in our analysis. Rondônia is the state with the highest mean index score (0.46), followed by Bahia (0.42), Alagoas (0.41), Rio Grande do Norte (0.41) and Pernambuco (0.40). On the opposite end of the spectrum, the states with the lowest mean index scores were Mato Grosso do Sul (0.17), followed by Tocantins (0.23), Acre (0.27), Mato Grosso (0.27) and Maranhão (0.30). The national mean for the period under investigation reached a level of 0.44 at its highest point.
Timing and rigour of policy implementation
As shown, there are very significant differences among states. The mean index for the state with the highest score is 2.5 times greater than the index for the state with the lowest score.
Rondônia, Bahia and Alagoas implemented public policy measures with the greatest rigour. Mato Grosso do Sul, Acre and Mato Grosso implemented the fewest policies with the least rigour. It is worth noting that the variance has increased during the timeframe reported here, indicating that the difference between states in terms of the number of public policy measures implemented and the rigour of implementation increased over time.
Minas Gerais and São Paulo implemented fewer NPI with less rigour than other states at the beginning of the pandemic in March and April but improved relative to other states by July. Many states improved at the beginning of the pandemic and then relaxed restrictions as they reopened in June. Acre went from the lowest performing state on the index in April to slightly below the national mean at the beginning of July before returning to the bottom quartile of the distribution in September. This speaks to two phases of the COVID-19 pandemic in Brazil: a first phase prior to 1 June, where most state governments imposed public policy measures to restrict movement, and a second phase after 1 June, with relaxed restrictions.
Finally, figure 2 shows how most states had already begun to relax their policies beginning in May and June, especially restrictions on public transportation, workplace closures and stay-at-home orders, which was reflected in a drop in their overall scores on the Public Policy Index. This relaxation continued through July, August and September, with September scores for most states falling to levels not seen since April, when COVID-19 cases and deaths were much lower.
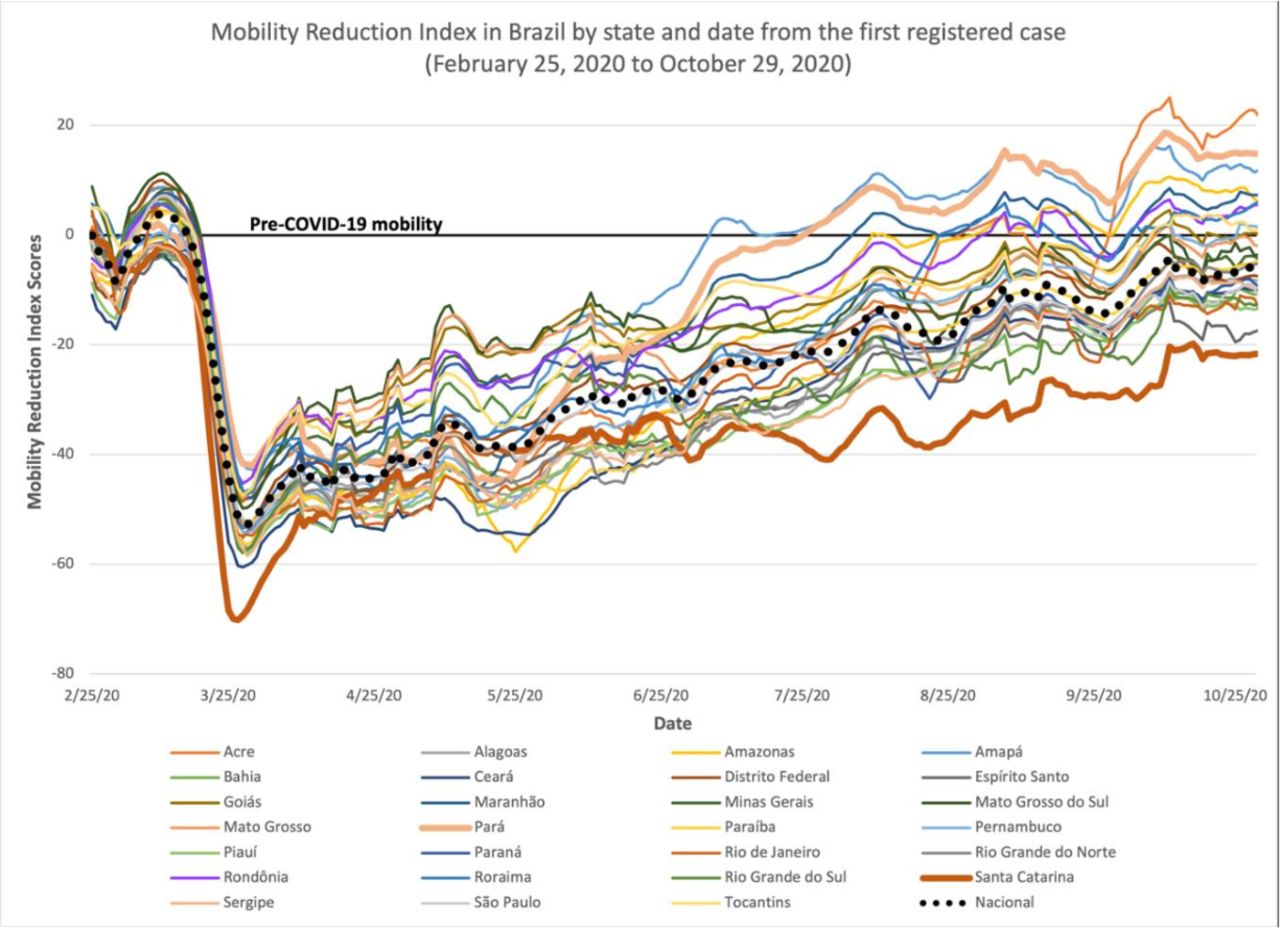
States’ NPI scores do not correlate with the burden of disease due to COVID-19 and are robust to the exclusion of the mask mandate in the construction of the index. Moreover, the results are robust to the exclusion of the weighting scheme surrounding the timing of the policy interventions. The cumulative, unweighted index scores demonstrate similar differences across states to those generated through the weighted index. We present a correlation matrix showing the similarities between weighted and unweighted scores in online supplemental table 5. Figure 3 below reports mobility data by state over the course of the pandemic.

This presents data on population mobility by state, beginning 2 weeks prior to the first reported case in the country as a baseline. Mobility fell sharply as states implemented measures restricting movement but rose steadily beginning in April as governments relaxed restrictions, even as cases and deaths spiked. as of 15 September, the population of Amazonas was 25% more mobile than 2 weeks prior to the first case in the country. The national average for mobility has returned to exactly the same level of mobility as prior to the pandemic. Once again, population mobility reflects two distinct phases of the pandemic: phase 1, in March, April, and May, when population mobility fell well below normal, and phase 2, where some states’ mobility had returned to prepandemic levels as early as July.
The subnational data across Brazil demonstrate that Brazilians experienced different pandemics, depending on the state they lived in. While some states issued lockdowns and drastically restricted citizens’ movement, others had almost no restrictions in place. In the following section, we discuss how allegiance or opposition to President Bolsonaro correlates with states’ policy decisions.
Discussion
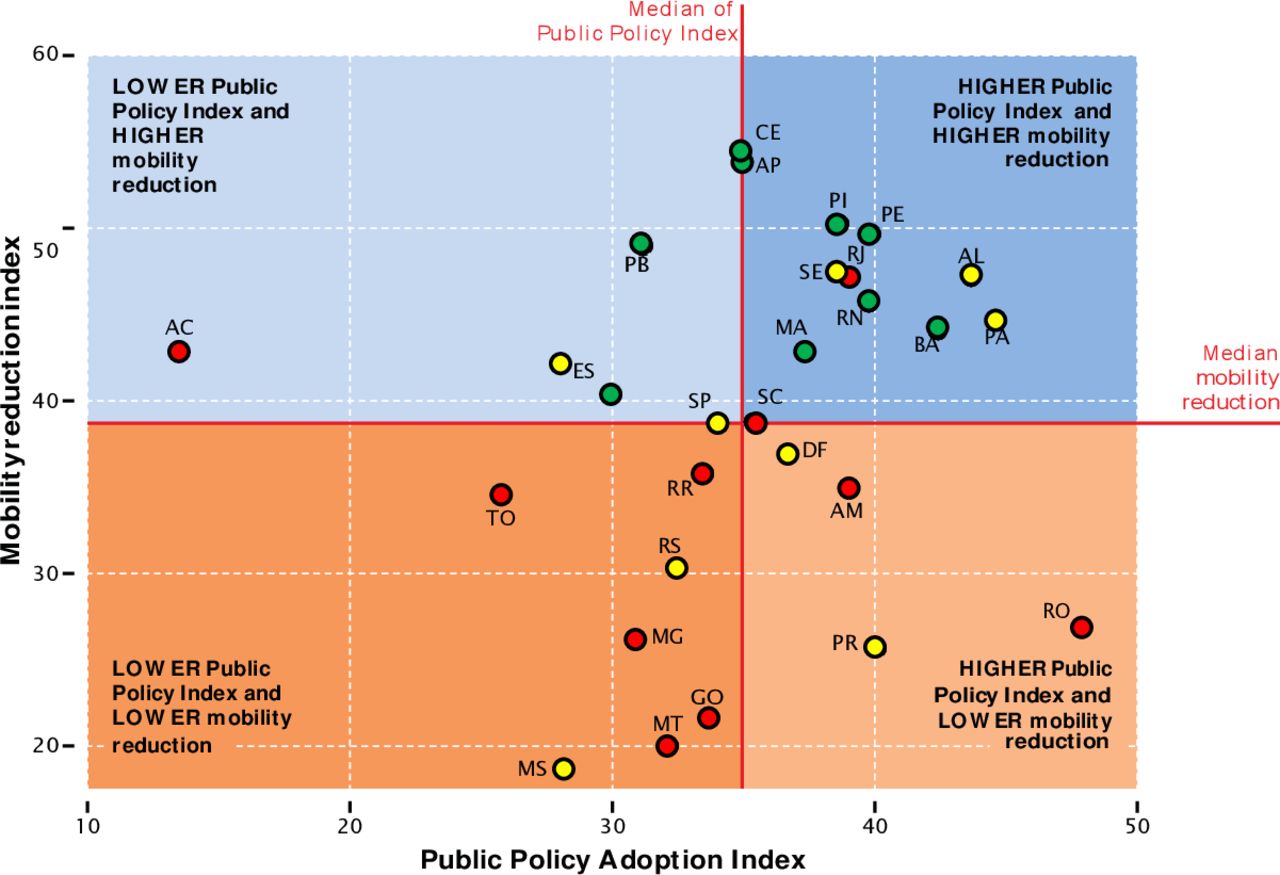
Figure 4 depicts the relationship between our Public Policy Index, population mobility and state governors’ political ideology: the states in green have governors on the left or center-left and are in the political opposition. These states are clustered together at the higher levels of our index measuring the public policy response and have most reduced population mobility. The states in red have governors on the right or center-right, most of whom are aligned with President Bolsonaro, on the political right. These states have the lowest scores on our policy index and lowest reduction in population mobility. States in yellow have centrist governors, and their states rank in the middle for our policy index and population mobility.

Public Policy Index, population mobility and governors’ political ideology
Our Observatory for the Contention of COVID-19 in the Americas also (observcovid.miami.edu) tracks subnational public policy responses across the Americas. Our analysis of the Mexican national response is that it has also been slow and limited when compared with Brazil, but the partisan patterns at the subnational level are not as clear-cut. By comparison, we also see subnational variation in Canada in terms of number, type and rigour of policy implementation, Yet, Canada initiated a prompt and stringent pandemic response at the national level and, notably, has federal support for provinces’ COVID-19 containment measures.49
Limitations
This paper presents descriptive research drawing on data collected in real time during the COVID-19 pandemic. Many initial restrictions that governments implemented were more prominently reported than a relaxation of those restrictions. It is therefore possible that we overlooked announcements not included in government publications or covered by news outlets in some cases. Furthermore, variability in how states report and describe policy measures could have impacted our coding and therefore our analysis. Possible sources of bias from these reports included vague language in state decrees, delays in posting decrees on government websites, failure to post decrees on websites and failure to update websites when decrees were relaxed, abandoned or reimplemented.
We maintained careful documentation of sources, cross-checked data and documented all precedent-setting coding decisions to minimise such inconsistencies. Data included herein reflect the information available at the time of manuscript submission; new information is emerging rapidly during the pandemic, and states’ trajectories could shift over time. Research in Brazil has also shown substantial differences in testing, diagnosis and healthcare access by socioeconomic status.33
It is important to note that the NPIs we observe do not correlate with the burden of disease from COVID-19, based on available data. Online supplemental table 4 shows a weak negative correlation between deaths per 100 000 population and policy index scores lagged 2 weeks. However, we face a challenge in assessing the potential relationship between burden of disease and NPI due to lack of COVID-19 testing. Brazil administered 52 tests per 100 000 residents compared with Chile at over 270 (Institute for Health Metrics and Evaluation (IHME) 2021). Adjusting policy appropriately to outbreaks would therefore require mortality data, which lags several weeks behind cases. The very weak negative correlation between mortality and NPIs suggests that state-level NPI was not evidence-based because the country was not collecting evidence through widespread testing, nor were governments responding to mortality. In contrast, correlations between NPI scores and mortality that lagged 2 weeks are negative and statistically significant.
Testing causal hypotheses connecting NPI to cases and deaths is beyond the scope of this paper, but we anticipate taking this step once more accurate subnational data become available.
Conclusion
Our data demonstrate that Brazil mounted a slow, limited federal response to COVID-19 compared with other countries in the region. Subnational governments petitioned to fill the void, but we show that their responses vary greatly in terms of the type, timing and rigour of policy implementation to combat COVID-19.
Patterns of governors’ ideological alignment with President Bolsonaro and their subsequent policy responses showcase the challenges of implementing subnational public health policy during the COVID-19 pandemic. Opposition governors implemented earlier, more stringent sanitary measures than those affiliated with the Bolsonaro administration.
Evaluating state government responses in Brazil and elsewhere will provide crucial insights for future work to understand disease burden and control disease spread at both the state and national levels throughout Latin America and around the world.
Data availability statement
Data are available on request. For data request, please contact the corresponding author. All data and replication code will be made publicly available on our site (observcovid.miami.edu) as well as a dedicated repository (Harvard Dataverse) on publication.
References
Supplementary materials
Supplementary Data
This web only file has been produced by the BMJ Publishing Group from an electronic file supplied by the author(s) and has not been edited for content.
Footnotes
Handling editor Seye Abimbola
Twitter @harreolao, @marcofaganello
Collaborators Salvador Acevedo Gómez, Raymond Balise, Miguel Betancourt Cravioto, Layla Bouzoubaa, Karen Jane Burke, Alberto Cairo, Carmen Elena Castañeda Farill, Fernanda Da Silva, Daniel Alberto Díaz Martínez, Javier Dorantes Aguilar, Ariel García Terrón, L. Lizette González Gómez, Kim Grinfeder, Héctor Hernández Llamas, Sallie Hughes, Karen L. Luján López, Lenny Martínez, Víctor Arturo Matamoros Gómez, Cesar Arturo Méndez Lizárraga and Gerardo Pérez Castillo.
Contributors Dr MT developed the manuscript. The rest of the coauthors made equal contributions regarding the analysis and writing.
Funding The authors have not declared a specific grant for this research from any funding agency in the public, commercial or not-for-profit sectors.
Competing interests None declared.
Provenance and peer review Not commissioned; externally peer reviewed.
Supplemental material This content has been supplied by the author(s). It has not been vetted by BMJ Publishing Group Limited (BMJ) and may not have been peer-reviewed. Any opinions or recommendations discussed are solely those of the author(s) and are not endorsed by BMJ. BMJ disclaims all liability and responsibility arising from any reliance placed on the content. Where the content includes any translated material, BMJ does not warrant the accuracy and reliability of the translations (including but not limited to local regulations, clinical guidelines, terminology, drug names and drug dosages), and is not responsible for any error and/or omissions arising from translation and adaptation or otherwise.
↵Online supplemental table 2 describes sociodemographic, economic and political statistics by state.
↵Including the mask mandate in the calculations of the Public Policy Index does not alter the results across states.
↵Online supplemental table 3 presents the raw data for each state.