Article Text

Abstract
The proliferation of composite data sources tracking the COVID-19 pandemic emphasises the need for such databases during large-scale infectious disease events as well as the potential pitfalls due to the challenges of combining disparate data sources. Multiple organisations have attempted to standardise the compilation of disparate data from multiple sources during the COVID-19 pandemic. However, each composite data source can use a different approach to compile data and address data issues with varying results.
We discuss some best practices for researchers endeavouring to create such compilations while discussing three key categories of challenges: (1) data dissemination, which includes discrepant estimates and varying data structures due to multiple agencies and reporting sources generating public health statistics on the same event; (2) data elements, such as date formats and location names, lack standardisation, and differing spatial and temporal resolutions often create challenges when combining sources; and (3) epidemiological factors, including missing data, reporting lags, retrospective data corrections and changes to case definitions that cannot easily be addressed by the data compiler but must be kept in mind when reviewing the data.
Efforts to reform the global health data ecosystem should bear such challenges in mind. Standards and best practices should be developed and incorporated to yield more robust, transparent and interoperable data. Since no standards exist yet, we have highlighted key challenges in creating a comprehensive spatiotemporal view of outbreaks from multiple, often discrepant, reporting sources and provided guidelines to address them. In general, we caution against an over-reliance on fully automated systems for integrating surveillance data and strongly advise that epidemiological experts remain engaged in the process of data assessment, integration, validation and interpretation to identify, diagnose and resolve data challenges.
- COVID-19
- epidemiology
- public health
Data availability statement
Data is available in a public, open access repository at https://data.humdata.org/organization/metabiota
This is an open access article distributed in accordance with the Creative Commons Attribution Non Commercial (CC BY-NC 4.0) license, which permits others to distribute, remix, adapt, build upon this work non-commercially, and license their derivative works on different terms, provided the original work is properly cited, appropriate credit is given, any changes made indicated, and the use is non-commercial. See: http://creativecommons.org/licenses/by-nc/4.0/.
Statistics from Altmetric.com
Summary box
Epidemiological data are not standardised, leading to challenges in combining, comparing or interpreting data from multiple reporting agencies.
Experience in addressing data challenges has led to a methodology for identifying and addressing these inconsistencies.
Improvements to epidemiological data standards are relevant to the current COVID-19 pandemic and are required for future epidemics.
Introduction
Accurate and complete outbreak data are essential in understanding the epidemiological properties of an epidemic and are critical for data-driven decision making.1 During large epidemics, it is rare for a single agency to provide these data, and not all agencies have the capacity to collect and disseminate high-quality epidemiological data.2 However, while data standards exist for observational studies and clinical research, no such standards exist for public health-related epidemiological data.2 This poses challenges to the quality of epidemiological data, which often have shortcomings in three areas: (1) data dissemination, (2) data elements and (3) epidemiological factors.
To better understand the characteristics of a specific outbreak, or to compare epidemiological dynamics within or across distinct pathogens, researchers must find ways to use unstandardised data of variable quality from multiple sources. We applied reproducible approaches to standardise disparate data on the SARS-CoV-2 pandemic, creating an aggregated dataset that combines the best available epidemiological data from multiple sources. Aggregating sources in this fashion can yield improvements in timeliness, geographical resolution and completeness of information; help overcome common reporting challenges; increase the sensitivity of surveillance for emerging diseases; and better inform predictive models.3 This is especially important for capturing global and regional disease trends during large-scale epidemics like the COVID-19 pandemic, which, as of 4 April 2021, has spread to more than 230 countries, areas or territories with over 130 million cases and 2.8 million deaths reported.4 However, data limitations can also be inadvertently magnified if care is not taken when combining sources.
Combining multiple data sources is a complex process,3 requiring techniques to resolve inconsistencies in temporal structure and encoding, the handling of missing or unknown data, inconsistencies in naming conventions, varying data resolutions and non-standardisation of case definitions.5–7 Here we discuss common challenges in compiling epidemiological data and recommend best practices to ensure data integrity.
Challenges in epidemiological data
Data dissemination
Multiple agencies and reporting sources often generate public health statistics on the same epidemic. This can introduce obstacles, including discrepant estimates and varying data structures, which can be challenging to resolve, as many sources do not provide complete methodological documentation and metadata, or maintain consistent archiving procedures. These challenges can arise from staffing constraints, funding and other resource limitations, and gaps in technical infrastructure; such challenges may be particularly acute in low-income and middle-income countries (LMICs).6
Data structure
Public health data are disseminated via disparate structured, unstructured and semistructured sources. Data may be provided in spreadsheets, images or descriptive text. They can be written in numerous languages and presented via static webpage, interactive dashboards or application programming interface (API). Extracting data from text-based reports requires contextual understanding and interpretation. Tabular reports are easily digested when data elements are clearly labelled, though sometimes they lack the information needed for unambiguous interpretation. Data provided in graphical format can provide information in a readily interpretable format, though poor graphical design can also obscure details and lead to misinterpretation.8
Throughout the COVID-19 pandemic, data formats have not only differed across countries but also changed within the same reporting source over time. Many countries initially announced cases through text-based press releases. As the situation evolved, many sources incorporated tables and graphs into situation reports. Some reporting agencies have since transitioned to reporting COVID-19 data via dedicated web pages or interactive dashboards (figure 1), or maps which sometimes update at irregular intervals and overwrite previous data, making obtaining past data impossible. Even within some countries, such as the USA, standardisation across reporting agencies does not exist.
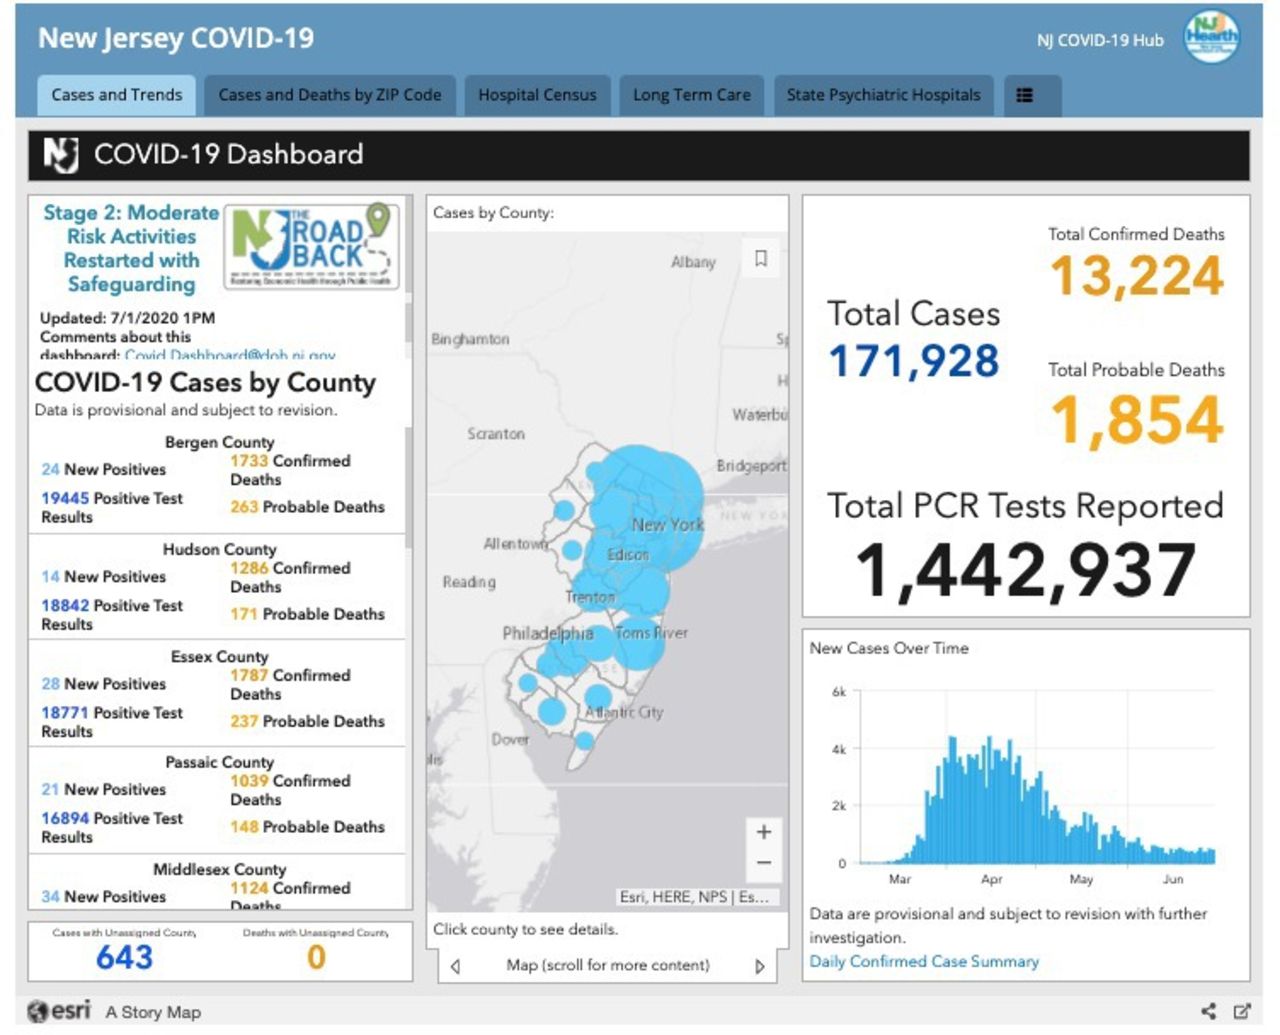
Screenshot of the New Jersey Department of Health interactive dashboard.32
Data permanence
Lack of data permanence poses significant challenges for retrospective analysis. Reporting sources often only report the current view of the event, though some present time-series data to reflect historical trends (figure 1). However, those sources do not provide details regarding data corrections, which enable analysts to extract and analyse data reported at a specific point in time, as well as post hoc corrected values. This is especially common for dashboards generated while monitoring events. As these dashboards generally do not provide archived data, frequent visits to the page are required to capture time series data. Lack of data permanence for a specific source makes validation and replication of the data nearly impossible.
Challenges in data elements
The lack of standardisation in data elements, such as date formats and location names, is problematic and can lead to errors when data sources are combined.
Language and regional date formats
During a global pandemic reports are disseminated in a large variety of languages that may require translation. Translating dates and times from some languages can create additional challenges, especially when non-Roman alphabets or alternate calendars are used. Regional date formatting differences (eg, day/month/year, month/day/year and year/month/day) can lead to ambiguity and misinterpretation. Not all reporting sources follow the Gregorian calendar. For example, Thailand uses a Buddhist calendar, so reports for the (Gregorian) year 2020 will indicate the year is 2563.9 Finally, the definition of an ‘epidemiological week’ can vary by source. The epidemiological week can start on Sunday (eg, US Centers for Disease Control and Prevention (CDC) Morbidity and Mortality Weekly Report week) or Monday (eg, European Centre for Disease Prevention and Control Weekly Influenza Report). Sources do not always specify this information.
Location names and political boundaries
Managing political boundaries and location names may pose a challenge.2 Different location names can be similar, sometimes differing by a single character. This can lead to errors, often due to typos or translation errors. Reports may also use a variety of alternative spellings for a single location. This can be especially problematic when translating location names, which can lead to different spellings of the same location name even within a single report. Different locations can also have the same name, and a report may not provide the necessary context to differentiate them (eg, New York State, New York City or New York metropolitan area).
Changes in political boundaries can impede retrospective epidemiological analyses. Administrative boundaries can change within a given country. For example, Uganda went from 34 districts in 1990 to 112 in 2010.10 Varying definitions of political boundaries can cause challenges in comparing data across sources.
Spatial and temporal resolution
Sources provide data at varying spatial and temporal resolutions. Some COVID-19 reports provide national incidence for many countries and subnational data for a focal location. For example, the Italy Ministry of Health provides global case counts alongside totals for all impacted countries but provides a more granular breakdown of cases by region in Italy. The breakdown of subnational incidence can occur at a variety of administrative division levels (see table 1 and online supplemental material S1). Discrepancies between subnational and national data often exist in a report (eg, Santé Publique France Actualités COVID-19 reports), and subnational data may not include all data elements. For example, the Ireland Department of Health reports subnational case counts but not deaths, and reported subnational cases lag 2 days behind the reported country total. The spatial resolution of data provided by a source is not always consistent over time. A source may initially report subprovincial incidence, and later report only provincial data (eg, Ministerio de Sanidad España).
Supplemental material
Key types of data provided by each source included in the Metabiota composite (metrics may have changed over the course of the pandemic)*
Epidemiological challenges
In many cases, the very nature of the epidemiological data may pose reporting issues, including missing data, reporting lags, retrospective data corrections and changes to case definitions over time. It is critical to recognise these issues when they are present in the data and exercise due care when using the data for decision making.
Missing data
There is no universal standard in handling unknown and zero values in outbreak reporting. For example, the US CDC reports typically use a dash to indicate unknown case counts,11 but the Mexico Ministry of Health uses a dash to indicate zero cases.12 Gaps in the data may also occur due to reporting delays or other known or unknown reasons. This can result in reporting lags and catch-up values capturing multiple reports worth of data in a single report. For example, a country that typically reports case counts daily may not report cases for 3 days due to a holiday, and then report a large case increase on the fourth day to catch up the total. Data gaps can be substantial in resource-constrained settings, as health agencies may by necessity prioritise monitoring their constituent population over providing timely reports.2
Demographic and behavioural data are often collected as part of disease surveillance. This kind of information is valuable but is not always publicly accessible. Legal and regulatory frameworks governing personal health data pose one important constraint. Resource limitations pose another; rigorously anonymising data for wider dissemination require dedicated time and resources, which may be difficult to mobilise in areas facing high disease burdens, or with human resource or technical constraints, such as LMICs.7
Reporting lags
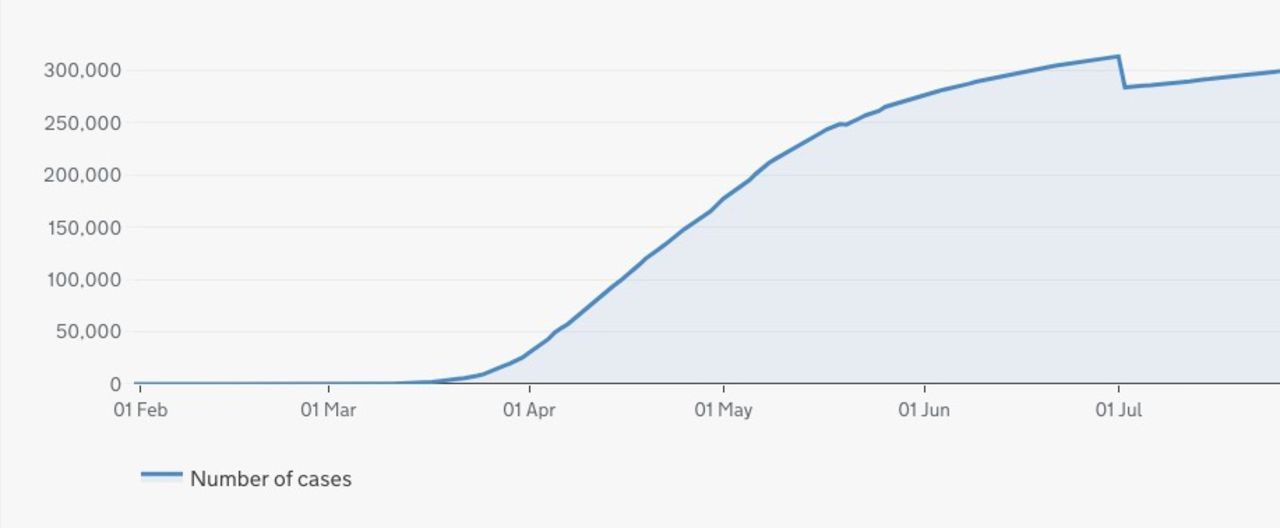
Due to the magnitude of the COVID-19 pandemic, many sources provide daily reports. However, reporting agencies often retrospectively add or remove cases following the completion of diagnostic testing and data cleaning. Documentation of these changes is often unavailable, as are data on the actual incidence date necessary to assign cases to historical dates, leading to spikes or drops in reported cases that do not reflect reality (figure 2). Sources also differ in whether they provide case counts by the date of symptom onset, sample collection or diagnosis. Most COVID-19 reports provide cases by date of diagnosis. This translates to time series lags when overtaxed laboratories have backlogs that lead to substantial delays between illness onset and test result. This challenge may be exacerbated in LMICs, with insufficient laboratory capacity to keep up with increased testing requirements during a pandemic.13

Drop in cumulative cases on 2 July 2020 due to data cleaning.33
Case definition
A lack of uniform case definitions for public health surveillance can limit the usefulness of data.14 Some reports clearly state the relevant case definition (eg, Austria Bundesministerium), while others do not (eg, New Jersey COVID-19 Dashboard).
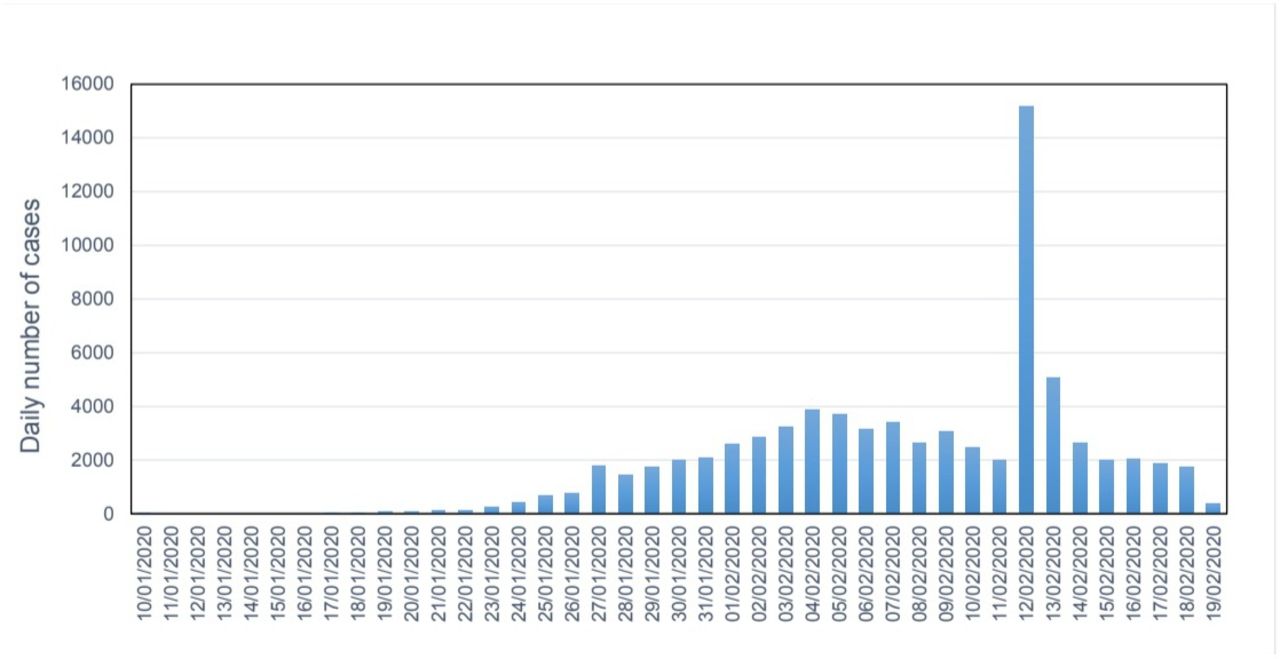
Additionally, case definitions can change during an outbreak, especially one caused by a novel pathogen. For example, an unexpected spike in COVID-19 cases in Hubei province, China, occurred on 12 February 2020 when clinical, unconfirmed cases were retrospectively added to incidence data (figure 3). Similarly, the US CDC added probable cases to its case definition in April 2020; however, states do not consistently report these data.15 Changes in the case definition can have a substantial effect on the proportion of all infections identified as cases as time progresses.16

Time series of the number of cases reported by day in China.34
Composite sources for COVID-19
There has been a proliferation of composite data sources created as a result of the scale of the COVID-19 pandemic.17 18 Each composite source uses a different approach to compile data and address the issues previously discussed. Differences can be due to the specific use-cases intended for a dataset—for example, visualising cases/deaths temporally in near real-time, forecasting or disease modelling.18 The way compilers transfer and analyse the complex epidemiological data can also create differences between the compiled sources.5
Composite sources also differ in the spatial granularity of data provided, which may be due to the availability of data or the amount of labour required to compile such large datasets.19 No publicly available compilation dataset contains all available subnational data for the COVID-19 pandemic. In addition, location names may differ, depending on the source of standardisation. For example, Johns Hopkins University uses the US State Department country designations,20 and Metabiota uses Google Geolocation API for naming standardisation.21 More information on some composite sources is shown in online supplemental appendix 1.
Metabiota composite
The Metabiota composite dataset compiles official outbreak reports to provide information at the finest temporal and geographical resolution available for target locations.21 This dataset is primarily used in infectious disease models. Since case identification and real-time situational awareness are not the primary use case, the dataset is not provided in an interactive public dashboard and is subject to extensive expert review, data validation and cleaning.
Recommendations and best practices
The process of creating composite datasets is complex, with many potential pitfalls. Here we present recommended best practices, drawing on lessons learnt during COVID-19 as well as several prior outbreaks, including SARS-CoV starting in 2002, Zaire ebolavirus from West Africa starting in 2013, the emergence of Zika in the Americas starting in 2015, the Zaire ebolavirus outbreak originating in North Kivu, Democratic Republic of the Congo starting in 2018.22–24 Two types of best practice recommendations are made, those that should be used when creating a compilation dataset and those that should be applied by official reporting sources (recommendations are summarised in table 2).
Summary of key challenges, best practices and recommendations
Metabiota’s process for creating composite data sources starts with a team of digital surveillance experts with training in infectious disease epidemiology who rely on semiautomated approaches for event detection and prioritisation. Next, officially reported data in a variety of formats are curated, structured and validated into one consistent data format.
While automated data scraping of public health data is a useful tool to speed up data collection, it has many challenges. Many of the COVID-19 reporting websites have changed their data structure several times over the course of the pandemic. Even minor layout changes can cause an automated system to extract the incorrect information from a website.2 Best practice would be to include both automated and manual checks into data scraping to ensure the correct data has been acquired as automated checks cannot guard against all possible errors.
Once data from the initial source is structured, analysts must determine whether a single source is satisfactory or additional sources are required to obtain a comprehensive view of an epidemic. This determination depends largely on the intended use for the data. For example, the properties of a dataset intended to provide near-real-time awareness of an ongoing event may differ significantly from those of a dataset intended to provide accurate retrospective descriptions of an epidemic that has ended. When determining if multiple sources should be fused into a composite database, we consider multiple features of each potential component source. These include, among others, the frequency of updates; the timeliness of updates; the geographic granularity provided; the distinction between confirmed, probable, or suspected cases and deaths; and whether a source archives previous reports or overwrites its data entirely with each update.
When a composite data source becomes necessary, we recommend starting with the most comprehensive source available (eg, widest geographical coverage) to form the dataset’s base, then incorporating additional data provided in other sources to fill gaps. For COVID-19, we chose the WHO’s database of national totals as our primary source based on its ability to provide the broadest worldwide coverage, with the greatest degree of consistency and in the timeliest manner. We then replaced portions of the WHO database using national and/or subnational reports, which typically updated more rapidly and with greater geographical granularity than the WHO source. For some countries, such as the USA, multiple national and subnational reports were fused into the composite database to provide the best available information. In such situations, discrepancies such as date range overlaps or conflicts between national level and subnational level case counts must be reconciled in the composite dataset.
Some compiled datasets list other data aggregating websites and media reports in their sources making the original data source and its validity difficult or even impossible to ascertain. Best practices would be to use only official data primarily from authorities.
Since many dashboards are updated as soon as new data becomes available, the counts for a given location may be incomplete for a specific date, and due to the lack of date/time stamps associated with the data on the dashboard, it is often difficult to know the vintage of the data and how recently it has been updated. Data updated on Thursday for Brazil may be cumulative as of Thursday, but it could also be cumulative for Wednesday, Tuesday or a mixture for different administrative units. This is often the result of a delay in reporting of data from the original source rather than by the data compiler, but without more information, the data could be misinterpreted, leading to errors in calculations and decision making. A more consistent approach would be to update the data when the source has provided the final count for a given day, though it is a trade-off for having the most current data. At a minimum, the date associated with the cases, in addition to the date the data have been updated, is needed for accurate interpretation.
Although the epidemiological challenges discussed earlier cannot be easily addressed during data compilation, it is important to be aware of the issues. Ideally, public health agencies would attempt to reduce the occurrence of missing data, address reporting lags and use a clear, standardised case definition. The data should be transparent so researchers are aware of when data are missing, there is a report of the data cleaning process and the case definition being used is clearly stated.
As COVID-19 has progressed, the case definition has evolved,16 25 including the addition of probable cases and deaths (eg, US CDC). While not all sources or locations have broken incidence data into suspected, probable or confirmed, we recommend using that information whenever it is available. The inconsistent reporting of probable cases can lead to under-reporting of the disease impact and can impact models or the ability to properly respond to the pandemic.1
Moving forward
As the COVID-19 pandemic recedes, efforts to improve public health data production, collection, integration and dissemination will surge. Similar surges followed prior infectious disease crises, leading to substantial (yet clearly incomplete) improvements to the landscape of global health data. In this article, we have argued that varying standards and approaches to data production introduce challenges to linking data and building a common view of complex, fast-evolving epidemics. Table 2 contains an overview of these challenges and our recommendations for moving forward. At minimum, efforts to reform the global health data ecosystem should bear such challenges in mind; optimally, reform efforts should incorporate standards and best practices to yield more robust, transparent and interoperable data. Doing so will require investments in global public health infrastructure, both in terms of more funding for regional and global health organisations that set standards and provide technical support to national ministries of health, and directly to ministries of health in LMICs.26 As a starting point, we recommend the creation of a global task force or expert panel charged with defining a set of standards for epidemic data, metadata and documentation. This group should be independent, composed of leading scientists, but closely linked with WHO, national and regional health agencies, as well as non-governmental organisations and philanthropic organisations.
Reporting challenges are not confined to low-income countries nor are they solely the result of resource limitations. The US CDC, like many reporting agencies, has faced challenges in providing COVID-19 data to the public, and developing clearer standards could be of great benefit. Although the CDC has recommended case definitions for national use, these categories for confirmed, probable and suspected cases have not been universally adopted by individual states. Individual state health departments provide disparate information to the CDC, which then combines that data into a dashboard that is meant to give a clear picture of the situation in the USA. Unfortunately, the lack of interjurisdictional coordination negatively impacts the ability to visualise the situation and to control the spread of disease.27 Frequently, incidence data differ between state health department reports and those shared by the US CDC. While the COVID-19 pandemic has aggravated this situation, the agency previously addressed these issues in the National Notifiable Diseases Surveillance System, and lessons learnt for that schema could be applied to COVID-19 data collection and reporting. In addition to these structural issues, the CDC was impacted by political interference for much of the COVID-19 pandemic. This follows a pattern observed during the pandemic, in which governance challenges at the local and national levels have impeded epidemic reporting and response, for example, in China and Turkmenistan.28–31 More generally, evidence suggests that poor governance and institutional capacity gaps can negatively impact the ability of public health systems to respond to epidemics.26
Providing high-quality pandemic data has been a challenge for all reporting agencies, but some have performed better than others. The Hong Kong Centre for Health Protection (CHP) quickly used their influenza reporting system to provide COVID-19 reports during the initial stages of this pandemic. The CHP was one of the first authorities to implement a consistent definition for probable COVID-19 cases. Furthermore, the Public Health Agency of Canada, while slower to iterate from early reporting to their current system, provides clear daily updates, which include uniform and standardised data from each province and retrospectively address changes to previously reported values.
Modellers need high-quality data to train and validate models.2 Deficiencies in input data can cause predictive models to produce inaccurate results, and can hinder policymakers in identifying and choosing appropriate disease control strategies. Producers of infectious disease surveillance data should work within a common set of standards to improve the quality and comparability of disease statistics. With the absence of such standards, users of disease statistics should be aware of potential challenges and follow best practices in reconciling and harmonising discrepant and discordant data.
Data availability statement
Data is available in a public, open access repository at https://data.humdata.org/organization/metabiota
Supplementary materials
Supplementary Data
This web only file has been produced by the BMJ Publishing Group from an electronic file supplied by the author(s) and has not been edited for content.
Footnotes
Handling editor Seye Abimbola
Twitter @benoppenheim
Contributors RB, CP, BA, TP, CN and PS acquired the data and contributed to the methodology. RB, KM and CL provided analysis. RB drafted the manuscript. KM, BO, NS, CP and NM provided critical revision of the article. All authors provided feedback on the manuscript. All authors approved the final version.
Funding The authors have not declared a specific grant for this research from any funding agency in the public, commercial or not-for-profit sectors.
Competing interests All authors have completed the International Committee of Medical Journal Editors uniform disclosure form at www.icmje.org/coi_disclosure.pdf and declare that they have been employed by Metabiota Inc; no other relationships or activities that could appear to have influenced the submitted work.
Provenance and peer review Not commissioned; externally peer reviewed.
Supplemental material This content has been supplied by the author(s). It has not been vetted by BMJ Publishing Group Limited (BMJ) and may not have been peer-reviewed. Any opinions or recommendations discussed are solely those of the author(s) and are not endorsed by BMJ. BMJ disclaims all liability and responsibility arising from any reliance placed on the content. Where the content includes any translated material, BMJ does not warrant the accuracy and reliability of the translations (including but not limited to local regulations, clinical guidelines, terminology, drug names and drug dosages), and is not responsible for any error and/or omissions arising from translation and adaptation or otherwise.