Article Text

Abstract
Introduction Despite progress towards the Joint United Nations Programme on HIV/AIDS 95-95-95 targets, South Africa is still suffering from one of the largest HIV epidemics globally. In this study, we generated high-resolution HIV prevalence maps and identified people living with HIV (PLHIV) in underserved areas to provide essential information for the optimal allocation of HIV-related services.
Methods The data come from the South Africa Demographic and Health Survey conducted in 2016 and spatial variables from other published literature. We produced high-resolution maps of HIV prevalence and underserved areas, defined as a greater than 30 min travel time to the nearest healthcare facility. Using these maps and the population density, we mapped PLHIV and the PLHIV within underserved areas for 30, 60 and 120 min thresholds.
Results There was substantial geographic variation in HIV prevalence, ranging from 1.4% to 24.2%, with a median of 11.5% for men, and from 2.1% to 48.1%, with a median of 20.6% for women. Gauteng province showed the highest density for both HIV prevalence and PLHIV. 80% of all areas in the country were identified as underserved areas (30 min threshold), which contained more than 16% and 20% of the total men and women living with HIV, respectively. KwaZulu-Natal province had the largest number of PLHIV in underserved areas (30 min threshold) and showed less than one healthcare facility per 1000 PLHIV.
Conclusion Our study showed extensive spatial variation of HIV prevalence and significant numbers of PLHIV in underserved areas in South Africa. Moreover, we identified locations where HIV-related services need to be intensified to reach the ~1.5 million PLHIV in underserved areas, particularly in KwaZulu-Natal province, with less than one healthcare facility per 1000 PLHIV.
- epidemiology
- health services research
- public health
- HIV
- cross-sectional survey
Data availability statement
Data are available in a public, open-access repository. The data that support the findings of this study are available from the Demographic and Health Surveys (http://www.measuredhs.com), but restrictions apply to the availability of these data, which were used under licence for the current study and so are not publicly available. However, data are available from the authors on reasonable request and with the permission of Demographic and Health Surveys. We sought and were granted permission to use the core data set for this analysis by Measure DHS.
This is an open access article distributed in accordance with the Creative Commons Attribution Non Commercial (CC BY-NC 4.0) license, which permits others to distribute, remix, adapt, build upon this work non-commercially, and license their derivative works on different terms, provided the original work is properly cited, appropriate credit is given, any changes made indicated, and the use is non-commercial. See: http://creativecommons.org/licenses/by-nc/4.0/.
Statistics from Altmetric.com
Key questions
What is already known?
South Africa suffers from one of the largest HIV epidemics, with more than 7.5 million people living with HIV (PLHIV) in 2018.
The country achieved its first 90-90-90 target by diagnosing more than 90% of PLHIV.
However, the other targets (the proportion of diagnosed people on antiretroviral therapy (ART) and the proportion of virally suppressed PLHIV on ART) are still behind, despite the aggressive expansion of ART coverage.
What are the new findings?
South Africa showed extensive spatial variation of HIV-positive population for both genders.
The largest PLHIV population is concentrated in the Gauteng province, with a density of 13 862 women per 5 km2 and 15 484 men per 5 km2.
More than 80% of areas in the country are more than 30 min travel time from the nearest healthcare service.
More than 16% of men living with HIV and 20% of women living with HIV reside in underserved areas where the nearest healthcare service cannot be reached within 30 min travel time.
A total of 80% of PLHIV reside in only five provinces; KwaZulu-Natal province has the largest number of PLHIV within 30 min threshold of underserved areas containing more than 100 000 of PLHIV for each gender (149 197 for men and 174 543 for women) and shows less than one healthcare facility per 1000 PLHIV.
What do the new findings imply?
There are still several barriers for HIV treatment service coverage that need to be overcome, particularly for PLHIV living in underserved areas where health services are not likely to be reached within threshold times.
Efforts to allocate resources for HIV treatment need to be oriented towards the PLHIV located in underserved areas in provinces with low number of healthcare facilities per 1000 PLHIV.
Introduction
With the rapid achievement of the 90-90-90 strategy (90% of all people living with HIV (PLHIV) know their HIV status, 90% of all people diagnosed with HIV receive sustained antiretroviral therapy (ART) and 90% of all people receiving ART have viral suppression) to guide country-led and regional-led efforts to rapidly scale up HIV prevention and treatment services, the annual global number of new HIV infections had declined from 2.1 million in 2010 to 1.7 million (16%) by 2018.1 This progress led to revised 95-95-95 targets and an acceleration of efforts to end the HIV/AIDS epidemic by 2030. In addition, the Joint United Nations Programme on HIV/AIDS (UNAIDS) announced the Fast-Track approach focusing on the 30 countries that account for most of the world’s people newly infected with HIV, which includes South Africa.2
South Africa, with more than 7.5 million PLHIV,1 has one of the largest HIV epidemics in the world. To reverse the tide of the epidemic, the country3 aggressively scaled up ART coverage, which has led to improvements in HIV outcomes. In 2018, the annual number of new HIV infections declined to 240 000 people, which represented 0.49% of the uninfected population, compared with 0.64% in 2015.1 South Africa has achieved a 90% of PLHIV diagnosed, 68% of those diagnosed on ART and 88% of those on ART virally suppressed in 2018,4 5 and is potentially on its way to meeting the 90-90-90 targets by 2022.6 Despite remarkable progress, HIV prevalence in the country remains persistently high with 18.9% of adults aged 15 and older infected with the virus, and more than 200 000 new infections occurring every year.7 8 Although the proportion of PLHIV who know their HIV status has been steadily increasing, the proportion of PLHIV on ART is remarkably low despite the expansion of ART coverage. The likelihood of South Africa achieving its 95-95-95 targets and ending the HIV epidemic by 2030 remains far from certain.
In order to meet those targets, we have previously argued for prioritising resource allocation and accelerating HIV prevention and treatment services in certain high-risk areas in South Africa.9 10 South Africa shows substantial spatial variation in the HIV epidemic with infections clustering in the eastern part of the country, between the Limpopo and KwaZulu-Natal provinces.6 11 However, most past measures of HIV prevalence in the country are frequently available only for large geographical administrative units (ie, low spatial resolution), or they are only focused on localised epidemics.7 These large-scale national or regional measures can obscure localised aspects of the HIV transmission process across the country. Moreover, these measures are estimated for the total population, but spatial disparities of the epidemic and their social and behavioural drivers can exist.8 Microlevel analyses on the spatial structure of the HIV epidemic and the density of PLHIV in low-access areas could help facilitate the operation of HIV prevention and treatment services by targeting resource allocations to the areas. To maximise the achievement of the 95-95-95 targets by 2030, identifying areas where the burden of HIV is concentrated could play a key role in recognising vulnerable populations at high risk of infection, but also in prioritising the access to critical healthcare for PLHIV in these areas.12–19
Given this context, the main objective of this study was to generate high-resolution, spatial predictions of HIV epidemiological measures for men and women (HIV prevalence and density of PLHIV) in South Africa. We then used these spatial predictions to conduct a detailed spatial analysis of underserved areas from critical healthcare services to identify men and women living with HIV in areas with low access to HIV prevention and treatment services. This information would be of high relevance for assisting the national strategy to target appropriate areas and populations and achieve the UNAIDS targets in South Africa.20
Methods
Study area and data sources
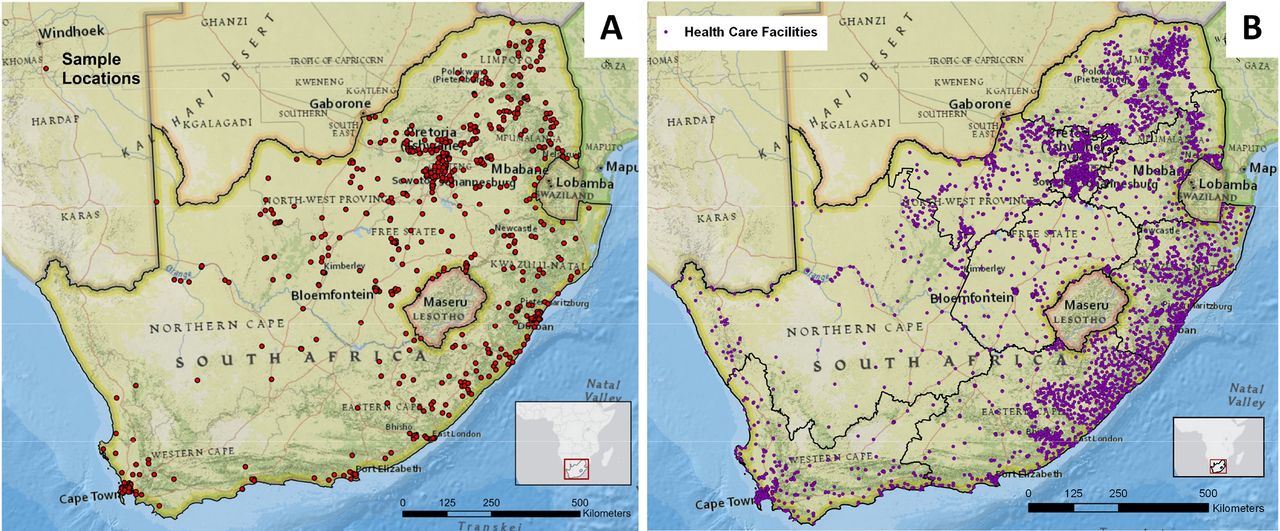
The main source of data for this study was the South Africa Demographic and Health Survey (SADHS) conducted in 2016,21 which contains HIV serological biomarker information along with the corresponding spatial information of sample locations. The SADHS is a cross-sectional household survey designed to collect nationally representative data on population, health and socioeconomic parameters.21 Individuals were enrolled in the SADHS via two-stage sampling procedure to select households. Men and women aged 15–49 in the selected households were eligible for the study. Of 12 132 participants (3618 men and 8514 women), 4862 individuals (2136 men and 2726 women) who interviewed and provided specimens for HIV testing were included. The SADHS sample locations are where the individuals participated the survey. The number of the sample location is 601 for men and 633 for women. The global positioning system was used to identify and record the geographical coordinates of each SADHS sample location (figure 1A).22 Further details related to the population of the study can be found in the online supplemental materials.
Supplemental material

Sample locations. (A) Demographic and Health Survey sample locations for South Africa Demographic and Health Survey (SADHS) in 2016, and (B) healthcare facility locations. Map was created using ArcGIS by ESRI V.10.5 (http://www.esri.com).
Demographic and Health Surveys (DHS) has conducted nationally representative anonymous HIV testing to track HIV epidemics by collecting blood from representative samples of the population of women and men in a country since 2001.21 23 Respondents who participated in the testing received educational materials and referrals for free voluntary counselling and testing. HIV serostatus was determined using the ELISA, based on a parallel testing algorithm. Further details related to the SADHS methodology, study design and data can be found in online supplemental materials and elsewhere.21 23 This study follows the guidelines of the Strengthening the Reporting of Observational Studies in Epidemiology.24
Selection of spatial variables and HIV mapping
We selected variables from the SADHS data sets and other sources to investigate the association between socioeconomic and behavioural factors and the spatial structure of HIV in South Africa. Six socioeconomic and behavioural variables that have been previously associated with the risk of HIV prevalence were measured for men and five for women.12 25 These included education level, poverty estimated using the DHS wealth index, condom use, number of lifetime sexual partners, if the participants had ever been previously tested for HIV and male circumcision (MC; male only). MC was a self-reported variable of circumcision status and thus did not consider which types of circumcision (eg, voluntary medical MC or traditional MC) were conducted. These variables were evaluated as percentages at each SADHS sample location.
We included seven environmental variables in the analysis: the normalised difference vegetation index (NDVI), night light, distance to main roads and dams, global human influence index (GH-I), friction map representing allocated fastest speed of travel based on the types of travel mode estimated within the pixel and population density. We quantified all variables at each DHS sample location. For example, we extracted the NDVI value at each SADHS sample location, and the distance from each sample to the closest main road was calculated and assigned at each sample location. The definition and descriptive statistics for each variable are presented in online supplemental table S1.
To generate disease maps of HIV prevalence in South Africa for each gender, we implemented a method previously developed to describe the spatial structure of HIV prevalence in several countries in sub-Saharan Africa (SSA) including Kenya, Malawi, Mozambique, Tanzania and Zimbabwe.12 25 We used ordinary kriging mapping methods to generate continuous surface maps for each significant socioeconomic, demographic and behavioural factor identified in the multivariable regression model. The variables satisfied both criteria: (1) the bivariate logistic regression slope coefficient must have p value <0.1; and (2) the significance test for spatial autocorrelation must have p value <0.1. Then, we generated a map of HIV prevalence in raster format with 5 km grid resolution by substituting values from all continuous surface maps into the gender-specific multivariable logistic regression model for each gender. Finally, a 5 km × 5 km pixel resolution map of the density of women and men living with HIV was generated by combining the HIV prevalence map with the women and men density maps. Further details related to this methodology can be found in online supplemental materials.
Mapping HIV-underserved areas
To identify HIV-underserved areas, we used two data sets: the friction map from Malaria Atlas Project and the locations of public healthcare facilities in South Africa (figure 1B).26 We employed travel time estimates, which offer the most accurate representation of the cost of travel, for measuring geographic accessibility and for identifying underserved areas.27 28 We obtained all public healthcare facilities and private-not-for-profit sectors managed by government (eg, the Ministry of Health), local authorities, and faith-based organisation and non-governmental organisation to represent public health services.26 A total of 4287 healthcare facilities were included in the analysis. We modelled travel time as a function of distance and travel speed. It can be conceptualised as the cost of movement using the cell dimensions (pixel resolution) and travel time assigned to each cell. In this model, travel occurs through cell to cell in both cardinal and diagonal directions, and a travel time was designated for each cell, representing the time required to traverse the cell estimated from the friction map. To identify underserved areas, we reclassified the accumulated travel time surface into a Boolean surface based on whether the cell was greater than three thresholds, 30, 60 and 120 min, from a healthcare location, then we converted the underserved areas from a raster grid to a vector data form (polygons) to identify the women and men living with HIV in these areas. We used three travel times, that is, 30, 60 and 120 min, as thresholds for underserved areas in this study based on previous studies. Various travel times have been suggested as a threshold to access healthcare in South Africa and other countries in SSA.15 29–31 A study of PLHIV in Uganda reports 30 min as a median travel time for PLHIV to access healthcare facility.29 Another study for travel time to access primary healthcare in South Africa shows 81 min as a median travel time, and 65% of households travel more than 60 min to attend the primary healthcare.15 In addition, other studies in African countries use 120 min as a threshold to access healthcare facilities.30 31 Finally, we generated density maps of women living with HIV and men living with HIV in the underserved areas using the continuous surface maps of HIV generated in the previous step and the estimations for underserved areas. Further details related to this methodology, study design and data can be found in online supplemental materials.
Patient and public involvement
There were no patients involved in this research.
Results
Spatial variable selection
The variables selected for inclusion in the final logistic regression models for men and women are summarised in table 1, and the results from bivariate logistic regression analysis and the corresponding spatial correlation analysis (Moran’s Index) for each variable are presented in online supplemental table S2. For men, the final logistic model included ever been tested for HIV, poverty, lifetime number of sexual partners, MC, GH-I, distance to main roads and NDVI. For women, the final logistic model included condom use, lifetime number of sexual partners, friction, distance to main roads and NDVI. Continuous surface maps of each variable selected for men (online supplemental figure S1) and women (online supplemental figure S2) are included in online supplemental materials.
Variables in the final logistic regression models for men and women
HIV disease mapping
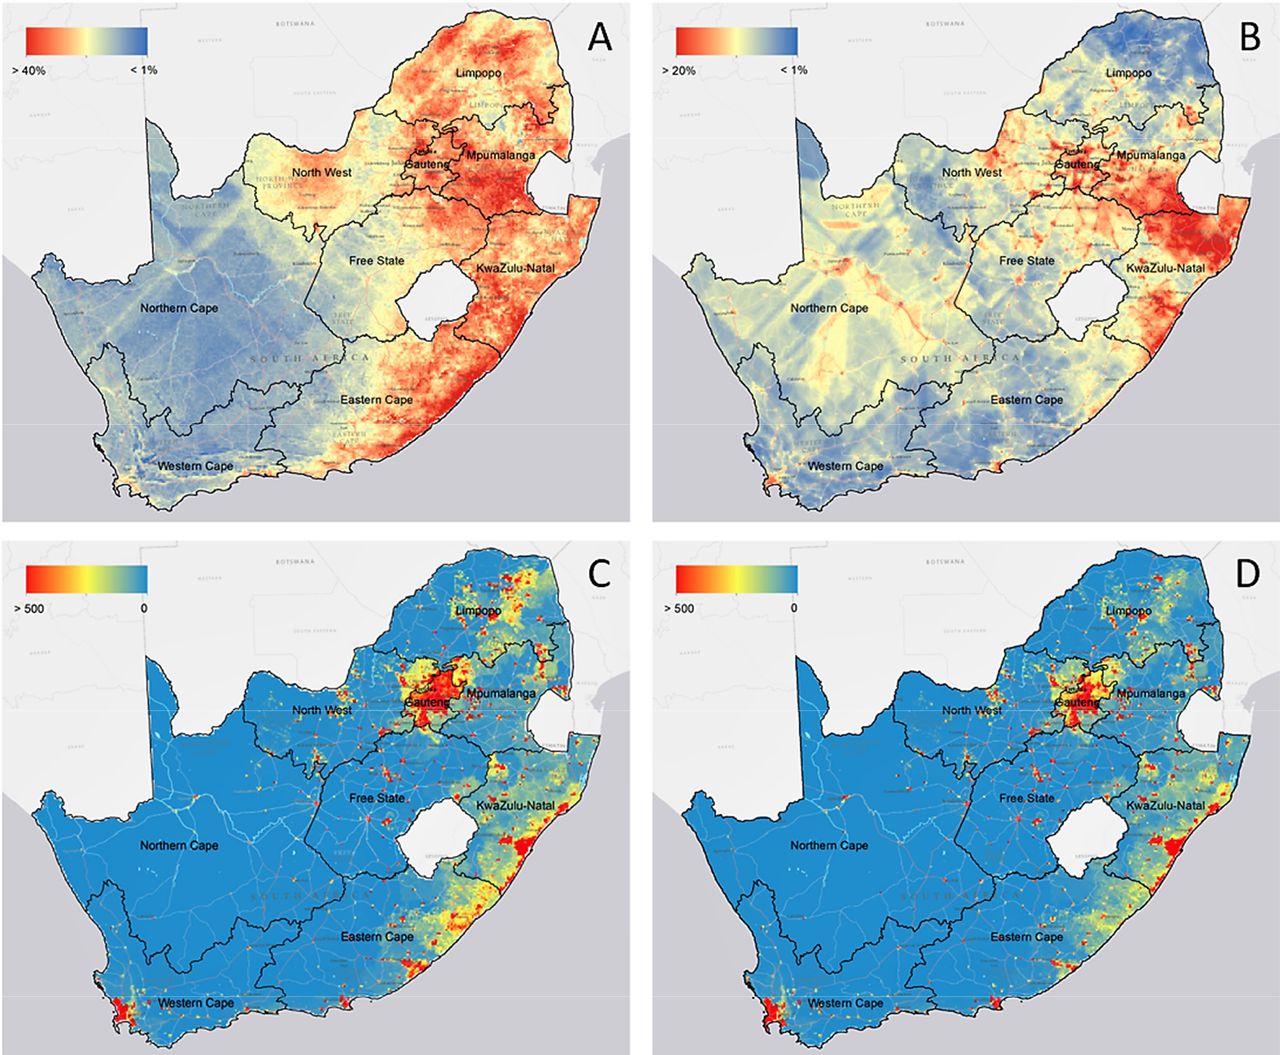
Figure 2A,B illustrates the spatial distribution of HIV prevalence estimated using the final multivariable logistic regression models for men and women, respectively. These maps show the distribution of the proportion of individuals who are HIV positive among the entire adult population (men aged 15–59 and women aged 15–49). Pixel-level HIV prevalence for men ranged from 1.4% to 24.2% per 5 km2, with a median of 11.5% per 5 km2, and from 2.1% to 48.1% per 5 km2, with a median of 20.6% per 5 km2 for women. The spatial structure of HIV prevalence showed some differences between the distribution of the disease for men and women. HIV prevalence for women was higher in the north-eastern part of the country, particularly in Limpopo province, and in the south-eastern areas along with the coastline in KwaZulu-Natal and Eastern Cape provinces. Conversely, HIV prevalence for men was more concentrated in the mid-eastern part of the country among the Gauteng and KwaZulu-Natal provinces.

High-resolution maps of HIV prevalence and people living with HIV (PLHIV) in South Africa. High-resolution maps of HIV prevalence in South Africa for (A) men and (B) women in 2016; geographic dispersion of men (C) and women (D) living with HIV in South Africa. HIV prevalence for women is higher in the north-eastern part of the country from Limpopo to Eastern Cape province, whereas HIV prevalence for men is more concentrated in the mid-eastern part of the country among the Gauteng and KwaZulu-Natal provinces. The density of PLHIV for both genders shows similar spatial patterns, concentrating in Gauteng province. Maps were created using ArcGIS by ESRI V.10.5 (http://www.esri.com).
Figure 2C,D illustrates the geographical distribution of the estimated number of men living with HIV and women living with HIV, respectively. Using the spatial maps, we estimated a total of 3 367 810 men living with HIV aged 15–59 and 3 861 228 women living with HIV aged 15–49 in 2016 in South Africa. The highest density of PLHIV for both genders shows in Gauteng, and the lowest density shows in Northern Cape. The density of PLHIV ranged from 0 per 5 km2 in Northern Cape for both genders to a maximum of 13 862 per 5 km2 for women and 15 484 per 5 km2 for men in Gauteng. Specifically, men living with HIV concentrate in the urban areas, whereas women living with HIV were distributed both in urban and the periphery areas, covering the north-eastern and south-eastern parts of the country.
PLHIV within underserved areas
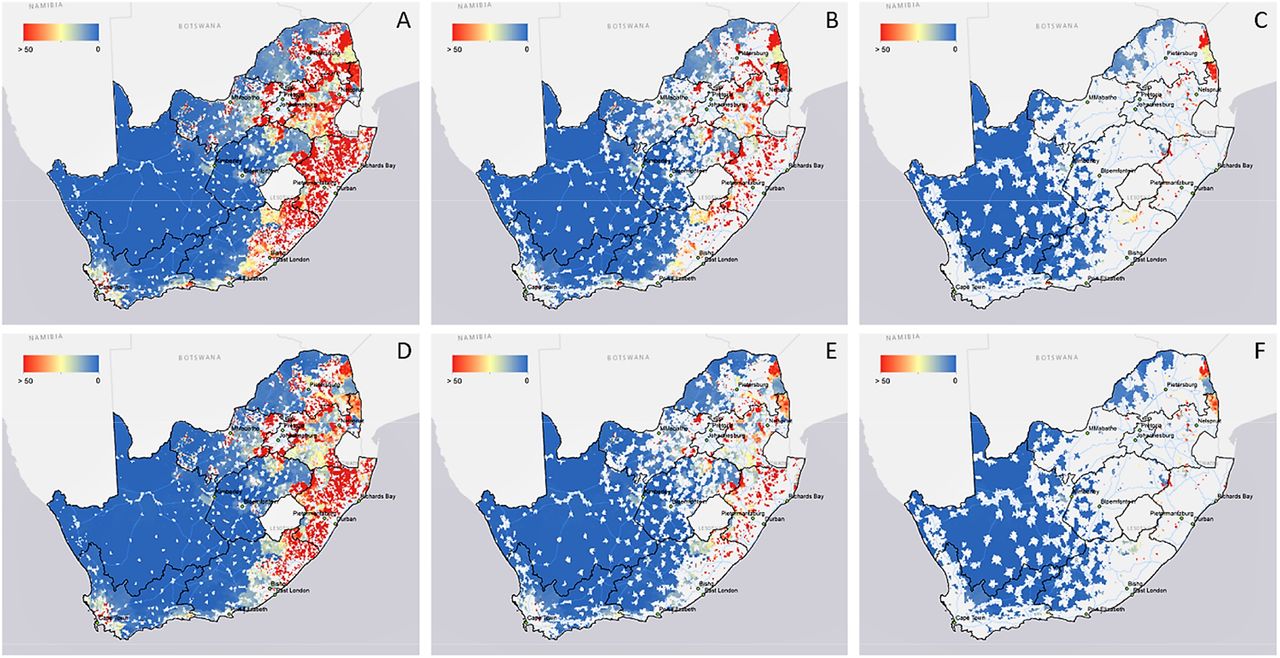
Figure 3A,D illustrates the population density of men living with HIV and women living with HIV within the underserved areas with 30 min threshold, respectively. The underserved areas based on 30 min travel time from the nearest healthcare facility across the country covered about 80% of the total territory (≈991 000 km2). About 16.6% (≈559 581) of men living with HIV aged 15–59 lived outside of a 30 min minimum travel time from the nearest hospital, whereas 20.4% (≈787 022) of women living with HIV aged 15–49 lived in those underserved areas, with a similar spatial pattern of PLHIV within the underserved areas for both genders. Most part of Gauteng province and coastal areas in KwaZulu-Natal province including the city of Durban were areas where healthcare services can be reached within 30 min. Likewise, figure 3B,E shows the population density of men living with HIV and women living with HIV within the underserved areas with 60 min threshold, respectively. These underserved areas covered 62.1% of the total territory of the country, and 6.4% (≈216 419) of men living with HIV were located outside of the 60 min travel time to the nearest hospital threshold, whereas 7.9% (≈305 074) of women living with HIV lived in those underserved areas. Lastly, 37.1% of the total area of the country was located outside of a 120 min threshold from the nearest healthcare facility (figure 3C,F), and 1.6% (≈53 737) of men living with HIV lived outside of a 120 min travel time to the nearest hospital, whereas 1.9% (≈73 144) of women living with HIV were located in these underserved areas.

People living with HIV (PLHIV) within underserved areas (30, 60 and 120 min thresholds) in South Africa. Estimated men living with HIV within 30 min threshold (A), 60 min threshold (B), and 120 min threshold (C) underserved areas; estimated women living with HIV within 30 min threshold (D), 60 min threshold (E), and 120 min threshold (F) underserved areas. Maps were created using ArcGIS by ESRI V.10.5 (http://www.esri.com).
Table 2 summarises the estimated number and percentage of PLHIV within the underserved areas by province. Around 80% of PLHIV were living in five provinces, including Gauteng, KwaZulu-Natal, Eastern Cape, Limpopo and Mpumalanga. Moreover, 50% of the PLHIV were located in Gauteng and KwaZulu-Natal provinces (46.66% for women living with HIV and 51.27% for men living with HIV). Although North West province contained a lower percentage of PLHIV (7.65% for women living with HIV and 7.58% for men living with HIV of the total PLHIV in the country), this province had the highest proportion of PLHIV within underserved areas with 30 and 60 min thresholds. Moreover, Gauteng province contained the largest proportion of PLHIV of the country for both genders, 26.01% for women living with HIV and 28.87% for men living with HIV. This province showed low number of PLHIV located within the underserved areas, with less than 5% of PLHIV in the underserved areas with 120 min threshold, and also had the lowest numbers of healthcare facilities per 1000 PLHIV among all provinces (0.45 for women living with HIV and 0.47 for men living with HIV). Conversely, Northern Cape and Western Cape provinces showed the lowest percentage of PLHIV of the entire country (1.32% and 5.69% for women living with HIV, and 1.93% and 7.97% for men living with HIV, respectively) and the highest numbers of healthcare facilities per 1000 PLHIV (4.58 and 2.01 for women living with HIV, and 3.58 and 1.65 for men living with HIV, respectively). However, these provinces contained a large number of PLHIV within underserved areas with 120 min threshold (9.70% and 7.37% for women living with HIV and 16.01% and 10.38% for men living with HIV).
The estimated number of PLHIV living in the underserved areas, and the number of health facilities per 1000 PLHIV for both men and women by province level
Discussion
HIV prevalence for both men and women showed remarkable geographical variation in South Africa, with the burden of infection concentrated in the eastern part of the country, among the provinces of Gauteng, KwaZulu-Natal, Eastern Cape, Limpopo and Mpumalanga, and with high concentration of PLHIV identified near urban settings of the eastern part of the country, including Johannesburg and Durban. For example, Gauteng shows the highest percentage of the average HIV prevalence for women, with 30.6% per 5 km2 and ranges from 18% to a maximum of 42% per 5 km2. For men, the average HIV prevalence in Gauteng shows 14.7% per 5 km2 and ranges from 8% to a maximum of 24% per 5 km2. We identified gender differences in the distribution of the HIV epidemic, with the HIV prevalence for women more concentrated in the northern-eastern and southern-eastern parts of the country compared with the concentration of men in the eastern part of South Africa. Moreover, PLHIV who are unlikely to access healthcare services within at least a 60 min time threshold are located in eastern part of the country among the Limpopo and KwaZulu-Natal provinces, and a large number of PLHIV near Kruger National Park across Limpopo and Mpumalanga, in the vicinity villages of Phalaborwa and Shangaan, near Hazyview town, are unlikely to access health services within a 120 min travel time.
Our results suggest that variables such as MC and poverty are key drivers of the spatial variation of HIV prevalence in South Africa. MC showed a significant association with the spatial structure of HIV for men. With the effectiveness of MC to reduce HIV infections among men,32 the South Africa government implemented the 2012–2016 National Strategic Plan (NSP) to circumcise 80% of HIV-negative men aged 15–49 by 2015 (SANAC, 2011).33 As a result, South Africa achieved a significant increase of MC from 25% in 2013 to 57% in 2016, but with marked spatial variation among provinces, with 35% MC prevalence in Northern Cape compared with 86% in Limpopo.21 The government launched the NSP 2017–2022 with a new target of 3 million circumcised men by 2021.34 Besides the direct impact of MC on the reduction of HIV acquisition, MC could also generate secondary benefits by affecting the sexual behaviour of circumcised men.35 For example, circumcised men tend to be concerned more about partner’s HIV status and to use condoms more frequently compared with non-circumcised men in South Africa.35 Likewise, poverty was also a significant explanatory variable associated with the spatial structure of HIV for both men and women. This result is consistent with a previous study showing that poorer women are more likely to have burden of HIV infection and have engaged in risky sexual behaviour especially for young women, such as earlier sexual debut, having had multiple sexual partners in the year, lower chance of condom use and having traded sex, compared with women in more affluent households.36 37 For both genders, poverty reduces the chance of discussing safe-sex practices with their partner.36
According to the UNAIDS Global Report in 2019, South Africa is one of the countries showing the great decline in new HIV infections with more than 50% of reduction in AIDS-related deaths between 2010 and 2018.1 The South Africa government launched a series of strategic plans as a response to HIV and updated the NSP four times (2000–2005, 2007–2011, 2012–2016, 2017–2022) to expand the coverage of prevention and treatment guidelines towards the ultimate goal of the elimination of HIV by 2030. South Africa has also increased domestic funds for HIV by about $650 million between 2010 and 2018, and now 78% of the total HIV funding resources in the country are domestic.1 Despite these efforts, South Africa has a 19.1% HIV prevalence among the adult population aged 15–49 years.1 One of the approaches included in the NSP 2017–2022 is the identification of priority areas and key vulnerable populations as a strategy for optimal resource allocation, and to build an environment that maximises coverage of HIV prevention and treatment services. As discussed previously, since spatial distance from residence to healthcare facilities for PLHIV is a major barrier to receiving adequate healthcare, allocating resources and controlling HIV prevention and treatment services are critical strategies to overcome the spatial barrier. Here, we localised HIV-underserved areas that could hinder South Africa in meeting UNAIDS targets and identified areas in need of appropriate HIV prevention and treatment services. Our analysis identified the areas where the travel time takes more than 30, 60 and 120 min to the nearest healthcare facility and indicated that more than 550 000 men living with HIV (17% among the total men living with HIV) and 750 000 women living with HIV (20% among the total women living with HIV) are living in areas where travel time to the nearest facility took at least 30 min.
The highest density of PLHIV in South Africa was concentrated in Gauteng province (around 1 million (26%) persons) with a maximum of 13 862 women per 5 km2 and 15 484 men per 5 km2. Since the borders of this province covered a small area, the numbers of PLHIV living in underserved areas rapidly decreased to zero. However, our results suggest that this province has the lowest number of healthcare facilities per 1000 PLHIV (0.45 for women and 0.47 for men), and although this province is characterised by easy-to-access health services with a short travel time, the absolute number of healthcare facilities may not satisfy the demand generated by the large numbers of PLHIV who need HIV treatment. Moreover, according to a recent analysis, Gauteng showed the slowest progress towards the 90-90-90 targets between 2003 and 2015 due to budget allocation.38 Gauteng and Mpumalanga had the lowest amount of HIV expenditure per HIV-positive individuals whereas Northern Cape and Free State had the highest amount of HIV expenditure.38
KwaZulu-Natal province had the second largest numbers of PLHIV for men and women (more than 700 000 PLHIV; 21%) with more than 10% of these PLHIV living in underserved areas. Similar to Gauteng, the province had lower numbers of healthcare facilities per 1000 PLHIV (0.99 for men and 0.93 for women). With the NSP 2017–2022 for HIV, the province implemented the Provincial Growth and Development Strategy 2035 along with the 90-90-90 strategy and set a new goal to eliminate HIV infections by 2035.39 As a result, the province achieved a significant decline of HIV infection by 27% between 2012 and 2016.39 The province classified districts into three categories (ie, high triple burden of HIV, tuberculosis (TB) and sexually transmitted infections (STI); dual high burden of HIV; high-burden districts of STI) to efficiently treat districts with limited resources and expenditure based on importance towards eliminating of HIV, TB and STI.39 According to the KwaZulu-Natal Provincial Multi-Sectoral HIV, TB and STI Implementation Plan 2017–2022, acceleration, intensification, inclusivity, participation and efficiency in the provision of services will be hallmark of the interventions and activities of this plan, given the dire situation of the epidemics in KwaZulu-Natal and for the fact that it is considered the epicentre of the epidemic in the country. Towards this end, the province adopted the ‘Focus for Impact’ methodology to assist localities with the greatest burden to targeting these settings with interventions and activities. The essence of the methodology is to deliver results that can provide the greatest impact with limited resources and highest value for money. Results have shown that five of the province’s 11 districts, namely (1) eThekwini; (2) iLembe; (3) uThukela; (4) uMgungundlovu; and (5) Ugu, have a high triple burden of HIV, TB and STIs. Four of the 11 districts have a dual high burden as follows: (1) King Cetshwayo and (2) Zululand (high burden of HIV and TB), (3) Harry Gwala (high HIV and STI burden), and (4) uMkhanyakude (high TB and STI burden). Amajuba, on the other hand, has a high STI burden.39 As the priority group, the high triple burden of HIV districts, including eThekwini, iLembe, uThukela, uMgungundlovu and Ugu, is located in the southern part of the province near the city of Durban.39 The results of our analysis show similar spatial patterns with this policy in terms of PLHIV. However, we found that the areas with higher needs of HIV prevention and treatment services are located in the northern part of the province, which is classified as a dual high-burden district since the districts contain a large number of PLHIV who are not likely to access the nearest health facility within a certain travel time.
Lastly, areas near Kruger National Park in Limpopo and Mpumalanga provinces had the largest number of PLHIV who needed at least 120 min to access the nearest healthcare facility. Limpopo and Mpumalanga provinces implemented the provincial strategic plan 2012–2016 with goals based on the NSP 2017–2022.40 41 However, since the two provinces are exposed to truck routes across borders with Zimbabwe, Mozambique and Zambia, these areas could be exposed to high movement of population that might increase the risk of HIV, and thus the intensification programmes for accessible HIV prevention and treatment for PLHIV within the areas might need to be implemented.40 41
We identified spatial variations of HIV prevalence and PLHIV at a high-resolution level for both genders and discovered underserved areas that healthcare services cannot reach at the high-resolution level. However, several study limitations could have affected our results. First, some of the variables included in the study could have been affected by inherent biases in the data due to the multiple logistical difficulties in conducting SADHS, such as variability in response rates to HIV testing. SADHS was conducted based on individuals who were interviewed and participated in HIV testing. The sample weighting procedures were applied to correct for differential non-responses, considering provincial characteristics, residential place and gender. However, the generalisability of the prevalence estimates can be unclear.42 43 For example, some high-risk subpopulations, such as women sex workers, injection drug users, men who have sex with men and mobile individuals, could have been missed.12 Since South Africa shares borders with other countries including Mozambique, Zambia, Namibia, Eswatini and Lesotho, migration and mobile populations could affect our findings. The methodology used to calculate HIV prevalence and PLHIV is not able to capture temporal changes due to migration, and the sources of data did not include information regarding mobile individuals which could affect estimations near the country borders.12 Moreover, MC prevalence was estimated from self-reported status of circumcision, and thus does not discriminate among different types of MC like traditional or medical circumcision. However, since our analysis focused on the general relationship between circumcised men and the spatial structure of HIV prevalence, we expect that this generalisation does not affect the main findings of our study.44 45 Lastly, the displacement process of the SADHS sampling data point via global positioning system might cause potential spatial bias.12 This process could have an impact on the precision of the continuous surface of HIV prevalence and PLHIV by a few kilometres.
Conclusion
Although South Africa achieved the first of the UNAIDS 90-90-90 targets, a large number of PLHIV are still in need for treatment, and precise geographic targeting of HIV prevention and treatment services might facilitate the country to meet the second of the UNAIDS 90-90-90 targets. Using spatial epidemiological approaches to investigate HIV prevalence and underserved areas from healthcare facilities, we identified more than 1 million of PLHIV in areas with the lack of access to healthcare within 30 min travel time. These findings can shed light on areas that have been aggregated in the province or national levels to represent HIV prevalence to support a cost-effective decision process for decision makers by geographically targeting certain areas. Therefore, special attention should be given to the development and implementation of tailored HIV prevention and treatment programme, especially in areas identified as underserved areas for PLHIV. The statistical modelling and high-resolution maps of HIV prevalence and PLHIV provide valuable information to support decision-making process to achieve the national and international goals for the elimination of HIV by increasing the effective HIV prevention and treatment services in those areas with the greatest need.
Data availability statement
Data are available in a public, open-access repository. The data that support the findings of this study are available from the Demographic and Health Surveys (http://www.measuredhs.com), but restrictions apply to the availability of these data, which were used under licence for the current study and so are not publicly available. However, data are available from the authors on reasonable request and with the permission of Demographic and Health Surveys. We sought and were granted permission to use the core data set for this analysis by Measure DHS.
Ethics statements
Patient consent for publication
Ethics approval
Procedures and questionnaires for standard Demographic and Health Surveys have been reviewed and approved by the ICF International Institutional Review Board (IRB). The ICF International IRB ensures that the survey complies with the US Department of Health and Human Services regulations for the protection of human subjects, while the host country IRB ensures that the survey complies with laws and norms of the nation (http://dhsprogram.com/What-We-Do/Protecting-the-Privacy-of-DHS-Survey-Respondents.cfm%23sthash.Ot3N7n5m.dpuf).
Acknowledgments
The authors thank Measure Demographic and Health Surveys (Measure DHS) for releasing these national surveys in the service of science, and the US Agency for International Development and other donors supporting these initiatives.
References
Supplementary materials
Supplementary Data
This web only file has been produced by the BMJ Publishing Group from an electronic file supplied by the author(s) and has not been edited for content.
Footnotes
Handling editor Sanni Yaya
Contributors Conceptualisation: HK, FT, AT, AV, DFC. Methodology: HK, DFC. Software: HK. Validation: HK, FT, AT, AV, DFC. Data curation: HK. Writing—original draft preparation: HK, DFC. Writing—review and editing: FT, AT, AV.
Funding This work was supported by two National Institutes of Health (NIH) grants (R01HD084233 and R01AI124389). Andrew Tomita was funded by the UKRI GCRF (MR/T029803/1).
Disclaimer The funder had no role in the design of the study and collection, analysis, and interpretation of data and in writing the manuscript.
Map disclaimer The depiction of boundaries on this map does not imply the expression of any opinion whatsoever on the part of BMJ (or any member of its group) concerning the legal status of any country, territory, jurisdiction or area or of its authorities. This map is provided without any warranty of any kind, either express or implied.
Competing interests None declared.
Provenance and peer review Not commissioned; externally peer reviewed.
Supplemental material This content has been supplied by the author(s). It has not been vetted by BMJ Publishing Group Limited (BMJ) and may not have been peer-reviewed. Any opinions or recommendations discussed are solely those of the author(s) and are not endorsed by BMJ. BMJ disclaims all liability and responsibility arising from any reliance placed on the content. Where the content includes any translated material, BMJ does not warrant the accuracy and reliability of the translations (including but not limited to local regulations, clinical guidelines, terminology, drug names and drug dosages), and is not responsible for any error and/or omissions arising from translation and adaptation or otherwise.