Article Text

Abstract
Introduction Non-fatal health loss makes a substantial contribution to the total disease burden among children and adolescents. An analysis of these morbidity patterns is essential to plan interventions that improve the health and well-being of children and adolescents. Our objective was to describe current levels and trends in the non-fatal disease burden from 2000 to 2016 among children and adolescents aged 0–19 years.
Methods We used years lost due to disability (YLD) estimates in WHO’s Global Health Estimates to describe the non-fatal disease burden from 2000 to 2016 for the age groups 0–27 days, 28 days–11 months, 1–4 years, 5–9 years, 10–14 years and 15–19 years globally and by modified WHO region. To describe causes of YLDs, we used 18 broad cause groups and 54 specific cause categories.
Results In 2016, the total number of YLDs globally among those aged 0–19 years was about 130 million, or 51 per 1000 population, ranging from 30 among neonates aged 0–27 days to 67 among older adolescents aged 15–19 years. Global progress since 2000 in reducing the non-fatal disease burden has been limited (53 per 1000 in 2000 for children and adolescents aged 0–19 years). The most important causes of YLDs included iron-deficiency anaemia and skin diseases for both sexes, across age groups and regions. For young children under 5 years of age, congenital anomalies, protein–energy malnutrition and diarrhoeal diseases were important causes of YLDs, while childhood behavioural disorders, asthma, anxiety disorders and depressive disorders were important causes for older children and adolescents. We found important variations between sexes and between regions, particularly among adolescents, that need to be addressed context-specifically.
Conclusion The disappointingly slow progress in reducing the global non-fatal disease burden among children and adolescents contrasts starkly with the major reductions in mortality over the first 17 years of this century. More effective action is needed to reduce the non-fatal disease burden among children and adolescents, with interventions tailored for each age group, sex and world region.
- child health
- indices of health and disease and standardisation of rates
- health policy
This is an open access article distributed in accordance with the Creative Commons Attribution Non Commercial (CC BY-NC 4.0) license, which permits others to distribute, remix, adapt, build upon this work non-commercially, and license their derivative works on different terms, provided the original work is properly cited, appropriate credit is given, any changes made indicated, and the use is non-commercial. See: http://creativecommons.org/licenses/by-nc/4.0/.
Statistics from Altmetric.com
Key questions
What is already known?
Non-fatal health loss contributes substantially to the overall disease burden among children and adolescents aged 0–19 years.
Continued monitoring of morbidity patterns is essential to guide targeted action to improve the health of children and adolescents.
What are the new findings?
This paper provides a comprehensive overview of global and regional levels and trends in the morbidity burden among children and adolescents between 2000 and 2016.
Levels and main causes of the morbidity burden vary substantially by sex, age and region.
Progress in reducing the morbidity burden among children and adolescents has been extremely limited.
What do the new findings imply?
Urgent implementation of known, effective interventions is needed to address the main causes of morbidity among children and adolescents.
Important variations between sexes, regions and age groups that become particularly apparent during adolescence need to be addressed context-specifically.
Introduction
There has been substantial global progress in young child survival over the past few decades. Between 1990 and 2018, the global under-5 mortality rate declined by more than half from 93 to 39 deaths per 1000 live births.1 Although the improvements in older child and adolescent survival have been less impressive, particularly in countries with a lower Socio-Demographic Index,2 3 improved monitoring of mortality patterns in these older age groups is underway.1 Much less attention has been given to the non-fatal health loss among children and adolescents.2 3 However, such data are essential for understanding the health, well-being, and social development needs of children and adolescents during this critical life period, and for informing interventions that could reduce or prevent this disease burden in the future.
Systematically monitoring not only mortality, but also morbidity patterns among children and adolescents, is essential for making a comprehensive assessment of the needs of this population,2 for several reasons. First, when looking at disability-adjusted live years (DALYs), a measure combining the morbidity and mortality burden, the contribution of the morbidity burden (expressed as years lost due to disability—YLDs) to global DALYs increases with increasing age, to reach a peak of over 50% at the age of 10–14 years in both males and females.4 Second, achievements in reducing the morbidity burden do not match progress in reducing mortality in young people. For example, there have been substantial reductions in pneumonia mortality among young children that have not been mirrored by similar reductions in morbidity.5 In fact, while rates of all-cause YLDs have decreased slightly between 1990 and 2017 among children and adolescents aged 0–19 years, the global number of YLDs has increased by 4.7%, calling for urgent action and more detailed monitoring.2 Third, the interventions required to reduce the leading causes of death may differ substantially from those needed to reduce morbidity and risk factors for future disease burden.6 7 Fourth, morbidity analyses may further highlight stark inequities in disease distribution that disproportionately burdens the poorest and most marginalised populations.8 Finally, morbidity is the most important cause of demand for healthcare services.
In this paper, we aim to describe global and regional levels and trends in the morbidity burden among children and adolescents aged 0–19 years between 2000 and 2016 as measured in YLDs. We further disaggregate these estimates by age, sex and cause to provide a systematic and comprehensive assessment of the morbidity burden from birth to 20th birthday.
Methods
Data source
The existing WHO Global Health Estimates (GHE) were the main source of data used for this secondary analysis.9 The GHE is an open-access comprehensive dataset, derived from the Global Burden of Disease (GBD) 2016 study,6 that provides comparable estimates for DALYs, years of life lost due to mortality, and YLDs for all age groups and regions globally. A detailed description of the data source and estimation methods is available elsewhere9 and compliant with the Guidelines for Accurate and Transparent Health Estimates Reporting.10
Outcome
YLDs are modelled estimates that aim to capture the amount of time lived in states of less than good health resulting from a specific cause. In the GHE, YLDs were calculated as the prevalence of a sequela of any given cause, multiplied by the average duration until remission or death, and by the disability weight for that sequela. The YLDs arising from a disease or injury are the sum of the YLDs for each of the sequelae associated with that disease or injury. The disability weight is a weighting factor that reflects the severity of the disease on a scale of 0 (perfect health) to 1 (equivalent to death). For example, for mild hearing loss, a disability weight of 0.010 was used, and for complete hearing loss, a disability weight of 0.281. For independent comorbidities, adjustments were made such that summed YLDs across causes reflected the sum of the overall health loss for the individual. However, individuals with the same functional health loss from one or more causes were treated the same regardless of whether that functional health loss came from one or several contributing conditions.9
For most sequelae, the GBD 2016 study computed estimates using a Bayesian meta-regression model designed to address key limitations in descriptive epidemiological data such as missing values, inconsistencies and large methodological variations between data sources. For some disorders, natural history models, back calculation from mortality rates or other methods were used to compute estimates. YLD estimates by cause, age, sex, country and year were adjusted for comorbidity using simulation methods.9 YLD rates are presented by 1000 population.
Uncertainty intervals
We calculated 95% uncertainty intervals (UIs) around the YLD rates as described elsewhere, using average relative uncertainty for each cause category.9 Trends were calculated as rates of decrease between the 2000 and 2016 YLD rates. Consistent with previously described methods,11 12 we applied the bootstrap methodology to calculate UIs around trend estimates. From the two uncertainty distributions (2000 and 2016), we took draws—assuming a 75% correlation between draws—and calculated 1000 rates of decrease. We present the 2.5th and 97.5th percentiles of the 1000 rates of decrease as the UI for the trend estimates. The calculations resulted in wide and sometimes asymmetric UIs around most estimates presented in our paper, reflecting great variations in some of the underlying data.
Cause categories
The WHO GHE use a standard set of cause of disease or injury categories. For the analysis presented in this paper, these categories were selected and combined into 18 broad cause groups and 54 specific cause categories. The 18 broad cause groups were derived from the 23 GHE ‘level two categories’ that were combined due to limited relevance of some level two categories for the ages 0–19 years. The 54 specific cause categories were based on the 178 specific GHE causes of disease/injury, which were selected or combined using the following criteria: (1) relevant to child and adolescent health; (2) specific and policy-relevant categories; (3) consistent with categories previously used for children under 5 years9 13; (4) fewest number of categories that still provide sufficient detail to capture main causes of ill-health for all age groups between 0 and 19 years across regions; (5) sum to total YLDs for each age group in each region (online supplemental appendix 1, p 1–10).
Supplemental material
Age groupings
A standard set of age groups for children and adolescents aged 0–19 years was used in our analysis, namely neonates (0–27 days); post-neonatal infants (28 days–11 months); young children (1–4 years); older children (5–9 years); young adolescents (10–14 years) and older adolescents (15–19 years).
Country groupings
We generated disease burden estimates by WHO regions14 that were modified to only include low/middle-income countries (LMICs).15 A separate group was created for all high-income WHO member states (HICs) globally. The income classifications were based on a country’s gross national income per capita in the year 2016.15 Lists of country groups are provided in the online supplemental appendix 1, p 11–12.
Patient and public involvement
Patients or the public were not involved in the design and conduct of this study.
Results
All-cause YLD rates
The global all-cause YLD rate for all ages between 0 and 19 years was 51 per 1000 population in 2016 (table 1), translating into 130 million YLDs. Males and females had similar YLD rates (51 vs 52), and both ales and females showed a decrease of 3% in all-cause YLD rates between 2000 and 2016 (52 in males and 54 in females in 2000).
Global all-cause YLD rates 2000 and 2016 and per cent decrease over time, by sex and age
Global YLD rates rose with age in both males and females, ranging from 30 in male neonates to 63 in older adolescent males, and from 30 in female neonates to 72 in older adolescent females in 2016 (table 1). During the neonatal period, YLD rates were similar in boys and girls, then higher in boys in post-neonatal infants, young children (1–4 years) and older children (5–9 years). The opposite was true in adolescents (10–19 years), with higher rates in females. All age groups showed decreases in YLD rates between 2000 and 2016 for males, females and both sexes combined. However, decreases in the first year of life were much higher than those in the adolescent years, ranging from 9% in neonates to 1% in young adolescents (table 1).
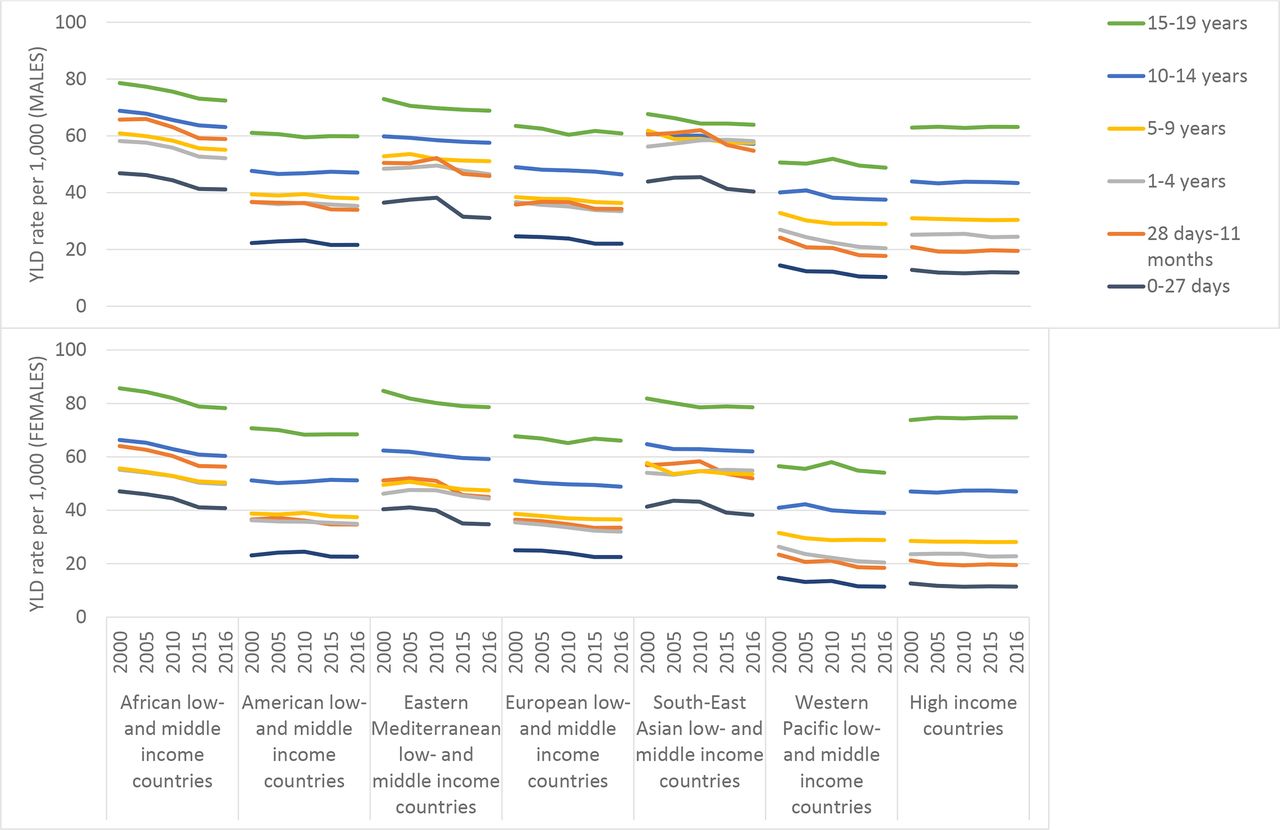
In 2016, males in African LMICs showed the highest all-cause YLD rates for neonates (41), post-neonates (59), young (63) and older adolescents (72), while males in Southeast Asian LMICs showed the highest rates for young and older male children (58 and 57). Across all age groups, Western Pacific LMICs had the lowest YLD rates in males in 2016 (even lower than in HICs) (10 in neonates, 18 in post-neonates, 20 in young children, 29 in older children, 38 in young adolescents and 49 in older adolescents) (figure 1, online supplemental table 2, p 13).
Supplemental material

All-cause YLD rates by modified WHO region, sex and age: 2000, 2005, 2010, 2015 and 2016. YLD, years lost due to disability.
Among females in 2016, neonates (41) and post-neonates (56) from African LMICs had the highest all-cause YLD rates; Southeast Asian LMICs had the highest rates for young children (55), older children (54) and young adolescent females (62); and Eastern Mediterranean LMICs for older female adolescents (79). Similar to men, lowest YLD rates in females in 2016 were observed in all age groups in Western Pacific LMICs (11 for neonates, 18 for post-neonates, 20 for young children, 29 for older children and 54 for older adolescents), with the exception of young adolescent girls who had the lowest rate in HICs (47) (figure 1, online supplemental table 2, p 13).
Across all regions, YLD rates rose with increasing age, with the widest gap between neonates and older adolescents among males and females in HICs (males: 12 in neonates vs 63 in older adolescents and females: 11 in neonates vs 75 in older adolescents) (figure 1, online supplemental table 2, p 13).
All age groups of all modified WHO regions and both sexes showed reductions in YLD rates between 2000 and 2016, except for young children from Southeast Asian LMICs where there was a relative increase of 3% in boys and 2% in girls, and older female adolescents from HICs (relative increase of 1%). Neonates, post-neonates and young children in Western Pacific LMICs had the greatest decreases in YLD rates (all over 20%) in both boys and girls (figure 1, online supplemental table 2, p 13).
Cause-specific YLD rates
Using the 18 broad cause categories, globally in 2016, for both males and females, the largest cause of YLDs was nutritional deficiencies for neonates (11 for boys and 11 for girls), post-neonates (18 for boys and 17 for girls), young children (14 for boys and 14 for girls) and older children (10 for boys and 9 for girls) (figure 2). For the adolescent age groups, the largest broad cause of YLDs was mental and substance use disorders: 15 for boys and 14 for girls among young adolescents, and 22 for males and 22 for females among older adolescents (figure 2, online supplemental table 3, p 14–18).
Supplemental material

Global YLD rates due to 18 broad cause groups by sex and age: 2000 and 2016. SIDS, sudden infant death syndrome; YLD, years lost due to disability.
Between 2000 and 2016, some progress has been made in reducing many of the most important causes for YLDs in several age groups, including over 20% relative reductions in YLD rates for infectious and parasitic diseases in male and female neonates as well as in post-neonatal infants. On the other hand, there was limited or no progress over time for some other major causes: for example, YLD rates from nutritional deficiencies in female neonates and in male young children have increased, as have YLD rates from neonatal conditions in both male and female young children, from respiratory diseases among older children of both sexes, from neurological conditions in all adolescent age groups except older male adolescents, and skin diseases in male and female young and older adolescents (figure 2, online supplemental table 3, p 14–18).
Table 2 presents the top three of the 54 specific cause categories, by sex, age group and modified WHO region, for 2016. YLD rates were over 10 in some age groups for three of the specific causes: iron-deficiency anaemia in African LMICs, Eastern Mediterranean LMICs and Southeast Asian LMICs; protein–energy malnutrition in Southeast Asian LMICs and depressive disorders in HICs.
Top three of 54 specific causes of YLDs by age, sex and modified WHO region, 2016
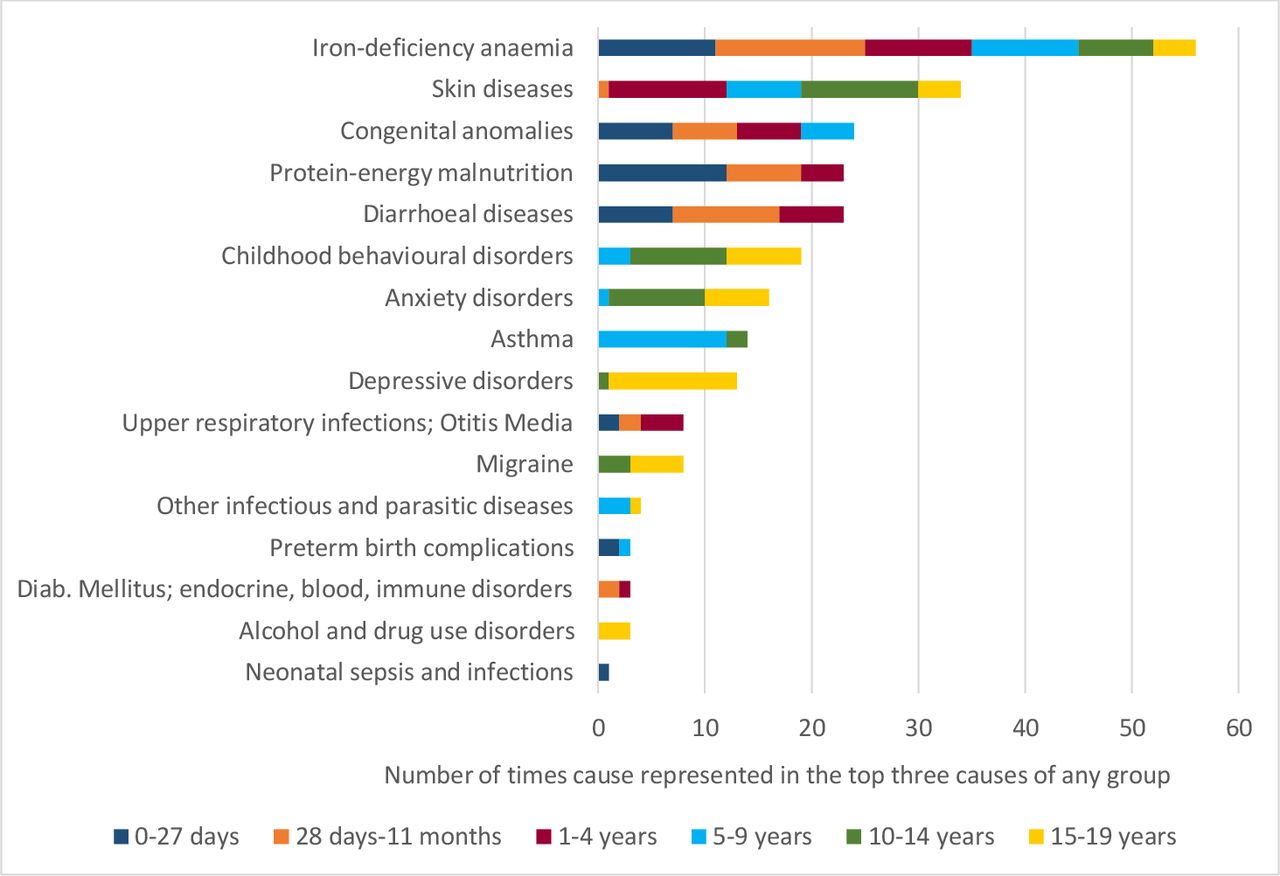
In total, 16 causes were represented in the top three specific causes in any of the 84 groups by sex, age and modified WHO region in table 2. Figure 3 summarises the number of times each cause was represented in any of those 84 groups. Iron-deficiency anaemia was represented 56 times, across both sexes, all age groups and modified WHO regions. Skin diseases were another important cause, being represented 34 times and across five age groups and all modified WHO regions except Eastern Mediterranean LMICs. While congenital anomalies, protein–energy malnutrition and diarrhoeal diseases were important causes of YLDs in the younger age groups up to 5 years; childhood behavioural disorders, asthma, anxiety disorders and depressive disorders were the most important for older children and adolescents.

Number of times each of the 54 specific causes was represented in the top three of any of 84 regional/sex/age groups, by age: 2016 (only those causes that appeared at least once are shown).
Discussion
Summary of findings
Consistent with other reports,2 6 our analysis shows that all-cause YLD rates were rising with age through childhood and adolescence for both males and females, and that progress in reducing this non-fatal health burden has been very limited over time across age groups and particularly in adolescents. The lack of progress might in part be explained by a predominant focus on reducing mortality and using mortality rates as a common metric of tracking global health progress.6 16 In fact, lifesaving interventions, particularly among very young children including preterm babies, might in turn have led to adverse effects on disability through increased risk of long-term disabling outcomes.17 While it is important to continue public health efforts to reduce mortality, much greater attention needs to be paid to morbidity, in order to ensure that all children and adolescents not only survive, but thrive and are equipped to attain their full potential as adults.18
We found the highest all-cause YLD rates for both males and females across age groups in African and Southeast Asian LMICs. While many of the main causes for YLDs were similar across regions, iron-deficiency anaemia across age groups and protein–energy malnutrition for children under 5 years of age stood out as causing most YLDs in African and Southeast Asian LMICs, with YLD rates of over 10 per 1000 population in several age and sex groups. Micronutrient deficiencies have been recognised as a public health problem in these regions, and urgent implementation of known effective interventions is needed to reduce the burden of these conditions.19 20
On the other hand, lowest all-cause YLD rates were observed in Western Pacific LMICs for males and females of nearly all age groups. As in other regions, nutritional deficiencies, particularly iron-deficiency anaemia and protein–energy malnutrition, were in the top three causes of YLDs in many sex and age groups, however, compared with other regions, YLD rates from these causes were relatively low. This may be explained by the previously described successful implementation of nutritional policies and public health strategies in China,21–23 the country driving estimates for Western Pacific LMICs due to its large population, and should stimulate similar action in other regions. Interventions included, for example, the establishment of an expert group to strengthen school nutrition guidance and provision of nutritious school meals in disadvantaged areas.
Our results also show that HICs were the region with the greatest difference in all-cause YLD rates between the youngest and oldest age groups, with YLD rates nearly five times higher in older adolescent males as compared with male neonates, and over six times higher in older adolescent females as compared with female neonates. Furthermore, YLD rates have slightly increased over time in adolescents between 2000 and 2016 in this region. We found that the main causes for this health burden were mental health disorders, including depression, anxiety, and childhood behavioural disorders in males and females, as well as alcohol and drug use in males. Other reports confirm this large and growing burden of mental health and substance use disorders among adolescents,2 24 which needs to be urgently addressed. Evidence suggests that many of these disorders occur during youth, and that early detection and intervention may hold great promise for improving long-term outcomes.24 25 Therefore, effective strategies should be implemented now and should include, according to a recent meta-analysis by Skeen et al,26 three programme components, namely, interpersonal skills, emotional regulation, and alcohol and drug education, provided their consistent effectiveness across different health outcomes. A menu of promotive and preventive interventions to improve adolescent mental health has become available recently as part of WHO Guidelines.27
In addition to nutritional deficiencies across age groups and regions, as well as mental and substance use disorders among adolescents, our analysis also identified skin diseases as an important cause of YLDs across regions and age groups; congenital anomalies and diarrhoeal diseases across regions in the younger age groups up to 5 years; as well as asthma among older children and younger adolescents. While there has been progress in reducing YLDs caused by congenital anomalies as well as diarrhoeal diseases (included in the category ‘infectious and parasitic diseases’ in our 18 broad cause groups), there has been no progress, or even increases in YLDs caused by skin diseases and asthma (included in ‘respiratory conditions’ in our 18 broad cause categories), particularly among adolescents. Previous reports confirm the large global burden of skin diseases with a peak in older adolescence, largely due to acne vulgaris and dermatitis,28 as well as the large and increasing burden of asthma in young people,29 and the lack of progress in reducing this burden. Air pollution has been identified as one factor negatively influencing both skin diseases and asthma,30 31 and every effort should be made to reduce this grave risk to human health affecting nearly everyone in the world. In a recent report, Schraufnagel et al present examples of actions taken that produced favourable results and can be applied in other settings,32 and WHO guidelines for air pollution exist that should be urgently implemented around the globe.33
Limitations
Our results need to be interpreted in light of a number of limitations. The estimation of YLDs is challenging, for several reasons: first, there is great variability in quality and completeness of underlying incidence and prevalence data for appropriate case definitions across and within countries, with the greatest gaps often in settings with the highest disease burden.6 9 Second, the availability of information on health state distribution and severity is limited, requiring the use of considerable assumptions for many causes when modelling the estimates.34 35 Third, there are limitations in the assessment of disability weights for health states.36 These challenges contribute to large uncertainty ranges around the YLD estimates, reinforcing the need for caution in interpreting and comparing estimates across groups, particularly estimates from high-burden countries where routine administrative data systems are weakest. There is a need for governments to substantially invest in strengthening their health information systems to improve disease burden surveillance in these countries, and relevant tools and resources are available from WHO and other organisations.37 38 Another limitation stems from the fact that the non-fatal disease burden is measured and expressed in terms of time spent in states of reduced function compared with optimal health, which may be a difficult concept to understand and translate into policy terms. However, the main causes of the disease burden for males and females of different ages and from different regions presented in our paper provide useful information for policymakers to act on.
Conclusion
To our knowledge, our article is the first one providing a detailed description of sex-specific, age-specific and region-specific variations in the non-fatal disease burden among children and adolescents. It draws on morbidity estimates generated by the wide network of experts from the Institute of Health Metrics and Evaluation at the University of Washington and their many collaborators in the GBD 2016,6 as well as WHO and their various interagency, expert advisory and academic groups. This well-established process has resulted in a set of standardised morbidity estimates that account for all major diseases and conditions, and which are available for all ages, regions and years dating back to 2000. Analyses of this comprehensive global morbidity dataset provide valuable information needed to improve the health and well-being of males and females at different ages and in different parts of the world.
Our findings highlight the disconnect between the dramatic gains made in survival between 2000 and 2016, particularly for young children,1 and the limited progress achieved in reducing the non-fatal disease burden among children and adolescents during this same period. They underscore the critical need to urgently address non-fatal diseases and conditions among children and adolescents, with a particular focus on older children and adolescents who suffer the greatest morbidity burden across all regions, while still maintaining a focus on young child survival where mortality rates remain highest. In tackling the morbidity burden, this report highlights some leading causes of non-fatal disease during critical age periods in childhood and adolescence, which have too often been neglected and where there has been remarkably little progress since 2000. These include iron-deficiency anaemia and skin diseases across regions and age groups; congenital anomalies and diarrhoeal diseases, as well as protein–energy malnutrition particularly in Southeast Asian LMICs, in children under 5 years; asthma in older children and young adolescents; and mental and substance use disorders among adolescents from all regions and particularly from HICs. To address these causes, menus of effective interventions and guidelines for different age groups exist39–41 that can help design programmes that will transform the next generation into healthier and more productive adults.
Supplemental material
References
Supplementary materials
Supplementary Data
This web only file has been produced by the BMJ Publishing Group from an electronic file supplied by the author(s) and has not been edited for content.
Footnotes
Contributors RG wrote the first draft of the manuscript and conducted the data analysis. EWJ contributed to the writing. CDM oversaw the data analysis, computed the uncertainty intervals and was involved in the generation of underlying data used for analysis, the WHO GHE. DAR oversaw the study and, in collaboration with RG, conceptualised the study. All authors reviewed and approved the final draft of the manuscript.
Funding The authors have not declared a specific grant for this research from any funding agency in the public, commercial or not-for-profit sectors.
Disclaimer The authors alone are responsible for the views expressed in this article and they do not necessarily represent the views, decisions or policies of the institutions with which they are affiliated.
Competing interests The authors declare no conflict of interest.
Patient consent for publication Not required.
Provenance and peer review Not commissioned; internally peer reviewed.
Data availability statement Data are available in a public, open access repository. Data for this study were sourced from the WHO GHE, available to the public here: https://www.who.int/healthinfo/global_burden_disease/en/ and here: https://www.who.int/data/maternal-newborn-child-adolescent-ageing.
Supplemental material This content has been supplied by the author(s). It has not been vetted by BMJ Publishing Group Limited (BMJ) and may not have been peer-reviewed. Any opinions or recommendations discussed are solely those of the author(s) and are not endorsed by BMJ. BMJ disclaims all liability and responsibility arising from any reliance placed on the content. Where the content includes any translated material, BMJ does not warrant the accuracy and reliability of the translations (including but not limited to local regulations, clinical guidelines, terminology, drug names and drug dosages), and is not responsible for any error and/or omissions arising from translation and adaptation or otherwise.