Article Text

Abstract
Background The burden of COVID-19 in low-income and conflict-affected countries remains unclear, largely reflecting low testing rates. In parts of Yemen, reports indicated a peak in hospital admissions and burials during May–June 2020. To estimate excess mortality during the epidemic period, we quantified activity across all identifiable cemeteries within Aden governorate (population approximately 1 million) by analysing very high-resolution satellite imagery and compared estimates to Civil Registry office records.
Methods After identifying active cemeteries through remote and ground information, we applied geospatial analysis techniques to manually identify new grave plots and measure changes in burial surface area over a period from July 2016 to September 2020. After imputing missing grave counts using surface area data, we used alternative approaches, including simple interpolation and a generalised additive mixed growth model, to predict both actual and counterfactual (no epidemic) burial rates by cemetery and across the governorate during the most likely period of COVID-19 excess mortality (from 1 April 2020) and thereby compute excess burials. We also analysed death notifications to the Civil Registry office over the same period.
Results We collected 78 observations from 11 cemeteries. In all but one, a peak in daily burial rates was evident from April to July 2020. Interpolation and mixed model methods estimated ≈1500 excess burials up to 6 July, and 2120 up to 19 September, corresponding to a peak weekly increase of 230% from the counterfactual. Satellite imagery estimates were generally lower than Civil Registry data, which indicated a peak 1823 deaths in May alone. However, both sources suggested the epidemic had waned by September 2020.
Discussion To our knowledge, this is the first instance of satellite imagery being used for population mortality estimation. Findings suggest a substantial, under-ascertained impact of COVID-19 in this urban Yemeni governorate and are broadly in line with previous mathematical modelling predictions, though our method cannot distinguish direct from indirect virus deaths. Satellite imagery burial analysis appears a promising novel approach for monitoring epidemics and other crisis impacts, particularly where ground data are difficult to collect.
- COVID-19
- geographic information systems
- epidemiology
- public Health
This is an open access article distributed in accordance with the Creative Commons Attribution Non Commercial (CC BY-NC 4.0) license, which permits others to distribute, remix, adapt, build upon this work non-commercially, and license their derivative works on different terms, provided the original work is properly cited, appropriate credit is given, any changes made indicated, and the use is non-commercial. See: http://creativecommons.org/licenses/by-nc/4.0/.
Statistics from Altmetric.com
Key questions
What is already known?
In Yemen, a reported spike in burial activity across different governorates during a period coinciding with the start of the COVID-19 pandemic suggested a potential increase in population mortality.
The burden of COVID-19 in Yemen and trajectory of the pandemic are unclear due to low testing capacity and disrupted health and demographic surveillance systems.
What are the new findings?
This is the first instance known to us of satellite imagery being used for population mortality estimation.
Across Aden governorate in Yemen, we estimated ≈1500 excess burials up to 6 July, and 2120 up to 19 September, corresponding to a peak weekly increase of 230% from the counterfactual.
What do the new findings imply?
Our findings indicate considerable excess mortality in this region of Yemen during the first wave of the COVID-19 epidemic, peaking and waning by September 2020.
Satellite imagery burial analysis is a promising novel approach for monitoring epidemics and other crisis impacts, particularly where ground data are difficult to collect.
Introduction
On 10 April 2020, Yemen recorded its first laboratory-confirmed COVID-19 case in the Southern governorate of Hadhramout. By the end of May, cases and deaths had been reported in the governorates of Aden, Taiz, Lahj and Sanaa.1 The pandemic’s impact on Yemen was expected to be severe, despite its comparatively young population.2 3 Transmission models parameterised based on China and Europe evidence initially predicted some 85 000 virus deaths, approaching the number reported killed during the country’s ongoing armed conflict.4–6 Additional risk factors of concern resulting from this 5-year protracted crisis included disrupted health services (only half of pre-existing health facilities were fully functional as of early 2020), shortage of health workers, overcrowding due to internal displacement, food insecurity and shrinking humanitarian aid.3 5 7–9
During May 2020, videos posted on social media showing large numbers of fresh graves suggested a spike in burial activity across several Yemeni governorates including Sana’a, Aden, Ibb and Al Bayda.10–12 In the southern city of Aden, the use of mechanical excavators in place of human gravediggers suggested that demand exceeded routine capacity.13 14 The medical organisation Médecins sans Frontières also reported a peak in hospital admissions, with a high case–fatality ratio in Aden during the same period.10 Separately, a shortage of personal protective equipment forced several hospitals to close or reject patients exhibiting COVID-19 symptoms.3 12 15
As of 9 October 2020, Yemen had reported 2049 confirmed SARS-CoV-2 infections with 593 deaths,16 but the reliability of these official numbers is undermined by low testing capability.17 18 A high COVID-19 case–fatality ratio (28.9%) is indicative of case underascertainment.19 20 The virus could thus be circulating undetected and unmitigated within communities, and the true mortality figures could be far higher than reported, as suggested elsewhere.21–23 Moreover, in Yemen’s protracted crisis, an epidemic could result in increased population mortality both directly (from SARS-CoV-2 infection) and indirectly (due to reduced access to healthcare, lack of healthcare workers and/or medical supplies, and/or the socioeconomic costs of the pandemic and related control measures, including worsened food security). Information on excess deaths can inform the ongoing response and provide evidence for additional resource mobilisation.24 Moreover, it may be combined with transmission dynamic modelling to infer the local state of progression of the epidemic.21
In this study, we used a novel method based on analysis of satellite imagery to remotely estimate excess mortality during a COVID-19 epidemic in Aden, Yemen. Our study had the secondary aim of establishing the method for possible application elsewhere.
Methods
Study population and period
Our analysis covered the entire Aden governorate (population ≈1 million: see further), consisting mainly of urban or periurban settlements. We systematically measured burial activity over: (1) a baseline prepandemic period starting in January 2016 and (2) the COVID-19 transmission period, starting 1 April 2020 (see further) until mid-September 2020.
Study design
We sought to exhaustively quantify the number of graves over time across the governorate and compare burial rates during the two analysis periods. After gathering qualitative information on local burial practices, we identified all recognised burial sites with any activity since January 2016 and quantified new graves over time increments bounded by the availability of successive very high-resolution (VHR) satellite images, either through visual annotation of individual features (burial plots) or inference from graveyard surface area changes. We used longitudinal statistical analysis techniques to model burial rates in the baseline and pandemic period, either: (1) for each burial site alone or (2) using the entire dataset. We then projected the baseline rate to the pandemic period as a counterfactual and used this to estimate excess deaths attributable to COVID-19. We also estimated population death rates using available demographic estimates. For comparison, we also present data on deaths notified to the Aden Civil Registry office, collected as part of a separate study.
Public involvement
Members of the public were involved in the design and the conduct of this research. During the feasibility and the implementation stage, we consulted members the Yemeni diaspora, country-based Yemeni researchers and civil society actors through in-depth interviews, focus group discussions and informal conversations to gather information about burial practices and cemetery locations. Furthermore, we formed an independent advisory group composed of country-based Yemeni researchers and public health actors to inform our understanding of the context, adopt an appropriate modality of dissemination and provide comments on the article before publication. Finally, to make our study accessible to a wider range of local actors, details of the results were summarised for a non-specialist audience and translated into Arabic. An Arabic version of the the abstract is also available.
Data sources
Burial practices
We first gathered informal information on burial practices in Yemen, including during the COVID-19 epidemic, from a network of researchers, civil society actors and the British Yemeni diaspora, that we interacted with as part of separate projects.
In urban settings of Yemen, a predominantly Muslim country, burial is usually performed in a cemetery within 24 hours, and cremation is not practised. Families’ choice of burial location depends on proximity, space and where other family members have previously been buried. A single grave is used per person except during periods of high conflict intensity when access might be disrupted and mass graves created (Aden has however known relatively little active conflict during the analysis period). Graves are usually flat, delineated by stones and at the same depth. There was no dedicated cemetery for patients with COVID-19 in Aden.
List of cemeteries
To identify all burial sites within Aden governorate that may have been active during the study period, we relied on the above network, geospatial datasets and gazetteers such as OpenStreetMap25 and Google Maps26 and visual inspection of VHR imagery to create a master list of burial sites. We mapped the boundaries of burial sites and noted salient characteristics including alternative names, burial patterns and specific communities said to use them. Across the governorate, 27 burial sites were identified. After triangulating all available data sources, we were able to classify with reasonable certainty 11 sites as active and 16 as closed or featuring no/very few new burials across the study period.
Satellite imagery
We sourced the most suitable available VHR images for each cemetery during the analysis period, ensuring they were cloud-free, of high radiometric quality and, most importantly, focusing on those with a spatial resolution between ~31 cm and ~40 cm per pixel (from Maxar’s WorldView 3&4). The higher resolution of 31 cm was preferred where available, as it provided the best clarity of features on the ground and ensured the most accurate identification of new burials. We used coarser resolution imagery (~40 cm to ~50 cm from Maxar’s WorldView 2/3/4 and GeoEye where no higher resolution alternative was available) to investigate its uses and limitations and, at a minimum, measure surface area changes (see figure 1below).

Publicly available media report drone photograph37© Associated Press (left-hand panel) of a section of Radwan cemetery, Aden, and corresponding VHR satellite image view © Maxar Technologies2020 (right-hand panel), both from 21 May 2020.
Images were purchased as Ortho Natural Colour via SecureWatch (https://www.maxar.com/products/securewatch) and were delivered preprocessed, corrected for illumination and geometric distortion and pan-sharpened. To further improve the detection of individual burial plots, some were enhanced using Edge Detection techniques (Sobel and/or Touzi filter, using the Orfeo ToolBox27).
Civil Registry records
The obtention of a burial clearance is mandatory to bury persons deceased within Aden governorate, regardless of place of death (eg, home or hospital) and whether burial is to take place in or outside the governorate. This document, normally issued by civil registry offices on the same day, does not specify burial location or cause of death unless the death happened in a hospital. Yemeni nationals deceased outside the country can be buried in Aden without issuance of a local burial clearance (these instances are, however, likely to be numerically negligible).
Available records of burial clearance requests to the Civil Registry offices of Aden governorate were tallied, covering the months of January–July 2020 and, for comparison, January–May in 2017, 2018 and 2019. Weekly records were available for weeks starting 4 May to 1 August 2020.
Armed conflict intensity data
We sourced armed conflict data compiled by the Armed Conflict Location & Event Data (ACLED) Project, which has carried out intensive collection and curation of media and local civil society reports of insecurity events and fatalities since 2015, in partnership with the Yemen Data Project.28 The dataset contained 2315 individual event records; we computed daily event and fatality rates for the subdistrict (administrative level 3) within which each cemetery is located and for all other subdistricts combined.
Population denominators
We computed population estimates for Aden governorate so as to calculate per-population death rates (note that death toll estimates were not reliant on population denominators: see below). Alternative base sources included: (1) Yemen Central Statistical Organisation (CSO) projections of June 2004 census data,29 assuming a 2.78% annual increase for 2015–202030 and (2) WorldPop annual (2016–2010) estimates, built on a predictive model that redistributes total census population into ~100 m2 grids based on relative population density.31 We averaged the two after weighting them based on a quality score computed from a published checklist (see online supplemental table S1).32 In 2016–2017 and 2019, respectively, the International Organisation for Migration (IOM) and the United Nations World Food Programme (WFP) published estimates based on CSO projections but adjusted for crisis-related forced displacement (we could not access details of methods for these adjustments): we applied the ratio of displacement-adjusted to CSO estimates to our weighted average to come up with a high-end denominator, which we used for analysis and which we assume better accounts for crisis-related migration than any of the base sources. Lastly, we smoothed the series to obtain monthly values (online supplemental figure S1).
Supplemental material
Imagery analysis
Manual annotation, also known as human visual interpretation, is a mature and widely applied technique used to extract useful information (eg. land cover and vehicles) from satellite images, whether conducted by expert analysts or non-expert volunteers, for example, in the humanitarian sector via initatives such as Humanitarian Open Street Map.33 34 An analyst can annotate a satellite image by assigning semantic labels that represent certain features as objects. While more time consuming, manual annotation results in lower uncertainty and higher precision when compared with automated and semiautomated annotation techniques. The use of expert annotators to create training label data was undertaken both as the extraction of burial information from satellite imagery is a new and previously untested approach, however also as accurately labelled data are a prerequisite to the potential development of automated machine learning based approaches proposed to undertake similar analysis quickly at scale. We used object-based image annotation to remotely locate and count the number of new individual burials (eg, circles of stones) within cemeteries when visible; in areas where individual burials were not visible, the annotation was undertaken using a ‘bounding box’ to delineate the change in total burial area over time.35 We relied on multispectral images and edge detection to manually identify and annotate cemetery features. Trained expert analysts manually tagged individual burials as ‘objects’ using point vectors in the QGIS open source software package.36 A total of 128 213 features were tagged across identified sites. Where possible, we used publicly available photographs and videos from media reports to validate our grave counts, as exemplified in figure 1.37 To ensure the accuracy of annotations, all features have been quality-checked by two other analysts.
Statistical analysis
While most of the available images featured sufficient resolution (30–35 cm per pixel) to identify individual graves, some (10/78, 12.8%) only had sufficient resolution (40–60 cm) to quantify expansions in surface area since the previous image time point. We thus imputed the missing grave counts through a predictive model trained on complete (both grave count and surface area) observations. Specifically, we fitted a quasi-Poisson generalised linear mixed model to the number of new graves since the previous image, with the natural log of new surface area as predictor, baseline grave count at the start of the time series as an offset and cemetery as random effect. The resulting model formula is:

where the response variable  , that is, the difference between burials B now and on the previous observation date in cemetery u, conditioned on u as the random effect;
  is the intercept;
  is the fixed effect coefficient of
  , namely the difference between cemetery area A now and on the previous observation date,
  is the offset and Z is the random effect design matrix; a quasi-Poisson model parameterises the variance of b as
  , where μ is the expectation or mean of b and θ an overdispersion multiplier, reflecting the skewed distribution of observed burial counts).
To avoid data sparsity, we did not partition data into training and holdout (validation) sets, but rather used leave-one-out cross-validation and the Akaike Information Criterion38 to quantify out-of-sample predictive power (see online supplemental table S2 and figure S3).
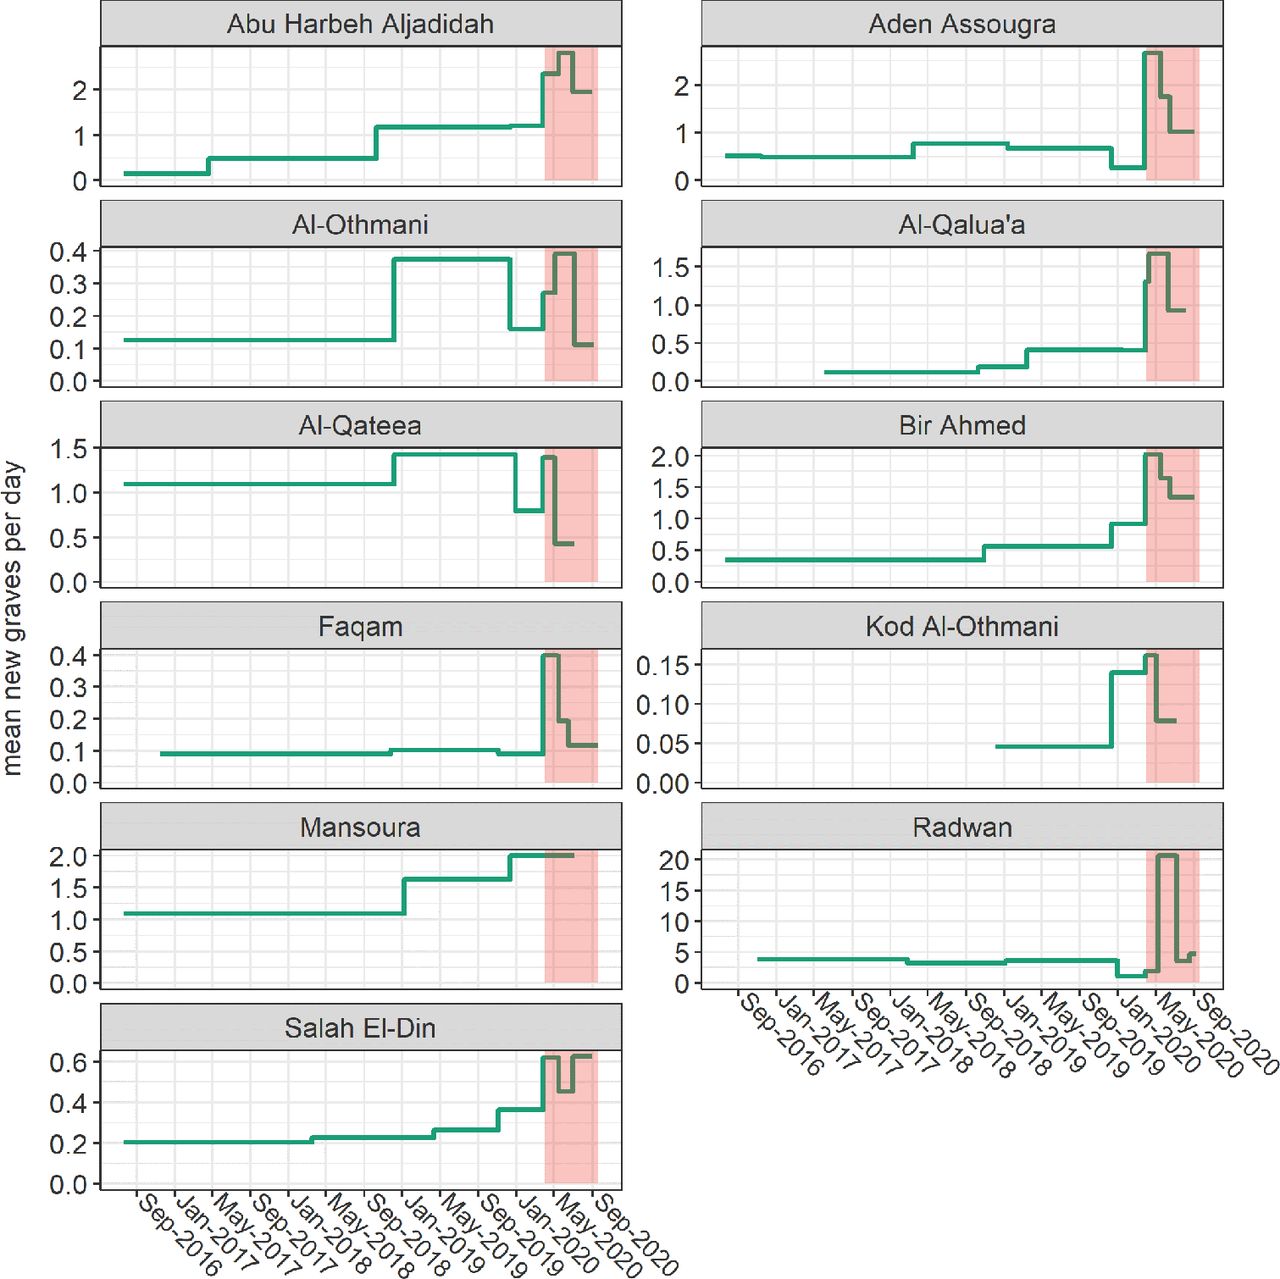
Given the timing of marked peaks in daily burial rates observed across most cemeteries (figure 2), we settled on 1 April 2020 as the most plausible start of the COVID-19 epidemic period in Aden governorate (this date is merely functional to our analysis, as detailed further, and is broadly interpretable as the earliest point at which COVID-19 attributable mortality would have caused a statistically observable excess: it is not to be mistaken with the date of virus introduction into Yemen). To estimate total and excess mortality during this period, we implemented two alternative approaches, as follows.

Evolution of burial rate over the analysis period, by cemetery. Each horizontal segment comprises the time span between consecutive images. The epidemic period (1 April 2020 onwards) is shaded in red. Note that the y-axis scales are cemetery-specific.
We first did a ‘case-based’ analysis of each cemetery: this consisted of interpolating cumulative grave counts between each observation through smooth splines or, for comparison, simple linear segments.39 As this approach rests solely on information from the cemetery itself, we refrained from any extrapolation beyond the timespan of data availability; furthermore, to provide governorate-wide estimates, we censored analysis at the latest time point for which an interpolated datum was available across all 11 cemeteries (6 July 2020: see table 1). To calculate a counterfactual (ie. burials in the absence of COVID-19) for each cemetery, we forward-projected the mean daily burial rate during the pre-epidemic (baseline) period (ie. prior to April 2020) into the epidemic period, with a small upward correction reflecting population increase since the baseline. We then subtracted this counterfactual cumulative burial number from the actual estimated number to yield the excess and related statistics (eg, burial rates per 1000 person-years), which we lastly summed across all cemeteries. We do not believe that this approach supports meaningful CI calculation and as such present only point estimates.
Availability of imagery and characteristics of cemeteries included in the analysis
Second, we fitted a predictive model to data from all cemeteries and used this to infer burials across the timespan of imagery availability for any cemetery (21 July 2016 to 19 September 2020). As the observed pattern of burials was non-linear, and after exploring various linear options (least squares, generalised linear or quadratic count models), we settled on a generalised additive model for location, scale and shape (GAMLSS),40 fitted using the R gamlss package; this framework allows for fitting non-linear smoothing functions and modelling both the mean and the shape of distributions of the dependent variable. We assumed a quasi-Poisson distribution for the cumulative number of graves since the start of each cemetery time series, with time (day) since the start of the analysis period as a ‘baseline’ growth predictor and time since the start of the epidemic period as a further ‘added growth’ predictor41; time was nested within cemetery as a random effect term to capture unmeasured factors explaining cemetery-specific growth trajectories. We used penalised B-splines of time42 as additive smoothing terms to estimate both the mean μ and the shape σ (overdispersion) of the distribution of graves. The resulting model formulae are
 , where b, the response variable, is now
  , that is, total burials at a given time in a given cemetery, and is a function of D, a two-parameter distribution specified by


Here,  is increasing time (days) from the start of the period, while
  is time since the assumed start of the pandemic in Aden, and s terms are polynomial smoothing functions that model the non-linear relationship between time and either the mean or the shape of the distribution of cumulative cemetery burials; these smoothing functions are themselves conditioned on the random effects of cemetery and time nested within cemetery.
We selected the final model through Akaike information criterion (AIC) and visual inspection of the observed fit, including model assumption diagnostics. We then used the model to predict the actual number of graves across all cemeteries, as well as a counterfactual (specified by setting epidemic time to zero), with the difference representing the excess. As GAMLSS models do not yield accurate SEs, we computed prediction CIs by posterior simulation from the model coefficient values. We also present (online supplemental table S5) an alternative model including the rate of insecurity events within the cemetery’s subdistrict as a further fixed effect, so as to adjust for conflict-related mortality changes; the addition of this predictor did not significantly improve model fit. We considered adding the reported incidence of SARS-CoV-2 infections in Aden governorate as a further predictor but did not have access to these data. Statistical analysis was done in R.43 Data and analysis code are accessible at https://github.com/francescochecchi/aden_covid, and we welcome alternative analysis suggestions.
Ethics
The Ministry of Health in Aden was notified of the former and approved collection of Civil Registry data. No identifiable personal data were used, and satellite images were not of sufficient resolution to identify individual people.
Results
Description of burial patterns
Table 1 summarises data availability and characteristics of the 11 cemeteries across Aden governorate for which available imagery indicated any activity between 2016 and September 2020. Six were within the city itself; five appeared to add graves solely by allocating new ‘blocks’, while the remainder partly or only adopted an ‘infilling’ pattern: these distinct typologies are illustrated in figure 3.
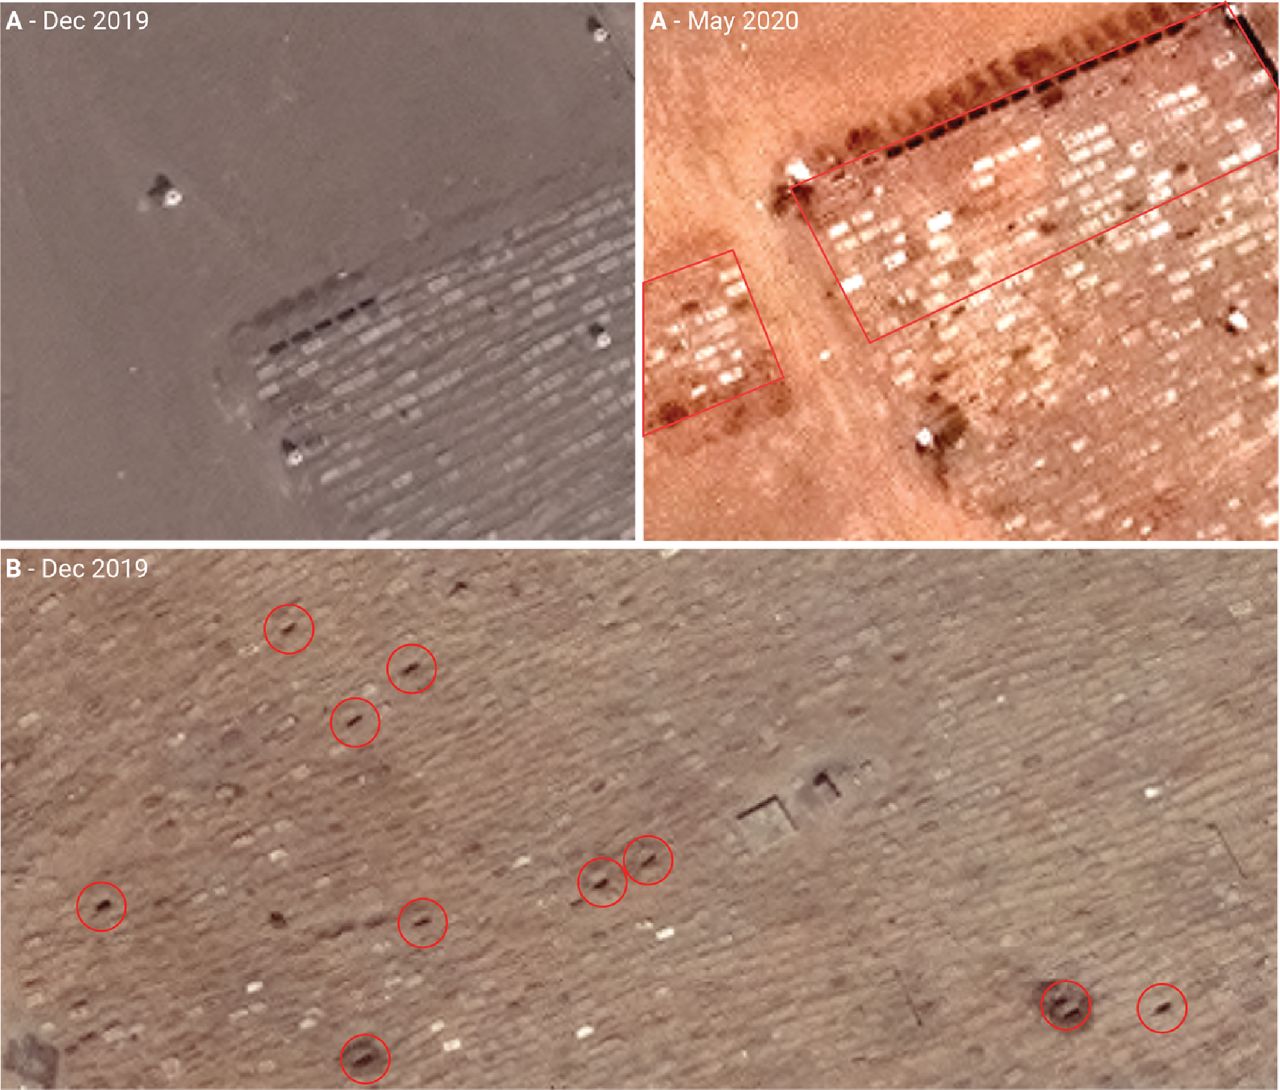
Sample of very high-resolution images from two cemeteries in Aden governorate, exemplifying the two typologies or burial pattern observed: (A) expansion into new ‘blocks’ (denoted by red outline) and (B) ‘infilling’ within existing burial area (denoted by red circles) Satellite imagery © Maxar Technologies.
On average, 7.1 images were available per cemetery, for a total 78 observations. Imputation of grave counts from surface area was reasonably accurate (online supplemental figure S9), and the model did not lose predictive power on cross-validation (online supplemental table S4).
As shown in figure 2, the trajectory of daily burial rates differed considerably across cemeteries; however, in nearly all, a peak during April–July 2020 was visible, with evidence of decline in some during August–September 2020.
Excess burial estimates
Summary estimates from the case-based analysis approach are shown in table 2; results by cemetery are in online supplemental tables S3 and S4. Smooth spline and linear interpolation yielded very similar estimates for the period 1 April to 6 July 2020 (96 days). Around 1500 excess deaths are estimated to have occurred during this period, corresponding to standardised mortality ratios of 2.68 (smooth spline) and 2.81 when comparing the actual burial rate to the projected counterfactual.
Estimates of baseline, epidemic-period and excess burials across Aden governorate, by analysis approach
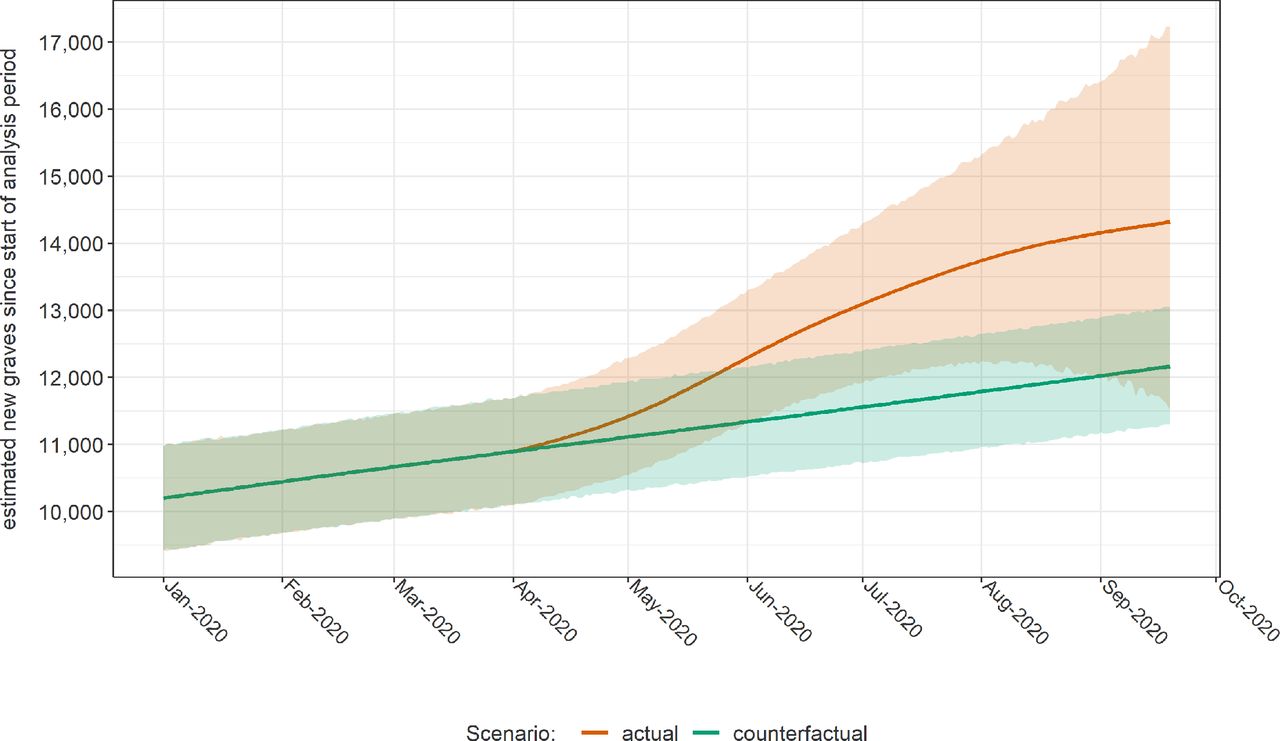
Table 3 shows fit statistics for the GAMLSS model of all cemeteries. Model diagnostics are shown in online supplemental figure S12, suggesting moderate departures from the assumed normality of residuals. Visual inspection indicated reasonable fit to observed data points, though the model considerably underpredicted or overpredicted burials during 2020 in two large cemeteries (Al-Radwan and Al-Qateea’; online supplemental figures S4 and S5). The model predicted a considerable increase in burials during April–July, with a resumption of the pre-epidemic rate of burial increase thereafter (figure 4). Overall, the GAMLSS approach yielded similar estimates to case-based analysis for comparable periods (table 2). By 19 September 2020, it predicted some 2100 excess deaths, though with a wide CI. An alternative model featuring the rate of insecurity events within the cemetery’s subdistrict as an additional predictor yielded 2413 excess deaths (95% CI 1427 to 3507); related data are in online supplemental table S6 and figure S4.
GAMLSS model fit statistics. Coefficients are exponentiated to provide linear scale rate ratios.

Evolution of the cumulative number of new graves across Aden governorate since the start of the analysis period, as estimated by the GAMLSS model, in actuality and in a counterfactual (no epidemic) scenario. Shaded areas indicate 95% confidence intervals. Only the year 2020 is shown.
Figure 5 and online supplemental figure S8 show, respectively, monthly and weekly (for 2020 only) comparisons of our statistical estimates with available records from the Civil Registry office: while patterns are consistent, the latter suggests a far steeper peak in death notifications in May 2020. During months before and after May, satellite imagery analysis yielded higher burial estimates; by contrast, Civil Registry records were consistently higher in earlier years, particularly in 2017 when satellite imagery estimated about half the number of burials as Civil Registry records (figure 5). During a period (April–July 2020 inclusive) when the two sources were both available, GAMLSS and Civil Registry yielded 2834 and 3417 total deaths/burials (crude death rate 8.8 vs 10.6 per 1000 person-years), and 1940 and 2205 excess deaths (6.0 vs 6.8 per 1000 person-years), respectively (we used the median number of monthly death notifications in 2017–2019 as the counterfactual Civil Registry value).

Comparison of monthly estimates of new burials across Aden governorate, by analysis method, and corresponding records from the Civil Registry office (blue columns). The horizontal dotted line and shaded area indicate the median, minimum and maximum monthly burials based on the 2017-2019 Civil Registry time series.
Discussion
This study offers evidence of considerable excess mortality temporally coinciding with COVID-19 transmission in Aden governorate and suggests that at least the first wave of the epidemic in this urban part of Yemen had peaked and declined by September 2020. Both satellite imagery estimates and Civil Registry records point to considerable underascertainment of the true burden of COVID-19: only 34 COVID-19 deaths were officially reported in Aden over our analysis timespan.16
Mathematical modelling estimates had suggested that, without mitigation measures, Yemen could see some 58–84 000 deaths (or about 1.9 to 2.8 per 1000 persons) from COVID-19 disease during the first 6 months of the epidemic.4 While this per capita prediction is broadly consistent with our estimate for Aden over a roughly similar timeframe (≈2.1 per 1000 persons or ≈2.4 if the model with insecurity events is used), our analysis encompasses deaths both directly and indirectly (eg, from other causes occurring in the context of overburdened health services and pandemic control measures: see further) attributable to COVID-19; during April 2020, severe floods affected Aden, and increased incidence of vector-mediated infections including malaria, dengue and chikungunya were noted in subsequent months. Moreover, it is plausible that SARS-CoV-2 has been more transmissible in Aden than in rural parts of Yemen due to greater social mixing, resulting in an earlier and more dramatic peak in the city; as such, our results should be extrapolated with caution to the rest of the country.
Given varyingly limited testing capacity and locally different approaches to defining and recording COVID-19 deaths, excess mortality may be the single most useful metric for establishing the full impact of the pandemic and drawing comparisons across geographical settings.24 44 This excess captures the ‘whole system’ impact of the pandemic, as summarised in figure 6. In Yemen, widely reported health facility closures to due lack of protective equipment, reduced confidence in health services and disruptions in humanitarian assistance could all have contributed substantially to increased non-COVID-19 mortality.

Diagram of direct and indirect contributions to excess COVID-19 mortality.
COVID-19 excess mortality evidence from low-income and middle-income countries is only beginning to emerge. Cities in high-income countries experienced peak death rates some 200% (London) to 400% (Madrid) and 600% (New York) the baseline during March–April 2020.45 While our findings indicate similar magnitude peaks in Aden (≈650% according to Civil Registry data, or ≈250% based on satellite imagery), at least three factors complicate this comparison: (1) Aden’s much younger population would, all else being equal, be expected to account for lower case–fatality ratios and thus per-capita mortality; (2) Europe and North America mortality reflects scenarios of high access to respiratory support and intensive care, while in Aden this is likely to have been limited; and (3) high-income countries mostly adopted strict and lengthy lockdown measures; by contrast, in Yemen and Aden, though school closures and restrictions on travel and public gatherings were reported,46 measures appear to have been of shorter duration, and at least countrywide, population mobility seems no lower than prepandemic.47 Additional factors, such as the specific gender, age and comorbidity profile of Aden’s population and travel during Eid Al-Fitr celebrations (end May 2020), may have played a role.
Considerable underascertainment of COVID-19 deaths has been reported in Damascus,21 Peru48 and various urban settings worldwide.49–51 While bureaucratic reasons (eg, counting only laboratory-confirmed cases) and limited testing and health service access account for some of this gap, stigma, distrust of COVID-19 services, rumours surrounding the disease and other sociocultural factors limiting service utilisation have been documented in Yemen.52 Taken together, these factors should fully be explored before concluding that the virus’ impact is adequately captured by formal surveillance statistics or that its severity is milder in low-income countries.
Study limitations
Problems with imagery availability and quality constrained the quantity of cemetery observations for analysis, reducing the accuracy of models and imposing limits on the period of analysis. Furthermore, the inherent inconsistencies (differences in viewing geometry, spatial and spectral resolution) of archive satellite imagery made it difficult to rapidly develop an automated, generalisable geospatial analysis method, and thus constrained us to a manual approach.
Comparison with Civil Registry data and with the projected crude death rate in Yemen (around 6 per 1000 person-years)53 suggests that imagery analysis underestimated the true death toll, particularly in more remote periods (note however that Aden’s young, working population might in fact have a lower death rate than nationally). Plausible explanations could include: (1) incomplete identification of active cemeteries (we could not access a formal list of cemeteries or a land registry against which to validate our list of 11 sites); (2) problems identifying fresh graves in cemeteries where ‘infilling’ took place, largely due to insufficient VHR imagery; (3) use of small burial plots; and (4) burial of decedents in ancestral hometown outside the governorate. The latter two phenomena are plausible when considering the reported spike in burial costs during the analysis period13 and the ongoing economic crisis affecting Yemenis. Uncertainty in population denominators could also bias estimated rates. By contrast, ground informants discounted other explanations such as mass graves and multiple bodies being buried together.
Additionnally, the difference between Civil Registry data and the imagery analysis could be explained by an ‘overcount’ that represents the difference between the number of burial clearance delivered and the number of deceased actually buried in Aden governorate, as families could chose to bury their deceased outside of the governorate. However, during period of high intensity, access to Civil registry services could also have been hindered.
Lastly, our analysis is subject to causal inference limitations: we cannot distinguish direct from indirect mortality; the temporal association of SARS-CoV-2 transmission and excess mortality is not conclusive evidence that the pandemic caused the observed increase in burials; and relatedly, it is inherently impossible to establish whether the counterfactual mortality trajectories we projected would indeed have borne out in reality.
Conclusions and further work
Despite limitations, we believe this novel satellite imagery method holds promise and could become an efficient option for rapidly monitoring population mortality in settings without effective vital registration, particularly where ground access is arduous. Moreover, if the method were applied prospectively, and given sufficient funding, data availability and quality could be improved by commissioning bespoke imagery with the desired specifications, an option increasingly available given the deployment of new satellite sensors and increased control over imagery acquisition. Our manually analysed dataset also offers a platform for developing techniques including (but not limited to) feature extraction, change detection, segmentation and supervised classification and training a machine learning model to perform automated analysis. Automation would in turn increase the method’s efficiency and enable its rapid implementation in many locations at once. Increased use of geospatial analysis in crisis-affected settings has been advocated elsewhere.54
Our study helps to characterise the epidemic progression of COVID-19 in a low-income, crisis-affected context and could help refine predictions of the virus’ future epidemiology in Yemen. Our excess mortality estimates allow international comparisons that can inform understanding of how different national strategies and policies have affected the spread and severity of the pandemic.
Abstract translation
This web only file has been produced by the BMJ Publishing Group from an electronic file supplied by the author(s) and has not been edited for content.Acknowledgments
We are grateful to colleagues at the United Kingdom Foreign, Commonwealth and Development Office, in particular Fergus McBean, for supporting this study. We also acknowledge the contribution of Anna Carnegie (LSHTM), Prof Huda Basaleem and Dr Khaled Zain (Faculty of Medicine and Health Sciences, University of Aden), the Yemen Analysis Hub at ACAPS, analysts and ground collaborators working with the Satellite Applications Catapult (including Benjamin Harris and Kazi Momin Ashraf), and organisations that shared population estimates and related information (the international Organization for Migration, the United Nations World Food Programme and Facebook Data for Good). Lastly, we are grateful to Dr Bothaina Attal, Dr Fouad Othman, Dr Ali Al-Mudhwahi and Dr Najwa Al-Dheeb for precious comments.
Supplementary materials
Supplementary Data
This web only file has been produced by the BMJ Publishing Group from an electronic file supplied by the author(s) and has not been edited for content.
Footnotes
Handling editor Seye Abimbola
Twitter @emilie_skb
Contributors ESKB and FC conceived the study and were in charge of the overall direction and planning. ESKB took the lead in writing the manuscript with support from FC and in consultation with AN, TF and MA. CR supervised the project at the Satellite Applications Catapult, Inc. AN, TF and YV collected the geospatial data. MA collected the qualitative information from Yemen. PC informed the selection of the models used to carry the analysis. FC designed the models and analyzed the data in consultation with ESKB. FC and ESKB interpreted the data in consultation with MA. ASBG collected and shared the civil registry data. All authors provided critical feedback and helped shape the research, analysis and manuscript.
Funding The satellite imagery study was funded by the UK Foreign Commonwealth and Development Office through separate grants to the London School of Hygiene & Tropical Medicine and the Satellite Applications Catapult, Inc.
Competing interests None declared.
Patient consent for publication Not required.
Ethics approval The satellite imagery study was approved by the Ethics Committee of the London School of Hygiene & Tropical Medicine (ref. 22458).
Provenance and peer review Not commissioned; externally peer reviewed.
Data availability statement Data are available in a public, open access repository. The data and code files that support the findings of this study are openly available on githhub.com/francescochecchi. https://github.com/francescochecchi/aden_covid.
Supplemental material This content has been supplied by the author(s). It has not been vetted by BMJ Publishing Group Limited (BMJ) and may not have been peer-reviewed. Any opinions or recommendations discussed are solely those of the author(s) and are not endorsed by BMJ. BMJ disclaims all liability and responsibility arising from any reliance placed on the content. Where the content includes any translated material, BMJ does not warrant the accuracy and reliability of the translations (including but not limited to local regulations, clinical guidelines, terminology, drug names and drug dosages), and is not responsible for any error and/or omissions arising from translation and adaptation or otherwise.