Article Text

Abstract
Background Ensuring benefits of free healthcare services are accessible to those in need is essential to achieve universal health coverage (UHC). Mauritius has sustained a welfare state over four decades with free health services in all public facilities. However, paradoxically, the national UHC service coverage index stood at only 63 in 2017. An assessment of who benefits from health interventions is, therefore, vital to shape future health financing strategies.
Methods The study applied benefit incidence analysis (BIA) to understand the distribution of healthcare utilisation and spending in comparison to income distribution. Also, a financial incidence analysis (FIA) was conducted to assess the progressivity of the health financing systems. Data from the national survey on household out-of-pocket (OOP) expenditure for health were used for the purpose of BIA and FIA. Concentration curves and concentration indices (CI) were nationally estimated and disaggregated to rural/urban levels. Kakwani index (KI) was calculated to assess the progressivity of private healthcare financing.
Results The CI for outpatient, inpatient and day care within the public health sector is estimated at −0.33, –0.14 and −0.14, respectively. Overall, CI in the public sector is −0.26. Benefit distribution in the private sector is pro-rich with CI of 0.27. Healthcare financing is regressive as demonstrated by a KI of −0.004, with the poorest population groups contributing a large share, in terms of taxes and OOP, to finance the health system.
Conclusion The BIA posits that government spending on public healthcare has resulted in significant pro-poor services distribution. This is largely offset by pro-rich distribution in the private sector. Thus, implying health financing strategies must be reviewed to promote financial protection against catastrophic health payments and bolster efforts to improve UHC service coverage index and achieve UHC Target 3.8 under Sustainable Development Goal 3.
- health policy
- health economics
Data availability statement
Data are available upon reasonable request.
This is an open access article distributed in accordance with the Creative Commons Attribution Non Commercial (CC BY-NC 4.0) license, which permits others to distribute, remix, adapt, build upon this work non-commercially, and license their derivative works on different terms, provided the original work is properly cited, appropriate credit is given, any changes made indicated, and the use is non-commercial. See: http://creativecommons.org/licenses/by-nc/4.0/.
Statistics from Altmetric.com
Key questions
What is already known?
Endorsing the 2030 Agenda for Sustainable Development, low-income and middle-income countries took a firm commitment to ensure universal health coverage (UHC), whereby every individual and community, irrespective of their circumstances, receive the health services they need without risking financial hardship.
An equitable health financing system which ensures distribution on the one hand benefits from health spending in the public sector in accordance with health needs and on the other the burden of paying for healthcare in the private sector is according to ability to pay are prerequisites for UHC.
What are the new findings?
Within the free public healthcare system the distribution of benefits is pro-poor with the lower income segment receiving a higher share of benefits from government health spending.
In the private sector, the richest receives a bigger share of benefits as the uptake of health insurance coverage is mostly among this group.
What do the new findings imply?
As the overall health financing system is slightly regressive and given the high-impact burden of indirect taxes, design and implementation of appropriate policies to alleviate their impact on households at low-income scale deserves urgent attention.
There is a dire need for further investment in the national system to address social determinants of health; more specifically, tackling underperformance of UHC service coverage index attributable to low scores in reproductive, maternal, newborn and child health; infectious diseases; and non-communicable diseases.
Background
The 2030 Agenda for Sustainable Development pledged that no one is to be left behind. Central to the 2030 agenda related to Sustainable Development Goal (SDG) 3 and Target 3.8 is achieving universal health coverage (UHC). SDG Target 3.8 and the United Nations Political Declaration on UHC emphasise concerns on growing inequity as the poor and other vulnerable population groups worldwide lack adequate access to quality healthcare.1
Mauritius, a small island state with a population of 1.27 million, has fared well with a steady annual economic growth over 3.5% over a period of two decades. The per-capita gross domestic product (GDP) rose to US$11 090 in 2019, thus catapulting Mauritius to the high-income group of countries. However, owing to the protracted COVID-19 pandemic, per-capita GDP is forecasted to be only US$9630 in 2021.2 The epidemiological landscape demonstrates a complete shift from communicable to non-communicable diseases (NCDs). NCDs accounted for 84% of diseases burden. Infant mortality rate dropped from 21.2 per 1000 population in 1990 to 10.6 per 1000 population in 2020. Life and healthy life expectancy at birth in 2019 were 74.1 years and 63.9 years, respectively.3 4 Progress made in terms of health indicators is largely attributed to a long tradition of welfare state policies with healthcare services available at no cost in all government-owned health facilities. More than 72% of healthcare services (inpatient, outpatient and day care) are accessed through a well- established network of public health facilities.5
Healthcare within the public sector is delivered around a well-delineated three-tier system, namely primary, secondary and tertiary care. At the apex of the healthcare delivery system are specialised hospitals (4), medical centres (2), regional hospitals (5) and district hospitals (2). These function as the last referral centres for a decentralised network of primary healthcare facilities which encompasses community hospitals (2), mediclinics (6), area health centres (19) and community health centres (114) within a defined demarcated area and population. Each of these peripheral healthcare delivery points, comprising the Primary health care (PHC) network, is located within a radius of 3–5 km of the residence of people, while catering for 9000 members of the community on average. The peripheral units are managed through a multidisciplinary team, namely medical and health officer, dental surgeon, community health nursing officer, dispenser and health inspectors. Outpatient services are also delivered at the community hospitals, mediclinics, and area and community health centres. The basic services delivered at community health centres include the diagnosis and treatment of common diseases and injuries, follow-up of referrals from hospitals, NCD clinics, antenatal clinics and well-baby clinics, immunisation, family planning, health education, nutrition education and counselling. In addition to these services, area health centres also run dental clinics, NCD screening, diabetic clinics and specialist sessions. The mediclinics also provide X-ray facilities and laboratory services. The secondary care level comprising two district hospitals and five regional hospitals provides primary inpatient and outpatient medical care to their respective catchment populations, including accident and emergency, general medicine, general and specialised surgery, gynaecology and obstetrics, orthopaedics, traumatology, paediatrics and intensive care services. At the tertiary level, all specialised hospitals and centres (namely the psychiatric, eye, and ear, nose and throat hospitals and cardiac centres) have inpatient and outpatient departments, except for the chest hospital which caters for inpatients only. In 2019, 2 million medical consultations were carried out at the PHC level, representing 36% of total cases seen by doctors across all public health institutions. Private healthcare has evolved in two forms: private practice of medical and dental care practitioners, and private clinics with inpatient beds and facilities for examination, consultation and diagnostic procedures. There are 13 clinics with inpatient and outpatient services operating in the private sector. In addition, there are six dialysis clinics, including those in private clinics.
General government health expenditure (GGHE) accounts for approximately 2% of GDP and 10% of general government expenditure. Notwithstanding free healthcare and relatively hefty government health expenditure there are three areas of concerns. First, Mauritius is witnessing a relatively high amount of out-of-pocket (OOP) expenditure on health, ranging from 49% to 52% as a share of current health expenditure. In absolute terms, OOP expenditure on health per capita rose from US$205 in 2012 to US$293 in 2017.6 Second, incidence of catastrophic health expenditure due to OOP (at 10% of household total income) increased from 6.52% in 2006 to 8.85% in 2012. This trend was also noted among the two poorest quintiles of the population (rising from 2.08% in 2006 to 3.24% in 2012 for the poorest quintile and from 2.95% in 2006 to 5.46% for the second poorest quintile). Third, impoverishment due to OOP based on international poverty line of US$3.1 daily among the poorest quintile rose from 1.01% in 2006 to 1.45% in 2012.7 This paradox of rising OOP and its implications within a setting where quality health is accessible free of charge prompts this paper to understand the distribution of healthcare utilisation, as well as the extent of inequity in terms of access to healthcare.
This study is motivated by several considerations and objectives. First, to assess the progress made in terms of UHC. The rising government health expenditure is not a sine qua non for better outcomes for all population strata unless expenditures are equitably distributed. Evidence emerging from several African countries demonstrates systemic misalignment of resource distribution among urban and rural hospital services. Resources and services have not always trickled down to health facilities serving the most vulnerable population and who are in dire need of the subsidies, thus hampering better outcomes and leaving population segments behind.
Second, as the public system of healthcare is financed through general tax revenue, the funding landscape will be adversely affected by the impact of the COVID-19 pandemic. The domestic economy contracted for the first time in 40 years by 15% in 2020. Full economic recovery is uncertain as the country experiences a protracted second wave of COVID-19 in 2021.8
Third, through the institutionalisation of national health accounts (NHA) in Mauritius, the objective is to generate evidence on the state of health financing including its efficiency, equity and sustainability.9 The NHA is a framework designed to track and measure total health expenditures as well as addressing the following questions: (1) How are resources mobilised and managed for the health system? (2) Who pays and how much is paid for healthcare? (3) Who provides goods and services, and what resources do they use? (4) How are healthcare funds distributed across the different services, interventions and activities that the health system produces? and (5) Who benefits from healthcare expenditure?10 However, the last question has not been sufficiently addressed in the previous NHA. The NHA is silent on equity aspect. Thus, this study assessed equity in distribution of health services and financing using standard benefit incidence analysis (BIA) and financial incidence analysis (FIA) methods.
Methods
Sources of data
The national survey on household OOP expenditure on health carried out in 2017 constituted the primary source of data. The survey included a representative sample of 2700 households, randomly selected, from the main island of Mauritius. Households’ coverage comprised 8870 persons with coverage representative of both urban and rural regions. The Island of Rodrigues was excluded from the analysis on the basis that the population is approximately only 3.5% of the total population of the Republic of Mauritius and private healthcare sector is non-existent. Furthermore, the unit costs of health services are not available as the cost centre project was not rolled out to Rodrigues Island.
Each sample was selected through a two-stage design with probability proportional to size. First, enumeration areas (EA) were selected with probability proportional to size of the population and followed by random selection of 45 households within each of the selected EAs. With a view to ensuring an even geographical distribution and sufficient representation of all socioeconomic groups of the population, EAs were classified into strata according to set of criteria (geographical districts and the relative development index which is a composite indicator developed to categorise EAs based on socioeconomic levels). The first stage sampling was built from the list of EAs obtained at the latest available housing and population census.11 Households, to be interviewed, were chosen randomly within each EA at the second stage. The first household was selected by the supervisory staff and, to proceed in a systematic way and avoiding bias, the next 39 households were then selected.
The survey collects a wide range of information on health-related behaviour, as well as corresponding economic and sociodemographic variables but equally important for the purpose of the BIA it includes information on outpatient visits to healthcare providers, hospital stays and health expense incurred. The survey distinguishes between public and private care and collects information at the level of household ownership. More specifically, the survey questionnaire requests each household respondent to quantify the number of times household members have attended a public and/or private health institution for each disease (chronic, non-chronic), injury or other health condition/problem (including pregnancy, dental, visual, disability, etc) and respective medical fees or OOP costs. The data are computed to estimate utilisation of various types of healthcare by households and the OOP costs or fees paid for inpatient stays, outpatient visits and deliveries, as well as insurance reimbursements for inpatient stays, primary healthcare visits and deliveries.
A household comprises a single person or a group of two or more persons dwelling under the same roof and sharing meals and other essentials for living. The average household size is 3.3 in the survey. The most common size of the surveyed household is 3 (24.5%) while the least common is 1 (8.1%). The surveyed household includes 19.3% of children aged less than 18 years (19.2% male and 19.4% female), 60.5% of individuals in the 18–59 years age group (61.7% male and 59.4% female) and 20.2% of household members aged 60 and above (19.0% male and 21.2% female). 48.7% of households surveyed in Mauritius draw a monthly income above MUR20 000.
The income at household level is calculated based on what the head of the household reported as respondent and this includes salary, pension, alimony, rent or any other income earned by all members of the household. Universal pension payable by the state to persons aged 60 years and above was also factored in.
Benefit incidence analysis
BIA is applied to measure the equity dimension in the delivery of health services, and more specifically the actual benefits, expressed in monetary terms, of healthcare utilisation that flow to individuals across various socioeconomic groups.12 BIA of public sector expenditure assesses whether the poor benefit from government health expenditure and have sufficient financial risk protection to avoid catastrophic health payments, as well as the impoverishing effect of OOP healthcare payment. BIA has been used extensively to measure the distribution of public subsidies.13 14
BIA results are commonly expressed as a percentage share of total benefits accruing to each socioeconomic group or by using concentration curves and concentration indices (CI). Virtual presentation of benefit incidence is relatively straightforward to interpret. However, the main limitation is that it does not allow a firm and conclusive opinion as to whether the distribution is pro-poor or pro-rich.10 The CI, which is linked to the concentration curve, allows for a decisive quantification of the extent of inequality in distribution of health services. Also, the CI ensures analysis of results over time periods and regions.15
The statistical significance of CIs was determined and represented twice the area between the concentration curve and the 45-degree line of perfect equality. A CI ranging from 0 to 1 signifies a pro-rich distribution. Conversely, a CI ranging from 0 to −1 suggests a pro-poor distribution. A CI of 0 indicates a situation of no inequality. CIs were estimated for the three levels of delivery healthcare. CIs were measured over gross benefits in the public sector as there is no payment levied on any patient. Net benefits (OOP expenditures less insurance reimbursements) were used when estimating CIs in the private sector.
A five-step approach was implemented to conduct BIA16:
First, ranking households from the Household OOP Survey in quintiles from poorest to richest using income variables.
Second, estimating utilisation of different types of health services for each household.
Third, multiplying the utilisation rate of different types of health services and the respective unit costs (generated under the cost centre project) to determine the subsidy provided by the state. The product represents the actual benefits being accrued. Under the conventional methodology, user fees are deducted from unit costs to determine the quantum of subsidy provided. In this study, user fees are discarded as all healthcare is provided free in all public health institutions.
Fourth, aggregating benefits of utilisation expressed in monetary terms for each household.
Fifth, comparing the distribution of health service benefits to a distribution of socioeconomic status by income quintiles.
The income at household level also includes non-contributory universal basic pension payable to any individuals aged over 60 years. Approximately 16% of the population are beneficiaries of the pension which accounts for nearly US$160 monthly.
The benefit incidence of a particular group j using a particular service i (inpatient, day care or outpatient) in a public health facility is estimated as per equation described below16:

where yi is the gross benefit of public subsidy enjoyed by group i,
Xij is the utilisation of delivery care i by group j,
Xi is the utilisation of delivery care i by all groups,
βi is government net expenditure on delivery care i,
µij is group j share of utilisation of delivery care i.
With no available harmonised costing data of health services in the private sector, and as most of OOP payments as reported by households were from private-for-profit providers, the payments were deflated to reflect the actual cost of services. As medicines purchased over the counter account for 12% of OOP (with a maximum mark-up profit of 35% authorised by law) and given that the other services provided at the level of clinics, private general practitioners and medical institutions (including laboratories) account for nearly 88% (assuming a 52% profit mark-up), a weighted average deflator of 50.2% is applied to reflect the actual cost. Private health insurance coverage is still nascent in Mauritius but nevertheless any reimbursement that households reported as received during the survey was offset against OOP payment. Since 2001, a grant is available for patients who require treatment outside Mauritius. Such grants were incorporated in the calculation of benefits.
Unit cost estimation
Unit costs were estimated for the three-tiered delivery levels, namely outpatient, inpatient and day care. Table 1 shows the unit cost estimates as calculated using the average unit costs of wide array of services generated through the cost centre project implemented at regional hospital level; for instance, the cost per outpatient visit is an average of sorted outpatient department (including gynaecology and obstetric, cardiac, paediatric, dental, among others), and accident and emergency department. Cost per day care visit is a weighted average of care provided at cardiac day care, dialysis centre, physiotherapy and radiotherapy department. Cost per inpatient admission is a weighted average of stay in intensive care unit, cost of different types of surgery and cost of stay in different specialty wards. Notwithstanding healthcare and medicines in Mauritius are free of charge in public health facilities, patients resort to purchase equivalent brand products from the private pharmacies using OOP. There is a general perception that generic medicines supplied at public facilities are of low quality.7 17 18 When reporting the visits at public hospitals, households are also requested to state the amount spent for purchase of medicines over the counter from private pharmacies.
Average unit cost of health service at hospital level
Financial incidence analysis
The healthcare financing in the public health sector is based on the Beveridge model where the state acts as a single payer and finances all services through revenue raised through national taxation. In 2017, Government general health expenditure (GGHE) accounted for 12.4% of total taxation revenue raised through taxes on income and profits, property, and goods and services. The Ministry of Health and Wellness was the main financing agent in the public sector, with expenditure on healthcare goods and services estimated at MUR10.8 billion in 2017 and followed by municipalities and district councils which spent MUR654 million accordingly. The Ministry of Social Integration, Social Security and National Solidarity had a meagre expenditure envelope of approximately MUR166 million. Financing of healthcare services in the private sector is based on user fee. Direct OOP accounts for 84% user fee payments and the remaining is distributed between voluntary health insurance schemes (12.6%), enterprise financing schemes (2.6%) and non-profit institutions serving households financing schemes (0.8%). Employer-based insurance (other than enterprises schemes) represented 70% of voluntary health insurance schemes and these insurance policies are financed through contributions from both the employee and the employer. Notwithstanding that public health expenditure has been on the rise over two decades, that of the private sector has been growing at a faster rate and overtaking that of the public sector and accounted for approximately 53.5% of total health expenditure in 2017.19
To attain the UHC target, as well as other national programmatic targets, a key requisite is a health financing system which is pro-poor. An important attribute for the financing system is ensuring that contributions to costs of healthcare are in proportion to different households’ ability to pay (ATP) and the health needs. Thus, policy makers and planners need to have good evidence on the distribution of the benefits of public subsidies and of the burden of paying for health services. Through the FIA approach this is feasible.9
Also, it is worth noting that FIA attempts to determine the extent to which the burden of health financing impacts on the underlying distribution of income.20 The FIA is built on the premises that to achieve equitable health financing system, payment for healthcare is subject to ATP. The FIA therefore allows measurement of the progressivity of health financing systems by assessing the departure from proportionality in the relationship between payments for healthcare and ATP.21 The core steps in conducting FIA are summarised as follows22 23:
First, collecting household data on various mechanisms of health financing in the country such as direct and indirect taxes, private insurance contributions and OOP payments. Indirect taxes (value-added taxes, VAT) were based on the average share of VAT in total household prefiscal income estimated at 32%, and which ranges from 42% among the bottom 20% of households to 26% among those at the top 20%.24 The household data set contained information on income that was used to rank households by socioeconomic status.
Second, determining the health financing mix from the reliable sources such as the NHA.
Third, weighing the household data set to obtain a national perspective.
Fourth, determining the share of healthcare payment from each mechanism to household consumption expenditure for each income quintile.
Fifth, combining all sources to determine the overall progressivity of the health financing system.
The extent of progressivity of a financing system depends on the distribution of income on health across the population. It is progressive when the share of income spent on healthcare is more significant among higher household income earners. Conversely, it is regressive when households with lower income spend a higher share of their income on healthcare services than other higher income earners. Finally, the financing system is neutral with every household spending a similar share of their income on health irrespective of their income level.12 25 26 Prior to drawing any conclusion on the scope of a healthcare financing system, a micro assessment of each type of financing as well as weighting each distinct financing source by their shares in total health finance is required. The most widely accepted indicator to assess the scope of a health financing system is the Kakwani index (KI). The KI represents twice the sum of the area between the concentration curve of health payments and the Lorenz curve.16 27 The KI is calculated as:

where C is the CI for health payments and G is the Gini coefficient of the ATP variable. πK ranges from −2 to 1. A positive KI value infers a progressive financing system with the concentration curve of healthcare payment lying outside the Lorenz curve. Conversely, a negative value represents a pro-rich or regressive healthcare payment system. The third situation is when the KI is zero and the concentration curve lies on top of the Lorenz curve, implying that the healthcare payment is proportional to ATP.28
To assess whether health financing is progressive or regressive, the three core sources of funding health services will be considered. The two main components of taxation, namely personal income tax and VAT, are considered. During the period analysed, that is 2017, a uniform tax rate of 15% was imposed with exemption applicable for the first MUR300 000 and up to MUR550 000, depending on the number of dependents in the household. The computational analysis also considers government assistance introduced in 2017 in the form of negative income tax between MUR100 and MUR1000 for persons in receipt of monthly employment income up to MUR9900. A VAT of 15% is levied on all goods and services that are standardly rated, that is, excluding the zero-rated and exempted goods. The third component of funding OOP expenditure includes doctors and dentists’ fees, payment to private clinics and over-the-counter purchase of medicines.
Socioeconomic status of households
As the survey on household OOP expenditure on health collects only income and revenue data within each household and not consumption expenditure, for the purpose of the BIA and FIA the socioeconomic status of households will be measured in terms of revenue generated by the household. In view that ATP for health services among households with similar income will depend on the actual size and age composition (adults and children have distinct health needs), it is critical to compare incomes that are equivalent across households. This is best done by applying an ‘equivalence scale’ to the household income. For this study, the household income was adjusted for household size and age accordingly to obtain an adult equivalent (AE) estimate.29 The number of AE household members is defined as:

where A is the number of adults in the household, β is the weighted cost of children, C is the number of children (less than 18 years old) and α is the degree of economies of scale. The values of β and α are assumed to be 0.5 and 0.75, respectively.30–32
Results
Descriptive statistics
Table 2 provides a descriptive statistic of the households surveyed in the context of the OOP survey in terms of age and gender, household sizes and visits at the three delivery levels in public health facilities. 58.8% of the households surveyed had at least four members more while 41.2% had less than four members. 59.1% of the households reported at least six visits at any of the three levels of the public health facilities over a 10-month period in 2017. In terms of inpatient and day care admission, only 6.29% and 2.49% of households, respectively, reported more than one admission over a 10-month period in 2017.
Descriptive statistics of sample profile of the Household OOP Survey, 2017
Distribution of healthcare benefits
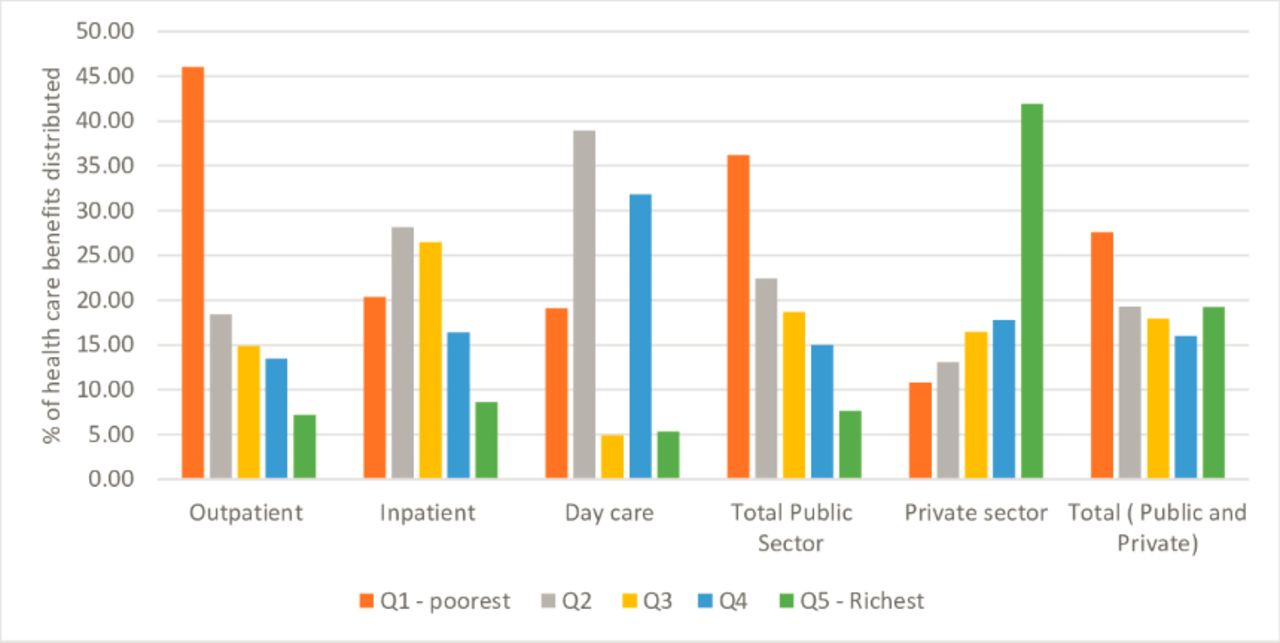
Figure 1 illustrates the distribution of benefits from different types of services and providers across all socioeconomic groups. The distribution of benefits at the level of outpatient and inpatient services in the public service showed a socioeconomic gradient. However, day care services in the public sector displayed no socioeconomic gradient. On the other hand, in the private sector, the socioeconomic gradient is skewed towards the richest two groups. Overall, benefits combining the public and private sectors demonstrated a pro-poor socioeconomic gradient, driven by the gradient of benefits from the public sector.

Choice of healthcare providers and distribution of healthcare benefits by facility and income.
Figure 2 builds on figure 1 and shows the distribution in quantitative terms as well through concentration curves. The distribution of outpatient care benefits was much skewed towards the lowest income quintile which received at least 45% of benefits. As the concentration curve largely dominated the 45-degree equality line and reflected by a negative CI (−0.33), the distribution of outpatient services in the public sector is pro-poor. The CI was found to be statistically significant at the 5% level. With regard to inpatient care, the poorest 20% received almost an equal share of total healthcare benefits from public services (20.33%). The second poorest 20% received a greater share of benefits than the least poor households, 28.45% of healthcare benefits more precisely. Similar to outpatient services, the concentration curves for both inpatient and day care dominate the line of equality. The CI for inpatient was −0.14, suggesting a pro-poor benefit distribution. The concentration curve for overall public sector services dominated the line of equality and the distribution of health services was pro-poor with a CI of −0.26.
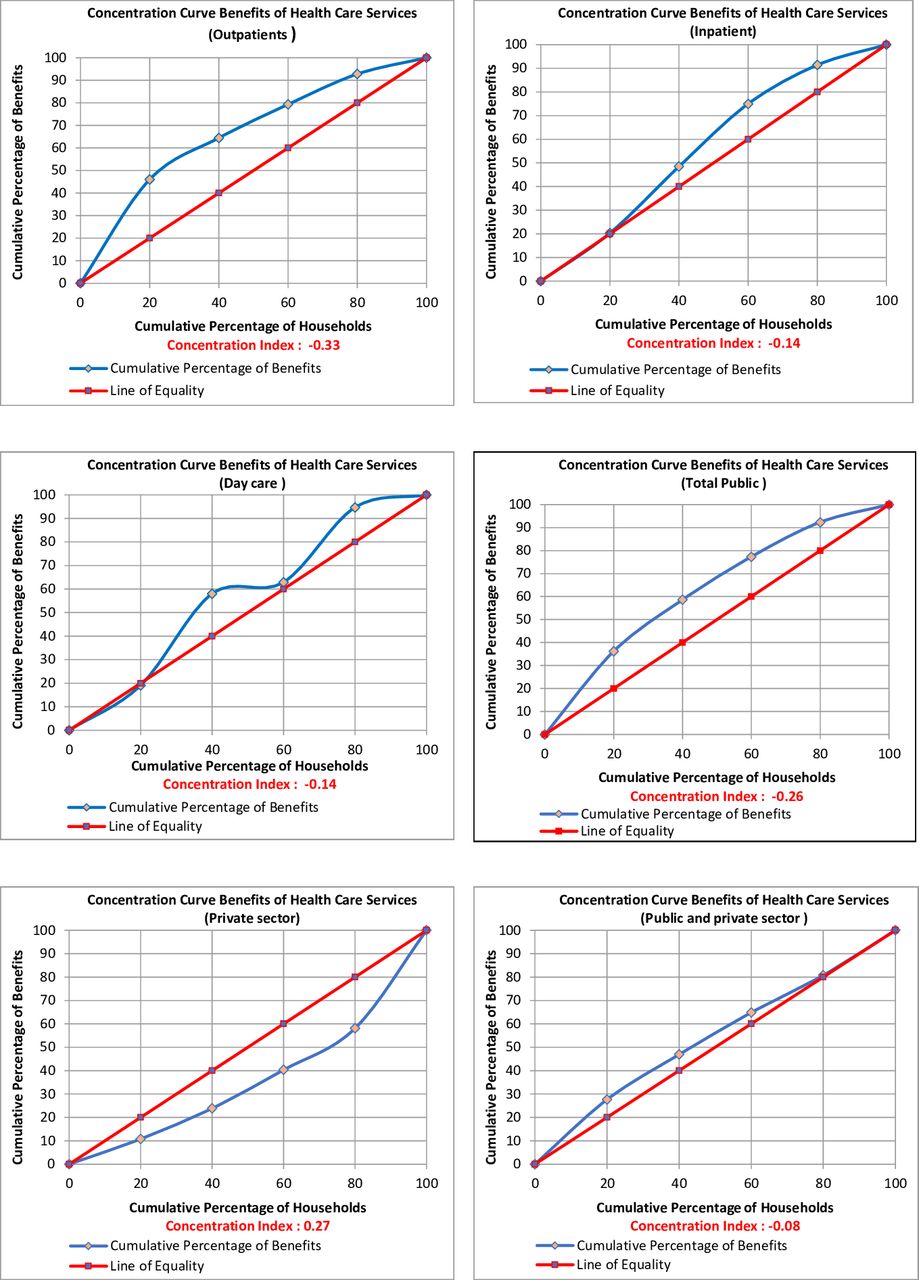
Distribution of healthcare benefits by facility and wealth quintile (concentration curve).
Benefits from private-for-profit providers were as expected pro-rich, with the richest 20% amassing 41.90% of health benefit while the two poorest 20% enjoying only 10.79 % and 13.07% of total benefits, respectively (figure 3). With a CI of 0.27, the line of equality dominates the concentration curve across all the income quintiles.

Distribution of healthcare benefits relative to needs.
The CI is −0.08, after aggregating public and private health services, denoting a slight pro-poor distribution overall. The concentration curve dominates the line of equality in the case of the two poorest quintiles. However, the statistical test of dominance concludes that the pro-poor rich distribution is insignificant.
Analysing the distribution of health benefits by regions (rural and urban) from table 3 shows a similar result as that observed from a national perspective. The difference in total healthcare benefits within the public sector between rural and urban populations was minor (CI=−0.22 and −0.13 in rural and urban populations, respectively); likewise, the differences when the CIs were disaggregated into provider types, except for day care services. The distribution of public health services at day care services in rural areas was pro-poor (CI=−0.22) while the CIs for day care in urban areas were pro-rich (CI=0.14). In the same vein, considering the private sector, no substantial difference in inequality was observed between rural (CI=0.28) and urban (CI=0.24) populations. The distribution of healthcare benefits at outpatient and inpatient service delivery was significantly pro-poor for both rural and urban areas (CI ranging from −0.11 to −0.23 and t-values above 2.71). It is interesting to note that for both outpatient and day care the degree of equality is higher and much pro-poor in the rural areas than urban areas (CI=−0.22 and −0.11 in rural and urban areas, respectively, for outpatients; CI=−0.23 and −0.17 in rural and urban areas, respectively, for inpatients).
Distribution of healthcare benefits, rural versus urban
The distribution of healthcare benefits for the public sector was relatively pro-poor when assessed with respect to the level of health need observed in each socioeconomic group. For instance, the poorest 40% of the population accounted for 51% of total assessed health needs but received 58% of public sector benefit. Conversely, the richest 40% of the population have 30% of total assessed health needs but received 23% of public sector benefit. From an overall perspective, combining public and private sector benefits, a distinct pattern was noted with relatively pro-rich trend. In fact, the poorest 40% of the population received 43% of total benefits when total assessed health needs accounted for 51%. In the same vein, the richest 40% of the population received 39% of total benefits when total assessed health needs accounted for 30% (figure 3).
Distribution of health financing incidence
Table 4 shows that overall the healthcare financing system is regressive or pro-rich as demonstrated by a KI of −0.004, with the lowest income population groups contributing a large share. Direct tax, in the form of personal tax, has a progressive distribution of personal income, as opposed to VAT—the KI has been positive (0.30) and negative (−0.04), respectively. This implies that the poorest households contribute more of their income to revenues raised from VAT. In the same vein, the negative KI (−0.13) for OOP confirms that the poorest households contribute more OOP to health system financing than the richer households. Voluntary insurance which contributes only a meagre 7% of total financing of health services is progressive and pro-poor as the KI is 0.1.
Kakwani index of various financing sources and total health financing
Discussion
The findings show that the distribution of total benefits for private health facilities is overall pro-rich. The dimension of the CI is almost equal to that in the public sector. These findings are similar to an assessment carried out in sub-Saharan countries, namely Kenya, Ghana and Tanzania. In Ghana, the benefits from the private sector for outpatients and inpatients were highly concentrated in richer groups as demonstrated with CIs of 0.1807 and 0.4086, respectively. In Tanzania, inpatient care benefits from private providers were largely concentrated among richer groups with CI of 0.68.11 25 33 34 It is likely that with the richest households able to afford and pay for private healthcare, this may alleviate the workload of the public sector to allocate substantial resources to the poorest in need of care while delivering on quality care; consequently, promoting equity in terms of access to quality healthcare. However, OOP in Mauritius remains relatively and significantly high among the poorest, especially in a context where there is no social health insurance. This is so also when there is general perception of low-service quality in public sector. This may exacerbate the risk of catastrophic health expenditure and risk of impoverishment among the poorest households which already stood at 3.24% and 1.45% in 2012, respectively.6
Pursuing the principles of welfare state, there is an established policy to provide financial assistance to those who require overseas treatment due to its non-availability in Mauritius. A maximum cash grant of MUR800 000 (approximately US$20 000) is available while the eligibility for the overseas treatment scheme is a monthly income not exceeding MUR100 000 for a household.35 The introduction of a negative income tax since 2017 in the form of a cash grant, however, is relatively too meagre to promote a pro-poor distribution in private facilities. In the same breath, a minimum wage of MUR10 000 was introduced in 2019 but this is not captured in the study. The minimum wage will undoubtedly impact favourably on future BIAs in terms of higher pro-poor distribution of health benefits as the survey revealed a non-negligible amount of household reporting income below the current minimum wage. Future FIAs will determine the true impact of this measure in terms of making private healthcare affordable to meet healthcare needs.
A core objective of the current national health sector strategic plan for the period 2020–2024 is to review the health financing strategies. However, with a tightening of the fiscal space in the wake of the economic consequences of the pandemic, it remains to be seen whether there will be any progress on the pro-poor distribution of healthcare, and also if the country will improve its current score of the UHC service coverage index (which is relatively low: 63% in 2017 for a country where free healthcare is applicable) to achieve the SDG Target 3.8 on UHC. The low performance of UHC service coverage index is largely attributed to low scores in reproductive, maternal, newborn and child health (69%); infectious diseases (53%); and NCDs (52%). As Mauritius endeavours to progress towards UHC and attain SDG 3, sustainable increase of investments in the national health system as well as addressing the social determinants of health is essential.36
A significant proportion of OOP spending is linked to the purchase of pharmaceuticals from the private sector as there is a general wrong perception that generic drugs in the public sector are substandard.18 Generic medicines in the private sector are generally sold at 4.87 times their international reference price. Furthermore, innovator brand medicines are generally sold at 10.25 times their international reference price.37 This poses a challenge to progress towards UHC by 2030.
Evidence shows that UHC service coverage index has improved considerably during the past decades to reach to a global average of 66, which is slightly above that of Mauritius (63). On the other hand, notwithstanding economic growth and rising health expenditure, service coverage in Mauritius has been declining since 2016.38 In a post-COVID-19 environment marked with bleak economic growth prospects, rising healthcare costs and health budgets are increasingly stretched to its limits to reconcile competing needs, thus the key objectives to promote equitable and sustainable financing for health, as well as improve efficiency in the allocation and utilisation of resources.39 At the core of the pursuit of efficiency in health spending is ensuring value for money through priority setting processes. However, according to WHO, value for money is not the sole panacea as what is equally fundamental is understanding and addressing what patients and the population at large consider most important in relation to healthcare. Adopting a shift from value for money to that of a value-based health services approach will imply health improvement at the patient level, responsiveness of the health system to patient needs, financial protection, efficiency and equity and, ultimately, UHC objectives of equitable access to quality healthcare and financial protection.40 41
Evidence gleaned in sub-Saharan Africa of limited pro-poor distribution at the PHC level prompted to conclude that health reform undertaken to bolster PHC has not influenced service utilisation by the poor. As PHC system of delivery may not respond to the real needs of the poor, the poor resort either to hospital services, turn to private providers or, worse, refrain to request for healthcare. Investment in PHC in many sub-Saharan Africa countries falls well behind that of hospital services.42 Mauritius is no exception. Government hospital services expenditure, including investment, represented almost 70% of general government health expenditure in 2016.43 To promote greater value for money, from an equity and efficiency perspective, a fundamental shift in the allocation of government resources in favour of PHC is critical. PHC needs to be better designed to meet the needs of the poor.18 An assessment of health systems performance in Mauritius revealed that inefficiency inherent to the PHC in Mauritius hampers provision of preventive services, early diagnosis and treatment for those living with NCDs.44 Several dysfunctions with the referral system were also flagged. These include patients with non-complicated NCD ailments circumventing the PHC providers to head straight to secondary or tertiary health facilities for care, inadequate consultation time in PHC centres and paucity of preventive services for a significant segment of the population in pre-diabetes and hypertensive stage.30 Ensuring availability of health services is not a panacea on its own. The solution lies in tackling the factors that impede the quality of healthcare with people-centred health services as this will ensure that sufficient benefits are delivered to the poor.
A World Bank study in 2017 revealed that the Gini index of prefiscal income (per AE), which is estimated at 0.40, declined substantially to 0.344 after direct taxes and cash transfers, 0.342 after indirect taxes and subsidies, and 0.306 after in-kind education and health transfers are accounted for.24 The findings of the latter study where direct taxes (personal income tax) are progressive and reduce inequality align with this one. It can be inferred that personal income taxation, as one of the public financing arrangements, constitutes a feasible option to leverage actions contributing for reductions in income inequality. It is reasonable to posit that progressivity of direct taxes has increased since 2017 especially with the introduction of new income tax regimes in 2020. More precisely, the standard rate of 15% has been reduced to 10% for individuals whose annual net income does not exceed MUR650 000. A solidarity levy of 25% is applicable on annual leviable income exceeding MUR3 million. The significant contribution of direct taxes towards income equality offers evidence-based argumentation to finance health services using progressive income taxes as this ensures redistribution of income favouring the poor. Furthermore, the potential reduction in income inequality associated with direct taxes contributing significantly to total health financing in Mauritius is comparable to that reported in studies undertaken in Organisation for Economic Co-operation and Development and sub-Saharan countries.45–47
Limitations
Most of the BIAs carried out analyse distribution of benefits across socioeconomic groups. However, a comparison of benefits distribution with respect to the need for healthcare is equally informative, mindful that equity includes utilisation of services, as well as the inputs required to deliver the services, in line with the actual need. The latter is a limitation of the current analysis as the Household OOP Survey did not enquire of the health status of the respondents, and thus no data to state the health needs are available. To mitigate for this shortfall, the health needs identified for each socioeconomic group in an earlier situation analysis of health equity and social and economic determinants of health focusing on NCDs were used as a proxy.48 Another caveat when interpreting the results in terms of benefits enjoyed within a typical household is that of recall bias which usually results in underestimation.
Conclusion
The study found that the poorest strata of the population enjoyed more benefits from public healthcare services, and the benefits trend is inversely proportional to the socioeconomic status quintile. While public health sector ensures pro-poor distribution of health services the private sector has an equally pro-rich distribution of benefits. In the same vein, analysis of health benefits received with respect to the level of health needs in each socioeconomic group revealed a pro-poor distribution in the public sector. The poorest 40% of the population received an excess of total benefits from expenditure on health than actually needed. On the other hand, the private sector is pro-rich notwithstanding that the number of attendances in that sector is threefold less than the public sector. However, combining both public and private benefits, a pro-rich distribution trend emerges. The regressivity of the health financing system driven by OOP payments and indirect taxation (VAT), which contributes to excluding the poorest from accessing needed care, are areas of concern.
However, it will be remiss to ignore the impact of COVID-19 pandemic on economic growth which will in turn, at least for a few years and until the economy picks up, reduce government tax revenues and funding towards public health services. Furthermore, the COVID-19 pandemic has brought to the surface gaps in implementation of UHC-related activities, which is meant to embrace access to the full gamut of health services, including health promotion, prevention and treatment. The focus of investment in health has been skewed towards curative care vis-à-vis the more cost-effective health promotion and disease prevention. It is critically important to strike a balance between promotion, prevention and treatment in the pursuit of equitable distribution of health services to achieve UHC.
Institutionalisation of BIA and FIA is a key step for sound health policy making and health planning that needs to be prioritised. A framework based on BIA and FIA is useful to inform decisions regarding where to prioritise budget allocation and spending on priority public health services.
Data availability statement
Data are available upon reasonable request.
Ethics statements
Patient consent for publication
Acknowledgments
The author acknowledges the Ministry of Health and Wellness and the Health Economics Unit for availing the Household Out-of-Pocket Survey data for 2017. The guidance of Dr L Musango, WHO representative in Mauritius, and the support to enable the preparation of this paper are much appreciated and acknowledged.
References
Footnotes
Handling editor Lei Si
Collaborators Ajoy Nundoochan.
Contributors AN collected, cleaned and prepared the data. AN analysed and interpreted the data. AN drafted the manuscript. AN approved the final version of the manuscript.
Funding The authors have not declared a specific grant for this research from any funding agency in the public, commercial or not-for-profit sectors.
Disclaimer The work was carried out by the author as part of his normal duties at his institution. The views expressed in this paper are solely those of the author and do not in any way represent the views of the institution he is employed with.
Competing interests None declared.
Patient and public involvement Patients and/or the public were not involved in the design, or conduct, or reporting, or dissemination plans of this research.
Provenance and peer review Not commissioned; externally peer reviewed.