Article Text

Abstract
Background Estimates of excess mortality are required to assess and compare the impact of the COVID-19 pandemic across populations. For India, reliable baseline prepandemic mortality patterns at national and subnational level are necessary for such assessments. However, available data from the Civil Registration System (CRS) is affected by incompleteness of death recording that varies by sex, age and location.
Methods Under-reporting of CRS 2019 deaths was assessed for three age groups (< 5 years, 15–59 years and ≥60 years) at subnational level, through comparison with age-specific death rates from alternate sources. Age-specific corrections for under-reporting were applied to derive adjusted death counts by sex for each location. These were used to compute life expectancy (LE) at birth by sex in 2019, which were compared with subnational LEs from the Global Burden of Disease (GBD) 2019 Study.
Results A total of 9.92 million deaths (95% UI 9.70 to 10.02) were estimated across India in 2019, about 2.28 million more than CRS reports. Adjustments to under-five and elderly mortality accounted for 30% and 56% of additional deaths, respectively. Adjustments in Bihar, Jharkhand, Madhya Pradesh, Maharashtra, Rajasthan and Uttar Pradesh accounted for 75% of all additional deaths. Adjusted LEs were below corresponding GBD estimates by ≥2 years for males at national level and in 20 states, and by ≥1 year for females in 12 states.
Conclusions These results represent the first-ever subnational mortality estimates for India derived from CRS reported deaths, and serve as a baseline for assessing excess mortality from the COVID-19 pandemic. Adjusted life expectancies indicate higher mortality patterns in India than previously perceived. Under-reporting of infant deaths and those among women and the elderly is evident in many locations. Further CRS strengthening is required to improve the empirical basis for local mortality measurement across the country.
- public health
- epidemiology
- health policy
Data availability statement
All data relevant to the study are available from the various references provided in the bibliography or uploaded as supplementary information.
This is an open access article distributed in accordance with the Creative Commons Attribution Non Commercial (CC BY-NC 4.0) license, which permits others to distribute, remix, adapt, build upon this work non-commercially, and license their derivative works on different terms, provided the original work is properly cited, appropriate credit is given, any changes made indicated, and the use is non-commercial. See: http://creativecommons.org/licenses/by-nc/4.0/.
Statistics from Altmetric.com
Key messages
What is already known?
The mortality impact from COVID-19 in a population is best understood from an estimation of the excess mortality observed during the pandemic period.
A reliable baseline measure of prepandemic mortality is essential to estimate excess mortality for India, but data from the Civil Registration System (CRS) for 2019 are biased on account of under-reporting of deaths.
What are the new findings?
Detailed assessments of completeness of CRS death reports identified variations by sex, age and location, which were used to derive adjustment factors to correct for under-reporting.
A total of 2.28 million additional deaths were estimated from this analysis, and the adjusted mortality rates showed higher mortality patterns than previously known from reported CRS data, or from modelled estimates for India at the national and subnational levels.
What do the new findings imply?
These mortality estimates for 2019 provide a baseline for understanding excess mortality patterns due to COVID-19 across different states and Union Territories of India.
The findings on CRS completeness indicate substantial improvements over the past decade, but the observed variations prompt focused activities that address remaining data gaps, strengthen assignment of causes of death at registration and increase utilisation of CRS data for mortality measurement.
Introduction
The COVID-19 pandemic has caused significant human disease burden around the world. Official national data report a total of 32.9 million cases in India since the onset, which have resulted in 439 350 reported COVID-19 deaths as of 31 August 2021.1 The two waves of the pandemic in India during August–October 2020 and April–June 2021 resulted in substantial increases in mortality at different locations across the country, as reported in the media.2 Accurate assessment of COVID-19 mortality according to time, place and person is essential for evaluating the epidemiological profile of COVID-19 disease in the population, and to understand the nature of health services that would be required to mitigate the effects of future waves of the pandemic.3 While the ideal data source for mortality assessment is complete and timely death registration with accurate medical certification of causes of death, the Civil Registration System (CRS) for the recording of deaths and causes of death in India has not yet achieved adequate functional status to serve as a reliable source of mortality data.4 5
The national COVID-19 Surveillance Program has established a web portal for monitoring the impact of the pandemic, which includes a provision for reporting COVID-19 deaths from all public and private health institutions.6 However, there are gaps in the availability of testing in some locations, and the occurrence of deaths at home without timely access to diagnostic services could lead to under-reporting of potential COVID-19 deaths. Therefore, there is a general perception that data compiled by the surveillance programme underestimates the mortality impact of the pandemic.2
Differences between the magnitude of reported COVID-19 deaths and the anticipated mortality from the disease have also been suspected in several other countries due to similar reasons, as well as variations in definitions applied to assign COVID-19 as the cause of death.7 Hence, the pandemic impact is now being assessed in terms of ‘excess mortality’, defined as the additional numbers of deaths observed during a given time frame (coinciding with the pandemic period), in comparison with those recorded during a similar time frame from previous calendar year(s).7 In principle, excess mortality observed during the pandemic would include deaths caused directly by COVID-19 infection, as well as those resulting from limitations in access to healthcare as a result of mobility restrictions, overwhelmed health facilities and/or reduced affordability due to income loss.8 However, there is also a likelihood of reduction in mortality as a result of government-enforced movement restrictions to minimise COVID-19 transmission. This includes a decrease in deaths from road traffic accidents and from exposure to environmental air pollution; however, these reductions are potentially counterbalanced by fatalities induced by self-harm or home accidents.9
For India, there is a need for a reliable estimate of background prepandemic mortality patterns at both national and state level in 2019, to accurately quantify the excess mortality from the first and second wave of COVID-19 infections in 2020 and 2021. However, establishing a baseline mortality level for 2019 for the comparison of future mortality rates is not a straightforward task. The Indian CRS serves as an important source of mortality data, but despite gradual improvements in system performance over the past decade, there are still some gaps in data quality even for 2019.10 Despite these shortcomings, there have been several ‘excess mortality’ assessments reported in the media, which directly compare monthly or annual CRS total death counts in 2020/2021 from municipalities, districts or states with corresponding CRS data for 2019.2 However, these comparisons do not take into consideration any potential for bias in the 2019 CRS data, nor do they account for any variations in excess mortality by age or sex.
This article presents mortality estimates disaggregated by sex and age at national and subnational levels in 2019. Our analysis includes methods to measure and correct for data biases on account of incomplete death registration by age and sex, using a combination of statistical models for estimating completeness and comparisons of CRS derived mortality rates with those from alternate sources. We propose that our findings would serve as a reliable and ready baseline for evaluating excess mortality patterns attributable to the COVID-19 pandemic, as will be possible when detailed CRS data for 2020 and 2021 become available.
Methods
Study setting and data sources
The aim of this analysis was to derive estimates of deaths by age and sex at the national level as well as for each of the 36 states and union territories (UTs) of India, based on the primary data on deaths from the annual CRS vital statistics report for 2019.10 For each state/UT, deaths are recorded into the CRS at the place of occurrence and aggregated by sex according to the following age groups: 0–1 years; 1–4 years; 5–14 years ; 15–24 years;…. 55–64 years; 65–69 years; and 70 years and above.11 These data were evaluated for completeness of death reporting and corrected for bias according to observed under-reporting patterns by sex and age for each state/UT. For 2019, the CRS report only provided the total numbers of reported deaths by sex for Bihar, Jharkhand, Manipur, Maharashtra, Haryana and Uttarakhand. Hence, their age-specific death distributions were interpolated using age distributions derived using data from the Sample Registration System (SRS) reports for these states in 2018.12 Age–sex population estimates that had been developed for each state/UT for 2019 by the National Commission on Population projections for 2011–2036 were used as denominators for calculating CRS age-specific death rates.13 Reported age-specific death rates from SRS 2018 for 22 larger states, and risks of under-five mortality from the Fifth National Family and Health Survey (NFHS-5) in 2019 for the smaller states/UTs without SRS data, were used to evaluate age-specific completeness of CRS data.12 14 Finally, for comparison with our study findings, life expectancies at birth by sex for all states (excluding UTs) were extracted from the subnational estimates for India reported by the Global Burden of Disease (GBD) Study for 2019.15 Relevant details of all data sources and study methods are summarised in the Guidelines for Accurate and Transparent Health Estimates Reporting (GATHER) Statement in online supplemental appendix table 1.
Supplemental material
Death registration completeness
The Adair Lopez (AL) empirical method was used to derive sex-specific estimates of CRS data completeness.16 For each sex, the AL model estimates death registration completeness as a function of its relationship with the registered crude death rate, an estimate of the true under-five mortality rate for the study population, and the proportion of individuals aged above 65 years in the study population. The second variant of the AL model was used for this analysis, which does not include the estimated value of completeness of under-five mortality in registration data in the model parameters. This second variant is recommended for use in situations where death registration completeness at all ages is not expected to be associated with child mortality registration completeness, as is the case with the CRS data.4 5 (State-specific input parameters used for the AL model are provided in online supplemental appendix table 2.) The reciprocal of the proportion of estimated completeness, termed the ‘AL adjustment’ factor, was used in combination with other modalities to guide adjustments for under-reporting of CRS deaths in specific instances, as described later.
The AL model estimate represents a constant level of completeness across all ages. However, there is a likelihood that the magnitude of under-reporting in CRS data for 2019 would vary by age, particularly at very early ages or among the elderly, as observed previously.4 5 Hence, rather than apply the AL completeness measures to uniformly correct for under-reporting at all ages, we adopted an approach to evaluate age-specific patterns of variation in completeness of CRS death reporting and adjust the CRS data accordingly. Age-specific completeness of CRS data was assessed by sex for three broad age groups (under 5 years, 15–59 years and 60 years and above) for each state/UT. The eventual adjustment was guided by identified gaps in completeness for each of these age groups, and in some instances, the estimated AL measure of completeness was used to adjust the CRS data, as explained further.
Under-five mortality adjustment
Previous analyses of CRS data have consistently demonstrated a considerable degree of under-reporting of deaths below age 5 years for all states/UTs. Hence, under-five mortality rates from the SRS in 2018 were considered to represent the true value of mortality at these ages for the larger states.17 For the remaining states/ UTs, under-five mortality rates from the NFHS-5 conducted during 2019–2020 were used as comparators to evaluate CRS data completeness.14 For Bihar and Jharkhand, the SRS 2018 measures were implausibly low when compared with other states with better indicators of socioeconomic development.5 18 Hence, for these two states, we considered the NFHS-5 measures of under-five mortality to be more representative than SRS measures. For Arunachal Pradesh, the under-five mortality measures for Assam from the SRS 2018 were used, in the absence of data from either SRS or NFHS-5. The CRS reported under-five deaths were adjusted to match the mortality levels represented by the SRS and NFHS-5 by sex for each respective location.
Adult mortality adjustment
To evaluate adult age variations in CRS data completeness, the risk of death between ages 15 and 59 years by sex from the CRS were compared for each state with similar measures from alternate sources. For this purpose, period life tables were first constructed for each state from CRS 2019 data for all states. Period life tables are standard demographic tools to evaluate and summarise age patterns of mortality in populations, and they enable mortality comparisons across space and time. Distributions of CRS 2019 deaths according to our preferred format of detailed age groups for life table analysis (0–1 year; 1–4 years; 5–9 years; 10–14 years; … 80–84 years; 85 years and above) for each state/UT were derived according to a methodology described for a previous analysis.5 CRS life tables were constructed using a standard programmed spreadsheet.19 For the 22 larger states, comparator life tables were derived from SRS 2018 data. For 10 other states/UTs without SRS data, comparator life tables were estimated using the WHO two-parameter Modified Logit Life Table System, implemented through its customised software tool named ‘MODMATCH’20 21 (see online supplemental appendix table 3 for details of MODMATCH methods and data inputs for each state). For Chandigarh, the comparator life table was developed using SRS 2018 age-specific death rates for Delhi. Comparator life tables for evaluating CRS data completeness were not required for Goa, Lakshadweep and Puducherry. The risk of dying between 15 and 59 years was extracted from sex-specific life table for every state/UT from each source, and CRS values were compared with similar values from comparator sources.
A general observation from the comparisons was that CRS mortality risks at 15–59 years either approximated or were higher than the SRS 2018 mortality risk in three-fourths of all states/UTs for males but were equal or higher in only about half of all states for females. The following adjustments were made to the CRS death rates at these ages, as required:
For states where CRS mortality risks were similar to or higher than the SRS, the CRS death rates were left as such.
For Chhattisgarh, Jammu & Kashmir, Jharkhand and Uttar Pradesh, the CRS death rates were lower than the SRS 2018 rates for both males and females; hence, the ratio of adult mortality risks was used to inflate the CRS death rates at these ages. Similar SRS 2018 adjustments were also applied to the CRS death rates for females at these ages in Assam, Himachal Pradesh, Maharashtra and Uttarakhand.
For Bihar, both CRS and SRS 2018 adult mortality risks seemed relatively low for both males and females. Hence, the ‘AL adjustment’ factor was applied to correct the CRS death rates.
For several smaller states/UTs without SRS data (Arunachal Pradesh, Manipur, Nagaland and Daman & Diu), the CRS death rates for both males and females were adjusted to match the MODMATCH estimated death rates.
Mortality adjustment at older ages
Evaluation of CRS data quality at ages 60 years and above poses two constraints. First, the CRS annual reports only provide data for the age groups 60–69 years and 70 years and above, which precludes the direct assessment of mortality data quality for older age groups. Second, for 11 of the larger states/UTs, the CRS mortality rates for ages above 60 years do not comply with the expectation of an exponential increase in mortality rates with age, which is suggestive of incomplete elderly death reporting.22 23 This includes several states with relatively high levels of overall completeness as estimated from the AL method such as Haryana, Odisha, Punjab, Karnataka and Telangana for both males and females (see online supplemental appendix figure 1). To address these constraints, the mortality adjustment at ages above 60 years was implemented by adjusting the interpolated CRS death rates at these ages for each state, according to the following broad principles:
As an initial step, the AL adjustment factor for each state/UT was uniformly applied to adjust the age-specific death rates above 60 years for both males and females in all states. For states with high AL completeness levels, this resulted in marginal increases to the overall numbers of estimated deaths.
Subsequently, these revised CRS death rates for all states were compared with the SRS death rates at these ages for the larger states with SRS data, and with the MODMATCH model life table estimated death rates for locations without SRS data, leading to the following adjustments:
In several larger states, the revised CRS age-specific death rates (after the AL adjustment) remained below the SRS death rates at these ages. In such instances, the CRS death rates were further adjusted to approximate the SRS death rates at these ages, termed the ‘SRS 2018’ adjustment.
Similarly, for smaller states/UTs for which the revised CRS rates (after including the AL adjustment) were lower than the model life table estimated death rates, the death rates at these ages further inflated as required, termed the MODMATCH adjustment.
Details of the adjustment factors that were applied in each state/UT for each age–sex group as well as their sources are available from online supplemental appendix table 5.
Special cases
For Delhi and Chandigarh, the CRS reported deaths include those of patients from neighbouring states who had sought treatment in the specialist tertiary care hospitals in these cities, which resulted in implausibly high mortality rates for all ages. Hence, the final estimate of deaths in Delhi was solely based on SRS 2018 death rates, and the same rates were also applied to estimate mortality in Chandigarh, since they share similar urban population characteristics. Very high mortality patterns from CRS data were also observed for Goa and Puducherry, but the CRS data were retained as such for these locations, without any adjustments. Since Lakshadweep has a relatively small population, CRS data were aggregated over 2017–2019 to derive a period life table for males and females, and the average annual numbers of deaths by age were retained as such, without any adjustments.
Outcome measures
The adjusted death rates by sex and age for each state/UT were applied to respective populations to derive the estimated numbers of deaths by sex and age that had occurred at national and subnational levels in 2019. These estimated deaths by age were used as inputs for the final estimated life tables by sex to derive the corrected life expectancies at birth for each location. Uncertainty intervals (UI) of the estimates of deaths and life expectancies at birth were calculated by applying bootstrap methods, using a publicly available spreadsheet programme specifically designed for such analysis.24 Results of the uncertainty analysis are available from online supplemental appendix table 4.
Results
CRS reported mortality in 2019
Table 1 shows the characteristics of input data used in the analysis, in terms of estimated total populations, reported CRS deaths, estimated completeness of death reporting and life expectancy at birth from reported data for 2019, for males and females in each state. As can be observed, there are marked variations in the estimated completeness of deaths, which is not directly correlated with the population size of different locations. Among the larger states, completeness varies from 55% to 60% in Bihar and Uttar Pradesh to 85%–90% in Maharashtra and West Bengal. Among the relatively smaller North-Eastern states, completeness is very low in Arunachal Pradesh, Manipur and Nagaland, but much higher in Meghalaya, Mizoram and Tripura. Completeness was estimated to be higher for males as compared with females in all states/UTs except for Jammu and Kashmir. All these differentials indicate the need for a case-by-case assessment and adjustment strategy for each state to account for these data gaps during mortality estimation.
CRS deaths, estimated population, death registration completeness, and life expectancy at birth by sex, 2019
Even though several states have very high completeness, the estimated life expectancies at birth from CRS reported deaths must be interpreted with caution, since they could be influenced by age differentials in completeness. The life expectancies reported in table 1 are computed using the reported CRS data without any adjustments, and hence could at best be considered to be the likely maximum possible estimates. However, despite the potential for bias, the reported CRS life expectancies at birth for females are generally higher than those for males in all states. This is particularly so for those states with very high levels of completeness for both sexes, such as Andhra Pradesh, Gujarat, Karnataka, Kerala, Odisha, Punjab, Tamil Nadu and West Bengal. Overall, table 1 shows that approximately 7.64 million deaths were recorded across India during 2019, and the relatively high summary estimates of completeness for most states/UTs indicates the potential for the direct use of the CRS data for mortality estimation, with appropriate adjustments to fill the gaps in reporting for different age groups and by sex in each state.
Under-five mortality adjustment
Analysis of age-specific mortality patterns from the CRS indicated substantial under-reporting of deaths below the age of 5 years in almost all states/UTs, in 2019, when compared with data from the SRS 2018 and NFHS-5 (see figure 1). The SRS is a national programme specifically designed and statistically powered to be adequately representative for direct measurement of infant mortality rates at the substate level in India. In 2018, the SRS was implemented in 8847 sample units covering a total population of 8.08 million, which is approximately 0.6% of the national population.25 Each SRS sample unit includes approximately 100–150 households. The SRS is implemented through a dual record system with matching, verification of non-matched events and data reconciliation on a semiannual basis. Based on these operational characteristics, the SRS is considered to be the most robust source for routine child mortality measurement for the larger states of India.26 For the smaller states and UTs, we used rates from the NFHS-5, which is a sample survey conducted during 2019–2020 to measure under-five mortality from complete birth histories taken from women of reproductive age in the survey population. The NFHS-5 sample was designed for reliable measurement of under-five mortality at the district level and hence serves as the main data source for smaller states and UTs, which are not adequately represented in the SRS. However, the NFHS-5 mortality rates represent a 3-year period from 2017 to 2019, and this may have some implications on their use to evaluate and adjust similar CRS measures for 2019 alone.
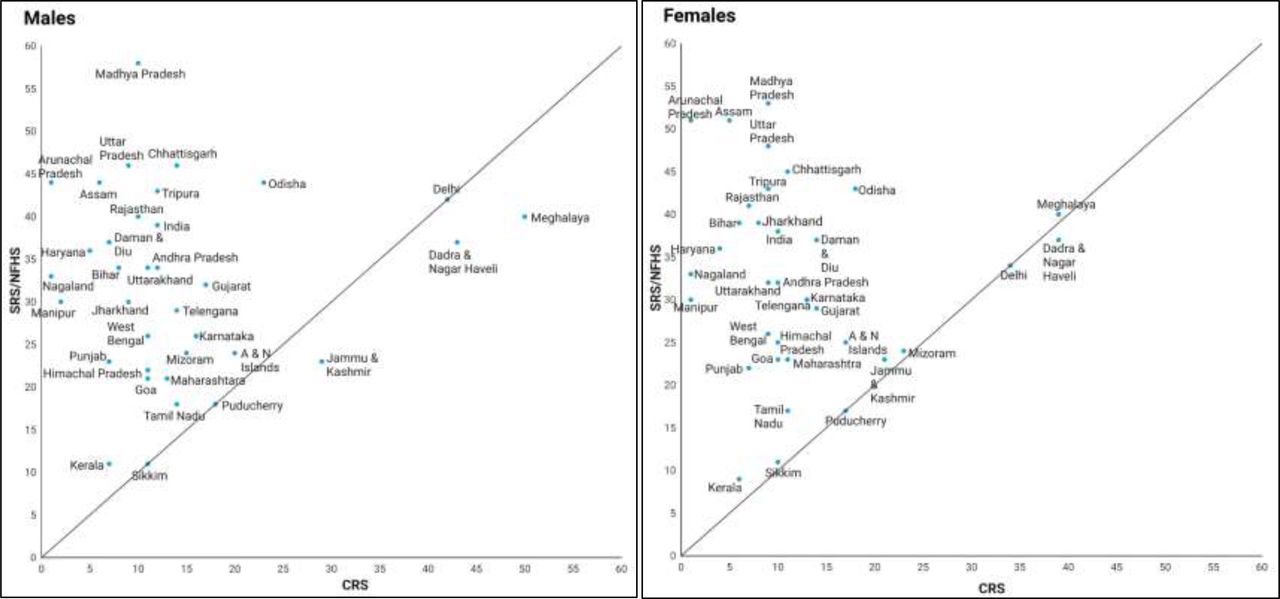
Scatter plots of male and female under-five mortality rates from CRS 2019 and SRS 2018/NFHS for India and states/union territories. CRS, Civil Registration System; NFHS, National Family and Health Survey; SRS, Sample Registration System.
As can be seen from figure 1, most of the data points are concentrated in the left upper quadrant, which demonstrates the magnitude of under-reporting of under-five mortality in the CRS. Therefore, the CRS reported under-five mortality rates were adjusted by sex in each state to match the corresponding SRS/NFHS-5 values. These adjusted rates were then used in the sex-specific life tables for each state/UT to estimate the potentially true numbers of under-five deaths in 2019.
Adult/older age mortality adjustment
Figure 2A,B depict the comparisons of age-specific mortality rates by sex on the logarithmic scale from different sources for four states. These graphs demonstrate the four broad patterns of age-specific under-reporting of male and female deaths in the CRS and provide a graphic explanation of the rationale that was applied to adjust for such under-reporting of CRS deaths in each state/UT. The first panel demonstrates the pattern of CRS reported death rates being higher than the SRS death rates for males and mostly similar for females in Karnataka, at all ages. In such instances, the CRS death rates were retained as such for ages 15–59 years and marginally adjusted at ages above 60 years using the AL completeness estimates reported in table 1. The second panel demonstrates the pattern of CRS death rates in Odisha, which are similar to those for Karnataka up to age 60 years, but CRS rates were below the SRS rates for the elderly age groups in both males and females. Hence, the CRS deaths rates were only corrected for under-reporting at ages beyond 60 years, through inflating the CRS rates to approximate the SRS rates for these older age groups.

(A) Age-specific death rates from various data sources and final estimates for males and females in Karnataka and Odisha, 2019. (B) Age-specific death rates from various data sources and final estimates for males and females in Uttar Pradesh and Mizoram, 2019.
The top panel in figure 2B demonstrates the pattern of CRS death rates in Uttar Pradesh, which are considerably lower than the SRS death rates. For this case, the CRS death rates were adjusted to approximate the SRS death rates for ages 15 years and beyond. The bottom panel in figure 2B shows the comparison of CRS death rates in Mizoram with those derived from the MODMATCH life table models. As can be seen, the CRS death rates are relatively lower than the modelled death rates at ages 60 years and above and were therefore corrected for under-reporting accordingly.
As described in the Methods section, similar criteria were applied to adjust the CRS death rates for under-reporting by sex and age in each of the other states/UTs, according to one of the four adjustment patterns described in figure 2, as applicable. (See online supplemental appendix table 5 for details of adjustment methods applied for each state/UT.) For Goa, Lakshadweep and Puducherry, the AL completeness estimates were very high, and the CRS under-five mortality measures were similar to the NFHS-5 values for these locations; hence, no adjustments were applied, and the CRS reported deaths were taken to represent the actual mortality levels for these states. As mentioned earlier, the SRS death rates for Delhi were used instead of the CRS death rates, since deaths among non-residents had been included in the CRS data. In the absence of SRS data for Chandigarh, the SRS death rates from Delhi were used to estimate the deaths in Chandigarh by sex and age for 2019.
Net adjustment factors
The adjusted male and female death rates were applied to the respective age-specific populations for each state to derive the final adjusted estimates of deaths by age for each location. The net effect of these adjustments was evaluated by sex for each state, as the ratio of final estimated to reported deaths for each of the three broad age groups used for evaluation of under-reporting (see table 2). It can immediately be observed that there are variations in the magnitude of adjustments across the three age groups for both sexes in almost all states, justifying the approach to conduct age-specific corrections for under-reporting, rather than apply a uniform adjustment factor for all ages. As demonstrated from figure 1, a high degree of adjustment was required to correct for under-reporting of child deaths in CRS data in almost all states. The adjustments were of negligible or minor nature for a majority of the states at ages 15–59 years for both males and females. However, moderate to high degree of adjustments were required in the older age group for most states, more so for females. At the national level, the adjustment required was high for under-five deaths, negligible or minor at ages 15–59 years, and moderate for the elderly age groups. Among larger states, a moderate to high degree of adjustment was required for both male and female deaths in Bihar, Jammu & Kashmir, Jharkhand and Uttar Pradesh, and for female deaths in Assam. A high degree of adjustment was also required for all age groups in both sexes for Arunachal Pradesh, Manipur, Nagaland and Daman & Diu.
Adjustment factors for correction of under-reporting of deaths in CRS data by sex and age for states/UTs, 2019
At the national level, there were a total of 2.28 additional deaths estimated from this analysis, with a slightly higher proportion of additional deaths in females (54%). The age-specific adjustments identified that correction of under-reporting of deaths below 5 years accounted for 33% of the overall additional deaths at the national level in males and 28% of additional deaths in females (see online supplemental appendix table 6). However, additional deaths at ages 15–59 years were relatively lower for males (11%) as compared with females (16%), while at elderly ages such adjustments accounted for 56% of the additional deaths for both males and females. On assessing the net adjustments for under-reporting of deaths for all ages and both sexes together at state level, the results showed that Bihar, Jharkhand Madhya Pradesh, Maharashtra, Rajasthan and Uttar Pradesh accounted for 75% of all additional deaths.
Based on these adjustments, we calculated the final completeness of the CRS by sex for each state/UT as the proportion of the CRS reported deaths to the total estimated deaths across all ages, as shown in table 2. In comparison with the original AL completeness estimates (table 1), changes in levels of completeness were marginal (<5%) for most of the larger states, and the final completeness levels were within the 95% uncertainty intervals for the AL completeness estimates (see online supplemental appendix table 1). The reductions in levels of completeness driven by the age-specific adjustments were approximately 10% for Bihar, Chhattisgarh, Jammu & Kashmir and Jharkhand, and for all these states (except Chhattisgarh males), the AL completeness estimates were ≤80%, with relatively wider 95% UI. Among the smaller states, the changes were of greater magnitude for Manipur, Nagaland and Daman & Diu, all of which had relatively lower estimated AL levels of completeness. At the national level, the final completeness was only 2% lower than the original AL estimated completeness, for both males and females. Overall, after adjustment, the completeness levels were estimated to be over 85% in 22 and 14 states/UTs (including Chandigarh and Delhi) for males and females, respectively. These high levels of completeness in many states justify the direct use of CRS data for mortality estimation, with suitable age-sex specific corrections for under-reporting of deaths.
Adjusted mortality estimates
Table 3 displays the final estimated numbers of deaths by sex for four broad age groups for each state/UT in 2019. At ages below 5 years, 0.93 million deaths (95% UI 0.91 to 0.94) were estimated to have occurred at the national level, which accounted for 9%–10% of total deaths at all ages, ranging from 2% of all deaths in Kerala, Tamil Nadu and Goa, to 18%–19% of all deaths in Bihar. Under-five deaths in Bihar, Chhattisgarh, Jharkhand, Madhya Pradesh, Rajasthan and Uttar Pradesh account for nearly two-thirds of all under-five deaths that occurred in India during 2019. For these states, there is an urgent need for an in-depth district-level analysis to identify and target populations with high under-five mortality with the necessary interventions for mortality reduction.
Of equal concern are the relatively high numbers of premature adult deaths (between ages 30 and 70 years), with a total of 4.73 million deaths (95% UI 4.70 to 4.76) estimated to have occurred at national level, which account for 51% of all deaths in males and 43% of deaths in females. At these ages, the numbers of deaths in Maharashtra, West Bengal, Tamil Nadu, Bihar, Madhya Pradesh and Uttar Pradesh accounted for over half of all deaths in the country, in both males and females.
Estimated deaths by sex and broad age groups for India and states, 2019
The correction of CRS death rates at older ages has revealed the previously unrecognised magnitude of elderly mortality in each state. At the national level, a total of 3.68 million deaths (95% UI 3.52 to 3.74) were estimated to have occurred in this age group. Among the larger states, deaths at these ages account for about half or more of the total female mortality in Gujarat, Himachal Pradesh, Karnataka, Kerala, Tamil Nadu and Uttarakhand, which now highlights the need to strengthen geriatric care and rehabilitation services to alleviate disease burden in the elderly. Beyond these basic descriptive purposes, the age-sex specific mortality estimates, particularly at adult and elderly ages, serve as baseline measures to evaluate excess mortality that has resulted from the COVID-19 pandemic during 2020 and 2021.
The impact of correction of the CRS death rates for under-reporting can also be interpreted from their effect on the life expectancies at birth in each state, as reported in table 4. At one level, these study estimates clearly show that the adjusted life expectancy estimates are substantially lower than the corresponding estimates from reported CRS data as shown in table 1 in most states. These differences arise from the increased mortality rates resulting from the adjustments for under-reporting. The magnitude of these differences varies across the states and by sex but appear to be largely driven by adjustment for under-reporting at adult and older ages. A consistent gender differential can also be observed from the study estimates of life expectancy at birth, with higher values for women in all states (except Assam), by 1–6 years. Across the states, there are wide variations (up to about 10 years) in life expectancies, ranging from 63.1 years in Chhattisgarh to 72.2 years in Kerala for males, and from 67.4 years in Assam to 78.3 years in Kerala, for females.
Comparison of estimates of life expectancy at birth from this study with results from GBD 2019 for India and states
At another level, comparison with estimates derived from the GBD Study 2019 also shows considerable differences at both the national and state level. For males, the study estimates of life expectancy are lower than GBD estimates by two or more years at national level and in 20 states for which comparators are available from the GBD. For females, study life expectancies were lower than GBD estimates by 1 year or more in 12 states. For males, the differences exceed 3 years for several large states including Andhra Pradesh, Bihar, Haryana, Jharkhand and Punjab. Furthermore, the GBD life expectancy estimates for males are even higher than those derived from the CRS reported (unadjusted) deaths for 14 states (see table 1). The GBD study also reports considerable uncertainty around their point estimates for life expectancy for both males and females, with 95% intervals spanning 5 years or more for almost all states.
Discussion
This analysis has estimated a total of 9.925 million deaths to have occurred across the states and UTs of India in 2019, of which more than half were among males (56.5%), and nearly a tenth are estimated to have occurred before the age of 5 years. Our corrections for under-reporting added a total of approximately 2.29 million deaths to the reported CRS data, with adjustments in Bihar, Jharkhand, Madhya Pradesh, Maharashtra, Rajasthan and Uttar Pradesh accounting for 75% of all additional deaths. From another perspective, about 30% of the additional deaths were estimated to be at ages below 5 years, with 14% at adult ages and 56% from the older age group. Although there has been a gradual improvement in the completeness of death reporting under the CRS, there is still much variation in completeness by age, sex and location, which necessitated a detailed approach to adjust for such gaps. Taken together, the estimates from this analysis represent the first ever direct use of CRS data with corrections for under-reporting to estimate mortality patterns at the state and national level.
From an epidemiological perspective, these estimates serve an immediate need for a baseline to evaluate the impact of the COVID-19 pandemic at the national and subnational level in India, from the first and second waves during 2020 and 2021. Evaluation of the mortality impact from COVID-19 across space and time is essential to model the impact of infection transmission rates on the epidemiological profile of the disease. Such data are also required to guide critical policy decisions on resource deployment including hospital beds, emergency drugs and intensive care equipment, oxygen cylinders and trained human resources to combat potential future waves of this or other pandemics. However, estimating COVID-19 mortality directly from reported COVID-19 deaths has been demonstrated to be prone to error in many countries, prompting the use of excess mortality estimation as a more reliable basis to understand the impact of the pandemic.27
In addition to reliable estimates of baseline deaths, accurate measures of excess mortality would also be contingent on the availability of accurate death reports during pandemic years. Media reports of CRS deaths during the pandemic period clearly indicate marked increases in the numbers of reported deaths in all states, based on information directly sourced from state registration offices.2 These reports make mention of monthly or annual totals of all CRS deaths combined for all age groups and both sexes together, for specific districts, cities or states, for selected time periods during 2017–2021. However, these reported estimates of excess mortality have not accounted for sex and age variations in the completeness of prepandemic CRS data thereby limiting their analytical value, as compared with our findings. Moreover, there are variations in the age–sex patterns of COVID-19 mortality too, as well as varied time and space dispersion of pandemic intensity. Hence, accurate measures of excess mortality from COVID-19 would necessarily require a careful comparison of prepandemic and pandemic period mortality data that is disaggregated by sex, age, date/month of death and preferably by district/city of death occurrence as well as the place of usual residence of the deceased. Such disaggregated assessments would provide a more realistic understanding of excess mortality patterns that account for the different phases of the pandemic as well as the effects of migration and would be possible if detailed, granular data of this nature are made available by the CRS authorities for all years, in due course.
It is these very data attributes in terms of issues with time and space accuracy, as well as problems with completeness of CRS data that act as potential limitations of our corrected estimates for 2019. We applied detailed methods to evaluate and adjust for gaps in completeness, using information from the SRS and NFHS as alternate sources to evaluate CRS data and derive adjustment factors. In doing so, we assumed that the data from SRS and NFHS are unbiased, but they could also be prone to some reporting errors, though minor.28 In regard to time, CRS deaths are recorded according to the date of death but aggregated according to the calendar year of registration. Fortunately, the annual CRS reports includes information on the numbers of deaths within the data that had actually occurred during the reference year and the numbers of deaths that had occurred in previous calendar years, termed ‘delayed registration’. On examining CRS reports for 2016–2019, it was noticed that for a majority of the states, delayed registration accounted for <5% of all deaths, and these proportions were generally consistent year on year, which minimises the potential for bias from the perspective of time reference (see online supplemental appendix table 7). There was no data available on this aspect for Bihar, Jharkhand, Haryana, Maharashtra and Sikkim, so we assumed a similar annual pattern of delayed registration for these states. High levels of delayed registration for Arunachal Pradesh, Manipur and Nagaland did not influence our estimates for these states, which were essentially derived from modelled death rates. Finally, delayed registration was consistently observed to be 15%–18% for Rajasthan, Tripura and Uttarakhand, and similar to other states, it was assumed that the consistent year-on-year pattern would minimise the bias in regard to time reference of the data. Improvements in timely recording of deaths by the CRS and availability of such data for all locations is an important intervention to strengthen data quality from this aspect.
Regarding spatial reference of CRS data, the reported statistics for Chandigarh and Delhi are significantly biased due to the inclusion of deaths among patients from nearby states who sought healthcare in the specialist tertiary care institutions in these cities. This bias in CRS data on account of temporary internal migration was addressed by using the SRS death rates for Delhi for both these cities, assuming similar urban mortality patterns. The SRS death rates for Delhi only represent mortality among the usual residents of the sample sites located within Delhi. The relatively high mortality levels in Pondicherry and Goa are also suggestive of the likelihood of a similar phenomenon of temporary internal migration to access better healthcare. However, in the absence of any alternate data source, the CRS reported deaths for these locations were retained as such, without any adjustments. The CRS death report forms include the requirement to record both place of occurrence of the death as well as the usual residence of the deceased, if different.29 For evaluation of pandemic mortality, it is imperative to analyse data from both perspectives, since place of usual residence provides information on exposure to infection, while data on place of death occurrence informs better planning and provision of health services. Such analysis will be particularly relevant for district-level analysis of COVID-19 excess mortality in India, given the known variations in disease exposure as well as access to healthcare within and across the states.1 30 It is recommended that CRS data should be carefully compiled along both axes and made available for such detailed analyses.
Another key limitation in CRS data is the non-availability of age for deaths from several states. We assumed that age patterns of mortality derived from the SRS for these states were appropriate proxy distributions and that they were also applicable to neighbouring smaller states and UTs for which SRS patterns were not available.5 Furthermore, the SRS patterns for older age mortality were used to interpolate CRS deaths to finer categories for all locations. Our use of such standardisation was borne out of expediency, but we opted to use this approach to make best use of empirical CRS data. Despite its potential for sampling error, the SRS is characterised by external validity owing to its geographical representativeness, which facilitated our methodological need for such age distributions to evaluate completeness. On a lesser note, the NHFS under-five mortality rates that were used to correct under-reporting for some states were only available as combined for males and females, although there is a likelihood for marginal differences in gender risks for mortality at these ages. Finally, MODMATCH-derived death rates were used to evaluate and correct for biases in CRS death rates for several smaller states/UTs are derived from international historical mortality models, and these may not be directly epidemiologically coherent with mortality experiences in the Indian context.
The two key strengths of our approach are the use of empirical CRS data with reasonably high levels of completeness for many states/UTs as the essential substrate for this analysis, and our meticulous approach to localise age–sex corrections for under-reporting of deaths in deriving our final mortality estimates. In addition to enabling assessments of excess mortality from COVID-19, our estimates also serve as direct evidence to guide health policy at subnational level. The estimated numbers of deaths below the age of 5 years for each state/UT could help design strategies to meet the neonatal mortality reduction targets under the United Nations Sustainable Development Goals.31 The enormous annual mortality burden from premature adult deaths between ages 30 and 70 years in all states confirms findings from previous analyses and highlights the need for urgent attention to strengthen all levels of healthcare delivery, particularly health promotion as well as early diagnosis and treatment services.32 The analysis has also quantified the mortality burden among the elderly for each location, which accounts for 41% of all female deaths and 34% of all male deaths at national level, calling for greater attention to geriatric healthcare services in India.33
The gross differences observed between the life expectancy estimates from our analysis and those from the GBD analyses at the national and state level for 2019 shown in table 4 are a cause for concern. The GBD estimates are essentially derived through statistical modelling based on a trend analysis of data from the SRS and NFHS spanning three decades, along with various other covariates.15 In comparison, the mortality estimates from our analysis are largely based on empirical data from the CRS, with marginal adjustments for completeness in most states, as shown in table 2. In contrast to the population samples used for the NFHS and SRS, the CRS covers the entire population of the country and is therefore the natural and optimal data source for mortality measurement in India. It should also be noted that these GBD estimates serve as a starting point for a range of secondary epidemiological and socioeconomic analyses of population health and health system attributes in India at national and subnational level.34–36 The limited precision of the GBD mortality models as well as the substantial differences of the point estimates on comparison with our results from CRS data adjustments raises questions regarding the reliability of the GBD estimates and related secondary analyses. It is recommended that the GBD mortality estimates and all their subsequent derivations should be revised through the incorporation of the available evidence on mortality from the CRS.
Given the vast size of many states of India, and the challenges in optimising use of available health resources, our findings on state-level mortality variations also prompt the urgent need for more detailed quantification of age-specific and sex-specific mortality at the district level. The analytical approach and methods used for this study could be applied to analyse existing CRS data that is being meticulously compiled on a routine basis all over the country.4 5 In addition to the immense public health value of decentralised mortality estimates, local findings on data completeness by sex and age would further help identify systemic gaps in CRS performance. Our findings indicate the need to improve the recording of infant deaths in all states and the recording of deaths among women and the elderly in several states. Although not part of the analyses reported here, there is also a need to strengthen ascertainment of causes of death at registration, through expanding the use of medical certification of cause for physician attended deaths and the use of verbal autopsy methods for those that occur outside medical attention. Given the decentralised model of CRS operations and management across India, there is a need for a customised and localised approach that addresses the specific gaps and needs for each state to improve data completeness and quality of recorded causes of death.37 An incremental sampling approach would be necessary to strengthen cause of death ascertainment in most states, in combination with a comprehensive capacity building strategy for field personnel, data managers and data analysts.38 39 Evidence from such efforts would further improve the empirical basis for future population health assessments at national and subnational level in India, and reduce dependence on the current modelled estimates from the GBD analyses.
Conclusions
Reliable subnational estimates of mortality by age and sex for India in 2019 are essential for understanding the magnitude of excess mortality caused by the COVID-19 pandemic. This analysis demonstrated an empirical basis for deriving such baseline estimates, through evaluating available CRS 2019 data for gaps in death reporting completeness and subsequently applying age-specific and sex-specific adjustments to correct for such gaps. The analysis estimated an additional 2.28 million deaths to those recorded by the CRS in 2019, mostly at childhood and elderly ages. Data adjustments for six states accounted for three-fourths of all additional deaths. Apart from COVID-19 mortality measurement, these findings are also useful for population health assessment and to guide health policy and research. Further efforts are required to improve the completeness of death recording, to strengthen ascertainment of causes of death and to increase the utilisation of CRS data for demographic and epidemiological analysis in India.
Data availability statement
All data relevant to the study are available from the various references provided in the bibliography or uploaded as supplementary information.
Ethics statements
Patient consent for publication
References
Supplementary materials
Supplementary Data
This web only file has been produced by the BMJ Publishing Group from an electronic file supplied by the author(s) and has not been edited for content.
Footnotes
Handling editor Seye Abimbola
Twitter @ChalapatiRao13, @AmritJJohn1
Contributors CR conceptualised and led this analysis and also drafted the initial version of the manuscript. AJJ, AKY and MS all participated in the analysis, contributed to developing the figures, tables and supplementary files and critically reviewed draft versions of the manuscript. All authors contributed to the development of the final version of the manuscript.
Funding The authors have not declared a specific grant for this research from any funding agency in the public, commercial or not-for-profit sectors.
Competing interests None declared.
Provenance and peer review Not commissioned; externally peer reviewed.
Supplemental material This content has been supplied by the author(s). It has not been vetted by BMJ Publishing Group Limited (BMJ) and may not have been peer-reviewed. Any opinions or recommendations discussed are solely those of the author(s) and are not endorsed by BMJ. BMJ disclaims all liability and responsibility arising from any reliance placed on the content. Where the content includes any translated material, BMJ does not warrant the accuracy and reliability of the translations (including but not limited to local regulations, clinical guidelines, terminology, drug names and drug dosages), and is not responsible for any error and/or omissions arising from translation and adaptation or otherwise.