Article Text

Abstract
Introduction Tracking progress towards Sustainable Development Goal (SDG) 3·6 of reducing traffic deaths and serious injuries poses a measurement challenge in most low-income and middle-income countries (LMICs) due to large discrepancies between reported official statistics and estimates from global health measurement studies. We assess the extent to which national population censuses and health surveys can fill the information gaps.
Methods We reviewed questionnaires for nationally representative surveys and censuses conducted since 2000 in LMICs. We identified sources that provide estimates of household ownership of vehicles, incidence of traffic deaths and non-fatal injuries, and prevalence of disability.
Results We identified 802 data sources from 132 LMICs. Sub-Saharan African countries accounted for 43% of all measurements. The number of measurements since 2000 was high, with 97% of the current global LMIC population having at least one measurement for vehicle ownership, 77% for deaths, 90% for non-fatal injuries and 50% for disability due to traffic injuries. Recent data (since 2010) on traffic injuries were available from far fewer countries (deaths: 21 countries; non-fatal injuries: 62 and disability: 12). However, there were many more countries with recent data on less-specific questions about unintentional or all injuries (deaths: 41 countries, non-fatal: 87, disability: 32).
Conclusion Traffic injuries are substantially underreported in official statistics of most LMICs. National surveys and censuses provide a viable alternative information source, but despite a large increase in their use to monitor SDGs, traffic injury measurements have not increased. We show that relatively small modifications and additions to questions in forthcoming surveys can provide countries with a way to benchmark their existing surveillance systems and result in a substantial increase in data for tracking road traffic injuries globally.
- injury
Data availability statement
Data are available on reasonable request.
This is an open access article distributed in accordance with the Creative Commons Attribution Non Commercial (CC BY-NC 4.0) license, which permits others to distribute, remix, adapt, build upon this work non-commercially, and license their derivative works on different terms, provided the original work is properly cited, appropriate credit is given, any changes made indicated, and the use is non-commercial. See: http://creativecommons.org/licenses/by-nc/4.0/.
Statistics from Altmetric.com
Key questions
What is already known?
Sustainable Development Goal 3.6 aims to ‘by 2030, halve the number of global deaths and injuries from road traffic accidents’.
However, there are large inconsistencies between modelled estimates of road traffic deaths and injuries produced by the Global Burden of Disease (GBD) study, WHO’s Global Health Estimates (GHE), and official statistics from most low-income and middle-income countries (LMICs).
GHE and GBD estimates rely primarily on vital registration data and verbal autopsies but these data sources are of poor quality or do not exist in many LMICs, especially those in sub-Saharan Africa, North Africa and Middle East, South Asia and South-East Asia.
What are the new findings?
National health surveys and censuses in LMICs often include questions that allow a direct estimation of the incidence of road traffic deaths and non-fatal injuries, the prevalence of permanent disabilities, and household ownership of bicycles and motor vehicles.
Such information sources exist commonly in sub-Saharan Africa, where traditional data sources severely under-report traffic injuries.
In many cases, the questions included in surveys and censuses are poorly framed, partly because they were not included for the purpose of estimating incidence and prevalence of traffic injuries.
Key questions
What do the new findings imply?
Household surveys and censuses can provide important information about the burden of road traffic injuries until countries have established surveillance infrastructure capable of fulfilling the information needs of road safety programmes.
In countries where such questions are already included in national surveys and censuses, relatively small modifications to existing questions can greatly enhance their utility for estimating the national burden of road traffic injuries.
Other countries should consider deploying a standardised set of questions on traffic injuries in forthcoming data collection activities.
Inclusion of data from surveys and household censuses in cross-national statistical models that estimate the burden of road traffic injuries can help reduce the large uncertainty that is common in estimates for many LMICs.
Introduction
In recent decades, road traffic injuries have emerged as a leading threat to population health in low-income and middle-income countries (LMICs), which suffer over 90% of the global road crash deaths.1 2 In 2019, traffic crashes killed an estimated 1·2 million people globally and were the seventh-leading cause of population health loss.2 The global traffic death toll has remained stable at a high level since the year 2000 and now exceeds deaths from HIV/AIDS, tuberculosis and malaria, all of which saw large declines (50%, 38% and 34%, respectively) during this period.1 Funding has been inadequate and progress in reducing traffic injuries has been slow despite substantial global advocacy. The World Report on Road Traffic Injury Prevention, jointly issued by the World Bank and the WHO,3 in 2004 was followed by a series of eight resolutions by the United Nations (UN) General Assembly and the World Health Assembly and three global ministerial conferences calling on LMICs (LMICs) to increase investments in safety interventions.4 The 2012 UN resolution proclaimed the period 2011–2020 to be the global Decade of Action for Road Safety. However, despite extensive global advocacy, progress towards making the investments and the regulatory changes necessary for running effective national road safety programmes has been slow. The third Global Ministerial Conference in February 2020 renewed these efforts by adopting the Stockholm Declaration5 and proposed updating the Sustainable Development Goal (SDG) 3.6 to reducing road traffic deaths and serious injuries by 50% by 2030. This was followed by a UN resolution that ratified the Stockholm Declaration, declared the period 2021–2030 to be the Second Decade of Action for Road Safety, and established a renewed target of a 50% reduction in road crash deaths and injuries by 2030.6
Road safety remains low on the policy agendas of many LMICs at least partly because countries may be underestimating the scale of the problem. Comparison of official statistics with estimates developed from health-related data sources suggest that official statistics from low-income countries miss 84%, and middle-income countries miss 51%, of road traffic deaths.7 8 In John Kingdon’s influential description of the policy process,9 problems often rise to policy attention because of a focusing event (such as a mass casualty crash) or because of change in a systematic indicator (such as the traffic death toll). Thus, evidence that the problem is bigger than acknowledged is a tool that can be used by civil society, interest groups and the media to push road safety onto the national policy action agenda.
There are two major global health measurement projects that generate estimates of national traffic injuries and provide evidence to challenge official statistics. These are (1) WHO’s Global Health Estimates (GHE), which are presented as WHO’s modelled estimates in the Global Status Reports on Road Safety (GSRRS)1 and (2) the Institute of Health Metrics and Evaluation’s (IHME) Global Burden of Disease (GBD)2 study. These projects construct estimates of road traffic deaths using statistical models that rely on a variety of cause-of-death data sources (especially vital registers and verbal autopsies) and covariates (eg, development indicators, vehicle fleet). GBD and GHE estimates of road traffic deaths are reasonably consistent with each other and official statistics in regions with high-quality vital registration data, which includes most countries in the Americas, Europe and Australasia (see online supplemental figure A1). However, in countries without high quality vital registers (which includes most countries in sub-Saharan Africa, North Africa and Middle East, South Asia and Southeast Asia), the differences in GBD and GHE methods lead to large discrepancies in estimates. Although GBD and GHE estimates are invariably higher than official statistics in these regions, they are often not consistent with each other. For instance, WHO’s estimates of road traffic deaths in the Western sub-Saharan African region, are more than twice GBD estimates. In these regions, a debate about the scale of the traffic injury problem can help spur policy action. However, when country actors are confronted with discrepancies between official statistics and GHE, they often brush aside the modelled estimates, pointing to the discrepancies between GBD and GHE and/or that the estimates are not based on epidemiological data sources from their country. Thus, increasing the use of local data sources on road traffic injuries in IHME and WHO’s statistical models will likely increase the perceived legitimacy of the estimates while also narrowing the discrepancies between GBD and GHE estimates.
Supplemental material
In other health domains, such as maternal health,10 and water, sanitation and hygiene,11 the measurement needs for the Millennium Development Goals (MDGs), and now the SDGs, were met by increased reliance on national population censuses and household surveys, including Demographic and Health Surveys (DHS), Multiple Indicator Cluster Surveys (MICS) and World Health Surveys (WHS), among others. This led to a large increase in the number of surveys conducted in LMICs, and especially in the regions like sub-Saharan Africa that have the weakest health data systems.12 13 Although these censuses and surveys occasionally include questions that can be used to estimate road traffic deaths and non-fatal injuries, they are not used as data sources in GBD and GSRRS estimates.
Our study sought to assess the availability of questions relevant to estimating road traffic deaths and injuries in nationally representative household surveys and population censuses in LMICs. In addition, we sought to identify opportunities to strengthen such measurements in future data collection.
Methods
We searched for nationally representative household surveys and population censuses in LMICs (as defined by the World Bank country-income classification) that included questions that allow estimation of the (1) incidence of road traffic deaths, (2) incidence of non-fatal road traffic injuries, (3) prevalence of permanent disability due to road traffic injuries and (4) household ownership of bicycles, motorcycles, cars, and other vehicles. We included the latter because they are important covariates of road traffic injuries and, hence, important for improving estimates in countries where epidemiological measurements on road traffic injuries are sparse or unavailable. For (1)–(3), we also identified sources for data on the unintentional injuries (typically identified as ‘accidents’) or all injuries without specification of cause. We included these because traffic injuries are the leading cause of unintentional injuries (70% of all unintentional injury deaths), and total injuries (28% of total injury deaths),1 suggesting that improving the accuracy of unintentional and total injury measurement can substantially reduce the uncertainty in traffic injury estimates. Furthermore, these surveys also represent a measurement opportunity. Relatively small changes to their questions in future rounds of these surveys could enable direct measurement of road traffic injuries.
Our main data source for survey instruments was the International Household Survey Network (IHSN) repository,14 which is the most comprehensive collection of metadata and documents (including questionnaires) on household surveys conducted in LMICs. IHSN includes information about most health surveys conducted by national governments and international development agencies, such as the DHS,15 MICS16 and the Living Standards Measurement Surveys.17 For questionnaires that were not in IHSN, we searched other major data repositories, such as the MEASURE Evaluation18 and the Global Health Data Exchange (GHDx) websites,19 and national statistical websites. Our main data source for national population and housing census instruments was the Integrated Public Use Microdata Series.20 For countries with no questionnaires in these collections, we searched in the UN Statistical Division’s Census data collection,21 GHDx19 and national statistical websites. We restricted attention to nationally representative surveys since the year 2000 and excluded surveys that were sub-national or household surveys with a sample size of less than 2000. We included surveys and censuses that were restricted to a particular age–sex group (eg, women 15–49 years), with the exception that we did not include surveys (such as some DHS) that focused only on mortality in the under-5 population (which accounts for only about 3% of road traffic deaths globally.2
For data sources with relevant information, we documented the country name, name of data source, year of data collection, sample size, the specific questions asked about mortality and morbidity, the recall period, type of care received, duration of impairment, and whether the question was restricted to any specific populations (eg, women 15–49 years). Online supplemental appendix oprovides these details for all data sources identified.
To illustrate the value that such data sources can bring to estimates of national road traffic deaths, we sought and analysed mortality data sources from one country, Tanzania. Our review identified three relevant mortality data sources in the country: (1) The 2012 Census, which included a question about the age, sex and cause (which included ‘Road Accident’ as an option) of household deaths during the last year; (2) a nationally representative verbal autopsy survey (Sample Vital Registration with Verbal Autopsy study; SAVVY) and (3) the National Panel Survey, which included questions on cause of death (including ‘Traffic Accident’ as an option). We were unable to acquire the SAVVY dataset but extracted estimates from a published study.22 We excluded the National Panel Survey from further analysis because of the small sample (3357 households; 5 traffic deaths). These data sources have not been used for GBD or GSRSS estimates of road traffic deaths in Tanzania.
We reviewed the data sources used by GBD and GHE for estimating road traffic injuries. Online supplemental appendix provides a full listing of the sources. Briefly, the modelling strategies used for GBD2 and GHE/GSRRS1 estimates vary substantially in their ability to include different types of data sources. For estimating mortality, good quality vital registration data at the national level is the only source of local data on road traffic injuries used by GHE. As a result, GHE estimates of road traffic deaths in 77 LMICs are derived from a regression model using transport sector covariates and no local injury data. In contrast, GBD’s models allow inclusion of vital registration data that is of lower quality than GHE (ie, lower completeness and coverage, and higher proportions of deaths coded to partially specified causes) and verbal autopsies. Notably, GBD’s models also allow inclusion of data sources that are representative at the subnational level. Consequently, GBD includes at least some vital registration or verbal autopsy data from all but 14 countries. For non-fatal injuries, GHE (and GSRRS) do not report estimates of the incidence of non-fatal injuries. While GBD includes data on non-fatal injuries from national and subnationally representative population surveys (106 surveys from 66 countries), only 3 were conducted in the last decade.
Patient and public involvement statement
Patients and/or the public were not involved in the design, or conduct, or reporting, or dissemination plans of this research.
Results
We identified 802 nationally representative surveys and population censuses conducted in 127 LMICs that met our inclusion criteria. Population coverage of data sources was highest for vehicle ownership (table 1). Of the current global LMIC population, 97% had at least one measurement since 2000 of household ownership of bicycles, motorcycles and cars. Population coverage of vehicle ownership was the highest (>99%) for sub-Saharan Africa, South Asia and East Asia and Pacific. Coverage was lowest for Europe and Central Asia, where data sources were available for only about half the LMIC population in the region.
Percentage of population in LMICs with at least one measurement since 2000 by World Bank region and country income group
Over three-quarters (77%) of the global LMIC population had at least one survey or census since 2000 that asked about causes of death with traffic crashes as an option, ranging from a low of 20% for Middle East and North Africa to a high of 100% for South Asia. Population coverage was slightly higher for information on deaths due to unintentional or all injuries (85% global LMIC population, range: 28% in Europe and Central Asia to 100% in South Asia).
Population coverage for non-fatal injuries was higher than for deaths. 90% of the global LMIC population had at least one survey or census since 2000 that asked about involvement of respondents or household members in a road traffic crash, ranging from a low of 48% in Europe and Central Asia to a high of 100% in South Asia. As with mortality, population coverage was slightly higher for information on unintentional or all injuries.
Finally, population coverage of sources since 2000 that measured permanent disability due to road traffic injuries was the lowest at 50% of global LMIC population (low: 0% of Latin America and Caribbean; high: 75% of South Asia). For unintentional or all injuries, population coverage was 58% of global LMIC population (low: 6% of Europe and Central Asia; high: 78% of South Asia).
While the number of data sources that include information on vehicle ownership has increased over time, sources for measuring the incidence and prevalence of injuries have remained relatively stable (figure 1). The 2003 WHS account for the bulk of the data sources in the 2000–2005 period for vehicles (61% of data sources), mortality (90%) and non-fatal injuries (90%). The relatively low value for number of sources in the most recent time period shown is likely because some recent surveys have not yet been archived yet in the online data repositories that were included in our review.
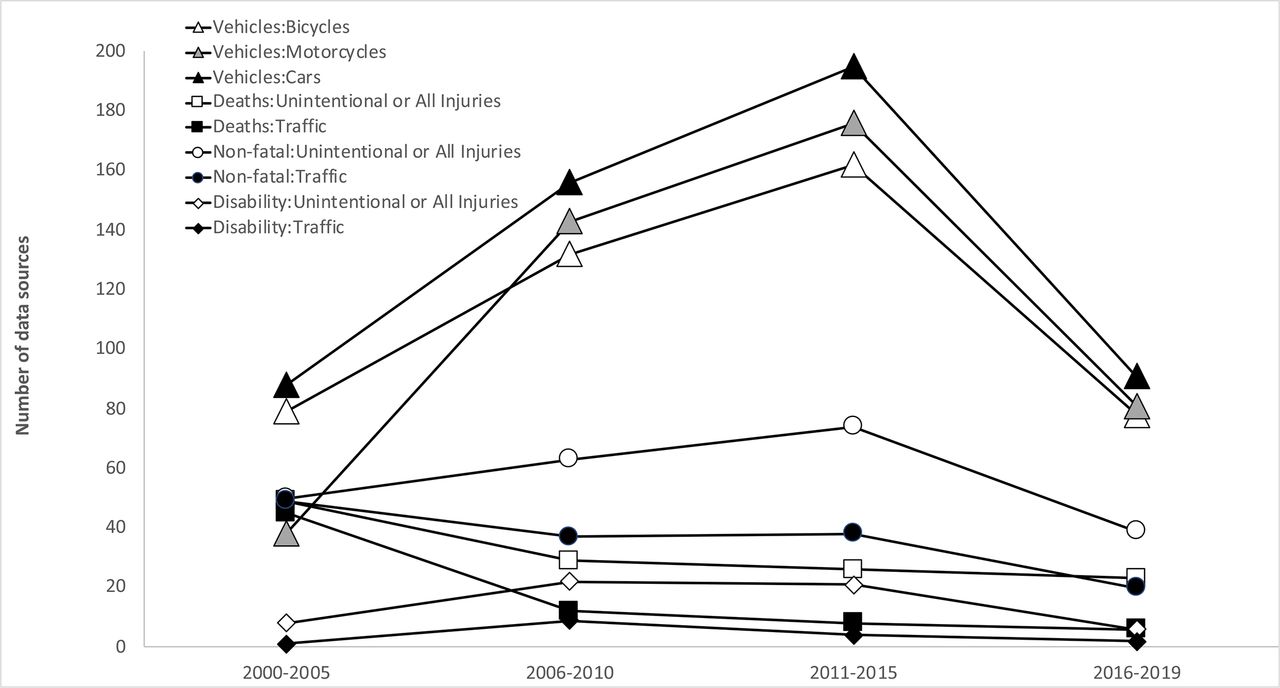
Time trend in availability of data sources.
Figures 2–5 restrict attention to recent data sources, that is, since 2010. (Similar figures for data sources since 2000 are provided in onine supplemental appendix). Most LMICs have multiple data sources on vehicle ownership since 2010 (figure 2). About half of these sources are from sub-Saharan African countries (bicycles: 54%, motorcycles: 50%, cars: 48%), including three countries (Kenya, Rwanda, Tanzania) that had more than 10 measurements each since 2010. LMICs in South Asia also tended to have several measurements of vehicle ownership since 2010 (Afghanistan: six, Nepal: nine, Pakistan: six). LMICs in other regions tended to have fewer measurements but usually more than one.

Number of sources that report household ownership of (a) bicycles, (b) motorcycles and (c) cars since 2010.
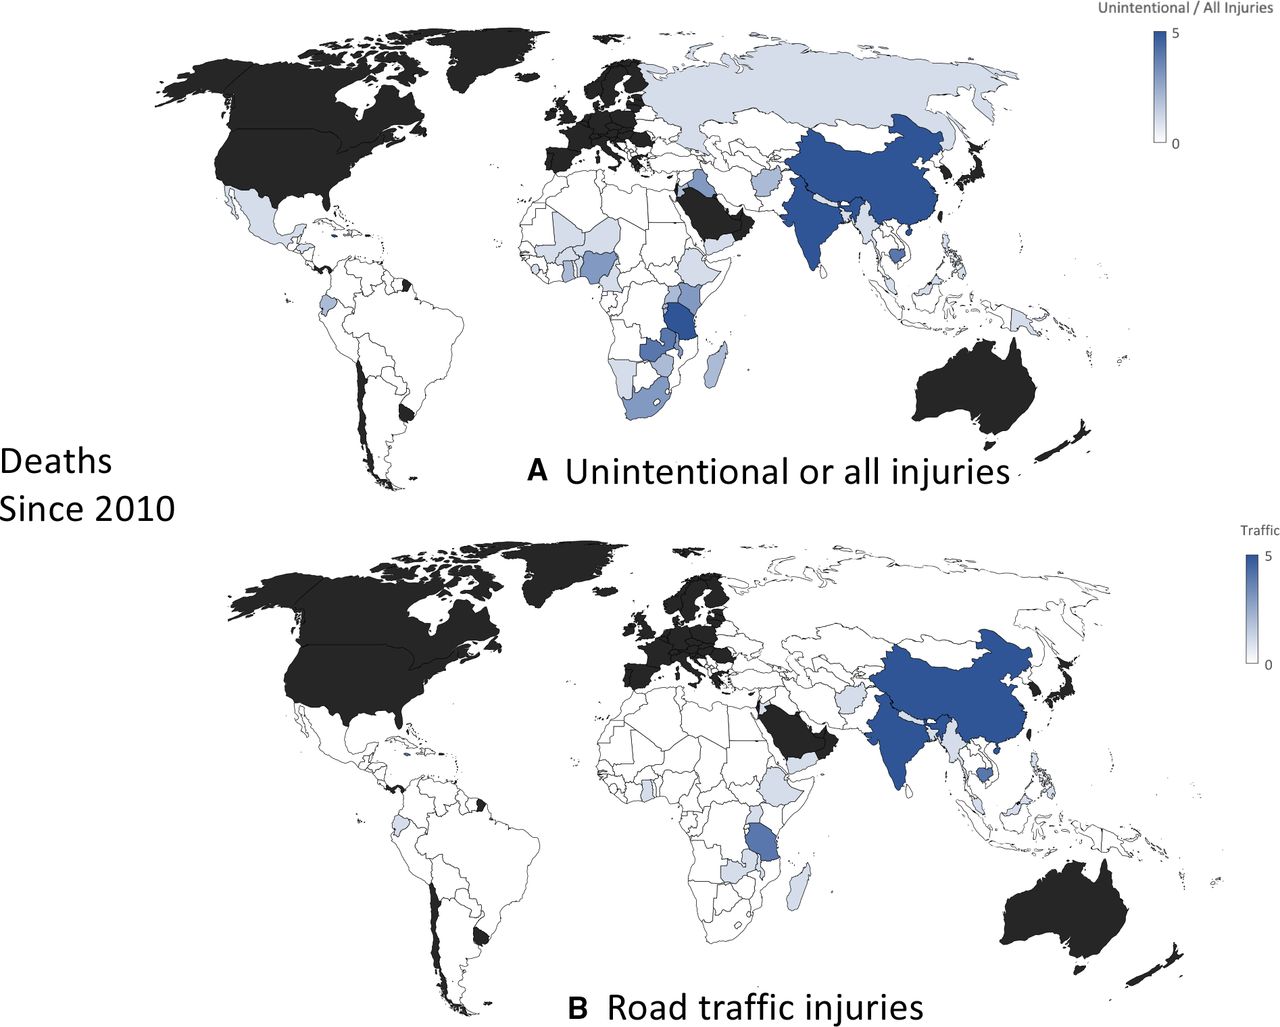
Number of sources that report deaths due to (A) unintentional or all injuries and (B) road traffic injuries, since 2010.
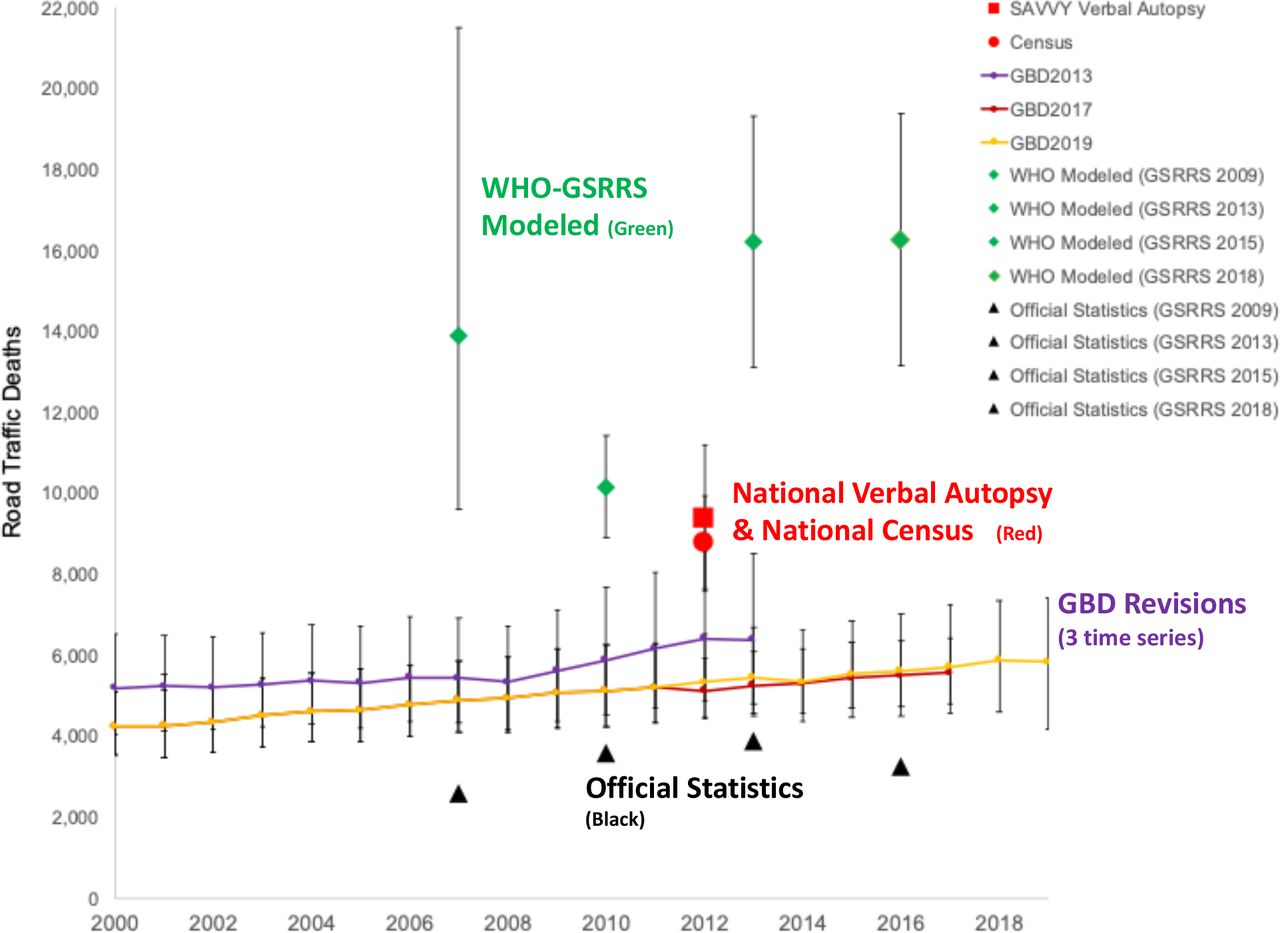
Estimates of road traffic deaths in Tanzania based on the national census and a national verbal autopsy survey compared with official statistics, and GBD and GSRRS estimates. GBD, Global Burden of Disease; GSRRS, Global Status Reports on Road Safety; SAVVY, Sample Vital Registration with Verbal Autopsy study.
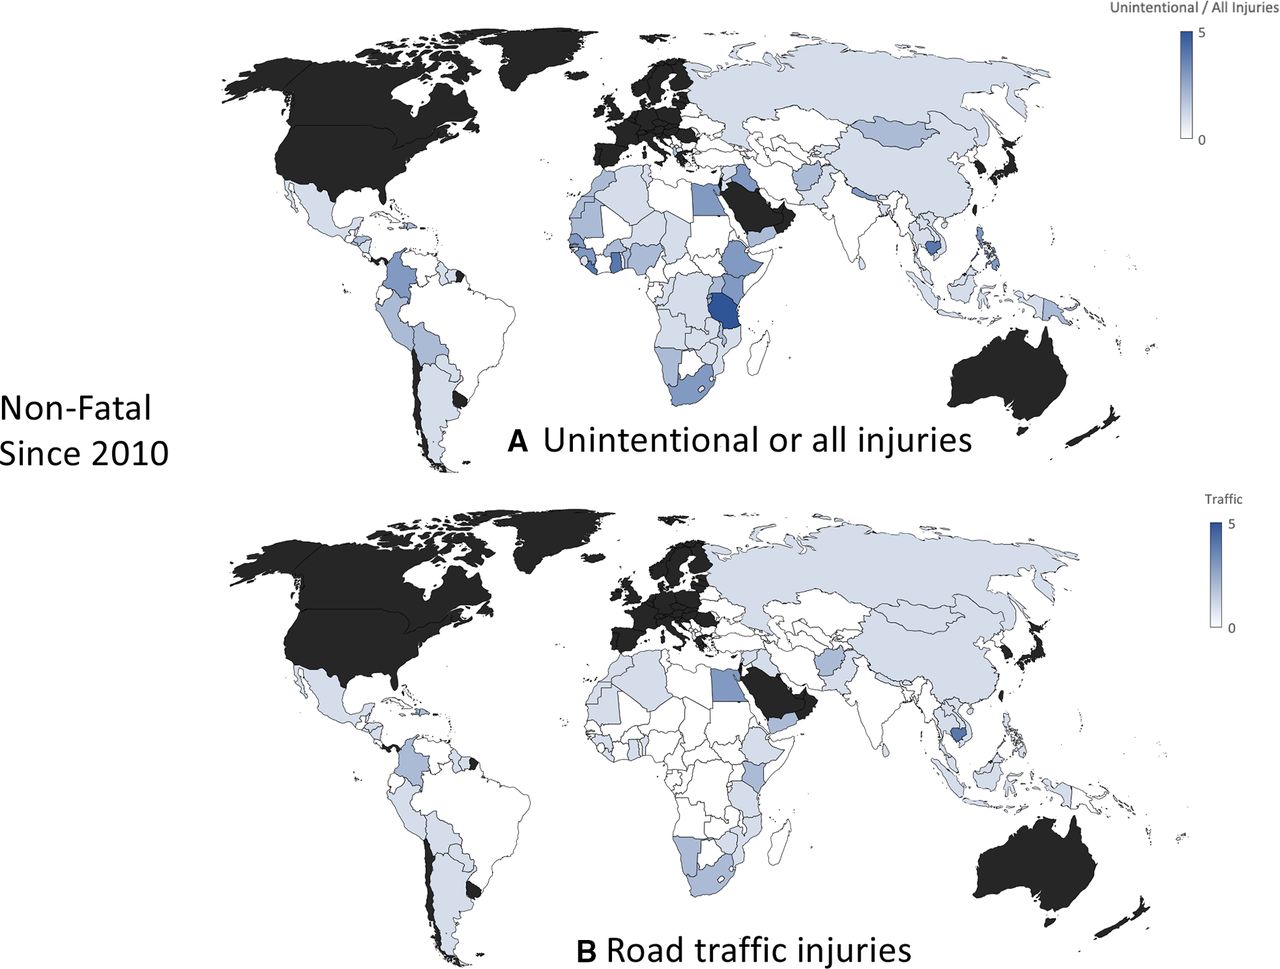
Number of sources that report non-fatal (a) unintentional or all injuries and (b) road traffic injuries, since 2010.
There were only 21 countries with data sources since 2010 that included questions on road traffic deaths (figure 3). Among these, India and China have collected cause-of-death data as part of sample registration systems using verbal autopsy for more than 20 years. One-third (seven) of the countries were from sub-Saharan Africa, five were from East Asia and Pacific, four from South Asia, three from Latin America and Caribbean, and two from Middle East and North Africa. In contrast, there were 41 countries (with 74 data sources) on mortality due to the less-specific causes (unintentional or all injury), of which 20 countries (41 data sources) were from sub-Saharan Africa.
Figure 4 provides an illustrative example of the value of such information for resolving discrepancies in estimates of road traffic deaths in one country, Tanzania. In 2016, official statistics were based on traffic police which reported 3256 deaths. In contrast, GBD-2019 estimated 5824 deaths (95th Uncertainty Interval: 4612–7414), and WHO estimated a figure that was almost three times higher, 16 252 (95th CI: 13 130 to 19 374) deaths with non-overlapping uncertainty intervals. The national population census and the nationally representative verbal autopsy (SAVVY), both conducted in 2012, show estimates that are consistent with each other and are approximately midway between GBD or WHO estimates, and about twice the official statistics.
We found 75 data sources since 2010 from 62 countries that included questions on non-fatal injuries sustained by household members in road traffic crashes (figure 5). Of these, 21 data sources (18 countries) were from East Asia and Pacific, 19 (16 countries) were from Latin America and Caribbean, and 16 (13 countries) from sub-Saharan Africa. There were almost twice as many, 144 data sources (87 countries), with information on the less-specific category of unintentional or all injury. Of these, 62 data sources (32 countries) were from sub-Saharan Africa.
Finally, we found only 14 data sources (12 countries) since 2010 that included questions about the prevalence of permanent disabilities due to traffic injuries, of which three each were from sub-Saharan Africa, East Asia and Pacific, and Europe and Central Asia, two were from the Middle East and North Africa, and one was from Latin America and Caribbean (online supplemental figure A7). As with sources for incidence of deaths and non-fatal injuries, there were many more sources (38 data sources, 32 countries) with questions on the prevalence of disabilities due to the less-specific unintentional or all injury category. Of these, 15 data sources (12 countries) were from sub-Saharan Africa.
Discussion
Various factors, notably including the need to track SDGs, have resulted in a large increase in the use of household surveys and censuses to improve measurement of population health for many health domains in countries with weak health surveillance infrastructure.12 13 This increase is reflected in the large and increasing amount of data sources that allow measurement of household ownership of bicycles, motorcycles and four-wheeled motor vehicles. These questions were usually part of the household asset inventories which are commonly included as a proxy measure for household income or wealth in household surveys.23 While these questions are not intended for estimating traffic injuries, reliable measures of bicycle and motor-vehicle ownership and use are arguably the most important covariates of traffic injuries and hence important for estimating injuries in countries with little local data on deaths/injuries. Both GBD and GHE/GSRRS use vehicle registration data in their estimation models. However, bicycles are never included in vehicle registration, and in many countries, especially LMICs, unregistered motorcycles are common.24–26 Vehicle registration may also over-represent the vehicle fleet because, in many LMICs, vehicles are only registered once (at the start of their use) and not removed from registration after they are scrapped.26 27 Thus, household surveys and censuses can help validate and correct information from national motor vehicle registries, which in turn can help improve national estimates of road traffic injuries.
Despite the general increase in health surveys, we did not find a concomitant increasing trend in measurement of road traffic injuries (figure 1), highlighting that the road safety community has failed to leverage these new measurement opportunities. In the last decade, there have been relatively few censuses and surveys that allow direct measurement of national road traffic deaths. The few such sources that do exist are in global regions that have little other nationally representative data and, therefore, substantial uncertainty in estimates of traffic mortality. For instance, Cambodia, Tanzania, Tonga and Vietnam, have questions in their national census on household deaths due to road traffic injuries. Nevertheless, these data sources are not used in global estimates generated by either WHO or GBD, which have large discrepancies for these countries. Our analysis of data sources from Tanzania (figure 4) highlights that the use of these data sources in global models can substantively reduce these discrepancies. These data sources are also not used in national road safety dialogue. We conducted a PubMed and Google Scholar search for papers on road traffic injuries in Tanzania. We identified 12 publications since 2012, none of which mentioned these two data sources.
While data sources that measure road traffic deaths were rare, there were many sources for the less-specific category of deaths due to unintentional or all injuries. This was also true for data sources for incidence of non-fatal injuries and prevalence of disabilities. There is relatively little policy interest in measuring these categories, and the data are also not used by WHO or GBD in disease modelling. In the case of deaths, these questions are usually included in censuses and surveys to measure maternal mortality,10 where injury deaths need to be excluded. For non-fatal injuries, such questions were typically in surveys that aimed to measure healthcare utilisation. Relatively minor modifications to these non-specific questions (eg, by including an additional follow-up question to include traffic injuries or by modifying the response options) could make them important sources for estimates of the incidence of deaths and non-fatal injury and permanent disability due to road traffic injuries.
The marginal costs of modifications to censuses and surveys that will already be conducted is small in comparison to the value of the additional measurements on traffic injuries. However, our analysis also shows that an opportunistic approach will not be sufficient to enable tracking of progress towards SDG 3.6. That would require systematic identification of forthcoming censuses and surveys in LMICs and working to include carefully crafted and globally standardised injury modules that allow both the magnitude and trend in road traffic deaths and severe injuries to be measured. These modules need to be tested and validated to address known issues with survey-based measurements, such as differential item functioning, memory decay (including for prominent memories) and telescoping.28–31 Well-designed surveys can reduce bias by using large samples, questions that restrict reporting to recent events and reporting of currently owned/used vehicles only. Injury modules also need to be calibrated so that they measure injuries using a common definition of severity.32 We need household survey instruments that are calibrated to measure severe injuries based on, for instance, the duration of treatment or the impact on daily activities.
Finally, it is important to appreciate that while survey-based measurements can help provide a benchmark for countries to assess the completeness of their existing surveillance systems, surveys and even health facility-based surveillance cannot replace police records because they do not provide the timely and detailed information that is needed to meet the information requirements of running an evidence-based national road safety programme. For instance, police records from the crash scene are the only source that can provide information on crash configurations, crash locations, roadway conditions, use of protective devices (eg, helmets and seat belts), and other risk factors that are amenable to interventions. Strengthening police-based surveillance will require large investments from countries (the US spends US$43 million annually on their crash data systems),33 as well as support from international actors in developing country capacity, and regional and global road safety observatories for harmonised collection of data on road traffic injuries and improved sharing of data among relevant stakeholders.33–35
Data availability statement
Data are available on reasonable request.
Ethics statements
Patient consent for publication
Supplementary materials
Supplementary Data
This web only file has been produced by the BMJ Publishing Group from an electronic file supplied by the author(s) and has not been edited for content.
Footnotes
Handling editor Seema Biswas
Contributors SM and KB contributed to the study design and jointly led all aspects of the study. JR and SM initiated the research into the issue. KN, LWM, HG, LB, MW, RB and JR searched for data sources and reviewed questionnaires. SM and KB wrote the first draft of the article. All authors contributed to discussion and interpretation of the results and to the writing of the manuscript. KB is the guarantor of this paper responsible for the overall content of the manuscript. All authors have read and approved the final manuscript.
Funding This investigation was conducted by researchers from the University of Chicago and the World Bank Global Road Safety Facility and supported by funding from UKAID (Award/Grant Number: 7197082).
Map disclaimer The inclusion of any map (including the depiction of any boundaries therein), or of any geographic or locational reference, does not imply the expression of any opinion whatsoever on the part of BMJ concerning the legal status of any country, territory, jurisdiction or area or of its authorities. Any such expression remains solely that of the relevant source and is not endorsed by BMJ. Maps are provided without any warranty of any kind, either express or implied.
Competing interests None declared.
Provenance and peer review Not commissioned; externally peer reviewed.
Supplemental material This content has been supplied by the author(s). It has not been vetted by BMJ Publishing Group Limited (BMJ) and may not have been peer-reviewed. Any opinions or recommendations discussed are solely those of the author(s) and are not endorsed by BMJ. BMJ disclaims all liability and responsibility arising from any reliance placed on the content. Where the content includes any translated material, BMJ does not warrant the accuracy and reliability of the translations (including but not limited to local regulations, clinical guidelines, terminology, drug names and drug dosages), and is not responsible for any error and/or omissions arising from translation and adaptation or otherwise.