Article Text

Abstract
Background With reports of surges in COVID-19 case numbers across over 50 countries, country-level epidemiological analysis is required to inform context-appropriate response strategies for containment and mitigation of the outbreak. We aimed to compare the epidemiological features of the first and second waves of COVID-19 in Nigeria.
Methods We conducted a retrospective analysis of the Surveillance Outbreak Response Management and Analysis System data of the first and second epidemiological waves, which were between 27 February and 24 October 2020, and 25 October 2020 to 3 April 2021, respectively. Descriptive statistical measures including frequencies and percentages, test positivity rate (TPR), cumulative incidence (CI) and case fatality rates (CFRs) were compared. A p value of <0.05 was considered statistically significant. All statistical analyses were carried out in STATA V.13.
Results There were 802 143 tests recorded during the study period (362 550 and 439 593 in the first and second waves, respectively). Of these, 66 121 (18.2%) and 91 644 (20.8%) tested positive in the first and second waves, respectively. There was a 21.3% increase in the number of tests conducted in the second wave with TPR increasing by 14.3%. CI during the first and second waves were 30.3/100 000 and 42.0/100 000 respectively. During the second wave, confirmed COVID-19 cases increased among females and people 30 years old or younger and decreased among urban residents and individuals with travel history within 14 days of sample collection (p value <0.001). Most confirmed cases were asymptomatic at diagnosis during both waves: 74.9% in the first wave; 79.7% in the second wave. CFR decreased during the second wave (0.7%) compared with the first wave (1.8%).
Conclusion Nigeria experienced a larger but less severe second wave of COVID-19. Continued implementation of public health and social measures is needed to mitigate the resurgence of another wave.
- COVID-19
- epidemiology
- descriptive study
Data availability statement
Data are available on reasonable request. Data may be made available on request, subject to compliance with the Nigeria Centre for Disease Control (NCDC) data sharing policy.
This is an open access article distributed in accordance with the Creative Commons Attribution Non Commercial (CC BY-NC 4.0) license, which permits others to distribute, remix, adapt, build upon this work non-commercially, and license their derivative works on different terms, provided the original work is properly cited, appropriate credit is given, any changes made indicated, and the use is non-commercial. See: http://creativecommons.org/licenses/by-nc/4.0/.
Statistics from Altmetric.com
Key questions
What is already known?
Globally, there have been reports of the resurgence of COVID-19 cases in waves. In Africa, some countries have reported second and even third waves of COVID-19 cases. A country-level descriptive epidemiology of COVID-19 cases between February 2020 and June 2020 in Nigeria has been published. A continent-level analysis of the first and second waves in Africa reported a larger and more severe second wave. The study underscored the need for country-level analyses to inform the implementation of country-specific interventions to mitigate the outbreak. To our knowledge, there is no country-level analysis comparing the epidemiological features of the first and second waves in Nigeria.
Key questions
What are the new findings?
Nigeria reported a larger but less severe second wave of COVID-19, with a notable increase in testing capacity in the second wave. Though there was an increase in test positivity rate and cumulative incidence, there was a decrease in the case fatality rate during the second wave, compared with the first wave. During the second wave, there was an increase in cases among the younger and female demographics. Mortality was highest among the elderly in both waves, with a significant increase in the mean age at death during the second wave.
What do the new findings imply?
This retrospective analysis provides a better understanding of the epidemiological features of the first and second waves of COVID-19 in Nigeria. The difference in the sociodemographic and clinical features of cases in both waves are informing the implementation of targeted country-level initiatives for containment and mitigation of the impact of the pandemic on health, community and socioeconomic systems. In the face of a possible third wave, the findings form the basis of our proposals for the sustenance of COVID-19 public health and social measures and a prompt scale-up of vaccination.
Introduction
The emergence of the COVID-19, caused by the SARS-CoV-2 was first identified in Wuhan, China, in December 2019. It has arguably been one of the biggest threats to global health security in the 21st century. Following the ‘alarming levels of spread and severity, and by the alarming levels of inaction’, the outbreak was declared a pandemic by the director-general of the WHO on 11 March 2020.1
The index case of the disease in Nigeria was recorded on the 27 February 2020.2 Within 5 months (by the 7 July 2020), all 36 states and the Federal Capital Territory (FCT) had reported at least a case of the disease, with a total number of 29 789 cases and 669 deaths.3 The Federal Government of Nigeria, through the Presidential Task Force on COVID-19 (now the Presidential Steering Committee on COVID-19) and the Nigeria Centre for Disease Control (NCDC), the national public health institute, are leading and coordinating response activities to the pandemic.4 5
Implementation of outbreak preparedness interventions commenced in Nigeria, before the index case.6 Following the report of the index case, containment and subsequently, strategies to mitigate against the impact of the outbreak on health, community and economic systems were deployed at different phases during the pandemic.6 More recently, the country began the roll-out of COVID-19 vaccines on 16 March 2021, and by 9 April 2021, all states including the FCT had commenced vaccination.7 The roll out of vaccines prioritised healthcare workers (HCWs), support staff, first responders, frontline workers and strategic leaders.8 Global vaccine inequity has seen Nigeria secure just about 4 million doses of COVID-19 vaccines through the COVAX facility, with only approximately 2% of the population vaccinated by 30 June 2021.9 10
Despite the increase in COVID-19 testing capacity across the country since the beginning of the pandemic, the testing rate remains relatively low compared with other African countries. As of 22 June 2021, the number of tests in Nigeria, the most populous country on the African continent, was 11 per 1000 population.11 In comparison, other African countries such as South Africa, Ghana, Kenya and Uganda had tests per 1000 population of 212, 39, 31 and 27, respectively.11 Concerns over the low testing rates underpinned implementation of the population-based serosurveys conducted across some states in the country to estimate the true burden of infection.12 Repeated sero-surveillance surveys that are representative of the country are desirable but can be expensive and logistically challenging, largely leading to ongoing reliance on routine surveillance data.
Real-time epidemiological information for routine surveillance of COVID-19 cases across all states in Nigeria, including the FCT, is captured on the Surveillance Outbreak Response Management and Analysis System (SORMAS). As of 15 July 2021, 2 362 757 samples had been tested, 1 68 916 cases had been confirmed (7.15% test positivity rate) and 2138 deaths had been reported among the confirmed (1.27% case fatality rate (CFR)).13
Although there is no formal epidemiological definition of a wave of infection, it has been characterised as ‘a rising number of sick individuals, a defined peak and then a decline’14–16; this will be the working definition of a wave of infection for this paper. It is not unexpected for waves of infections to occur during pandemics of viral origin. Several countries have reported second waves of the COVID-19 pandemic, and some countries including South Korea, Spain, Uganda and Zambia have described a third wave.17–21
On the continental level, African countries had experienced two waves of the pandemic between the 14 February 2020 (when the first case on the continent was reported) and 31 December 2020, with a significantly higher number of cases in the second wave.22 A descriptive analysis of COVID-19 epidemiological data of African countries found the peak of the first wave to be in July 2020, with a mean daily number of new cases of 18 273.22 By December 2020, almost three-quarters of countries in the region were experiencing or had experienced a second wave of infection, with a mean daily number of new cases of 23 790.
Nigeria experienced a gradual increase in the number of confirmed COVID-19 cases from epidemiological week 9 of 2020 (23–29 February – when the index case was reported), peaked at epidemiological week 26 of 2020 (21–27 June) and then experienced a gradual decrease until epidemiological week 43 of 2020 (18–24 October). As from epidemiological week 44 of 2020 (25–31 October), there was another steady increase in the number of confirmed cases, peaking at epidemiological week 3 of 2021 (17–23 January). A gradual decline of cases has since been seen up until epidemiological week 15 of 2021 (11–17 April). Based on these findings, we assume that Nigeria experienced its first wave of COVID-19 infection between February 2020 and October 2020, and the second wave, which is still ongoing started in November 2020.
Epidemiological and clinical analyses of nationwide cases within the first wave (February–June 2020) using the SORMAS database have been published.2 The study found the cumulative incidence (CI) and CFR of the disease to be 5.6 per 100 000 population and 2.8%, respectively. The majority of confirmed cases were among males (65.8%) and those between 31 and 40 years old (25.5%). Two-thirds of cases were asymptomatic at diagnosis, and mortality was highest among males (79.0%) and those between 61 and 70 years old (26.6%).
There is a need for country-level analysis to further understand the epidemiology of this novel virus to aid informed decision making in controlling the epidemic. In addition to giving an update on the descriptive epidemiology of COVID-19 cases between February 2020 and June 2020,2 this study aimed to compare the epidemiological features of the first and second waves of COVID-19 in Nigeria between 27 February 2020 and 3 April 2021.
Methods
Study design, period and settings
We conducted a retrospective analysis of Nigeria’s surveillance and laboratory data between 27 February 2020 and 3 April 2021. Nigeria is made up of 36 states and the FCT, which are divided into six geopolitical zones: North-East (Adamawa, Bauchi, Borno, Gombe, Taraba and Yobe), North-West (Jigawa, Kaduna, Kano, Katsina, Kebbi, Sokoto and Zamfar), North-Central (Benue, FCT, Kogi, Kwara, Nasarawa, Niger and Plateau), South-South (Akwa Ibom, Bayelsa, Cross River, Delta, Edo and Rivers) South-West (Ekiti, Lagos, Ogun, Ondo, Osun and Oyo) and South-East (Abia, Anambra, Ebonyi and Enugu Imo). During the study period, all states and the FCT actively monitored for cases, and all reported confirmed COVID-19 cases.
Data source
The sole source of data for this study was from the SORMAS, an open-source real-time electronic health surveillance database for diseases of public health importance that was domesticated by the NCDC in 2017.23 It is the principal digital surveillance tool used for the implementation of the Integrated Disease Surveillance and Response strategy in Nigeria. In January 2020, a COVID-19 module was added to the SORMAS platform. The SORMAS platform is configured on mobile devices (tablets and smartphones) and laptops for reporting surveillance and laboratory data by trained personnel. The SORMAS database is owned by NCDC and cases across the states are reported on the platform. Data are processed and stored in a central server at its headquarters in Abuja, Nigeria, from where it is analysed for decision making and action.
Study population and data collection
The study population was made up of persons tested for SARS-CoV-2 infection and captured on SORMAS during the study period. Eligibility for testing was based on the NCDC case definition for a COVID-19 suspected case.24 However, samples were also collected from contacts of confirmed cases, and those who got tested for COVID-19 as a mandatory requirement for international travel.
Every person who got tested had a Case Investigation Form, which contained sociodemographic information, epidemiological history and clinical characteristics. Sample collection, packaging and transportation to a molecular laboratory were conducted in accordance with the NCDC guidelines.25 At least one nasal (or nasopharyngeal) swab and one oropharyngeal swab using synthetic fibre swabs with plastic shafts were collected. Collected specimens were triple packaged and transported aseptically via viral transport media, under suitable temperature conditions (2°C–4°C) to a designated NCDC-approved laboratory.26 Real-time PCR was used for the laboratory diagnosis of COVID-19. All confirmed COVID-19 cases were managed according to the NCDC’s national clinical management guidelines.27 All data and sample collection and processes were performed by trained health workers.
Data management and definition of study variables
Deidentified data were retrieved from SORMAS. The first epidemiological week (hereinafter: week) was defined as the week ending on the first Saturday of January 2020; subsequent weeks however began on Sunday and ended on Saturday.28 The current study covered weeks 9–53 of 2020 and weeks 1–13 of 2021. An epidemiological wave (hereinafter: wave) was defined as the time from the start of a peak (first week with increasing numbers of cases) to the end of a peak (week with a nadir of cases before the next rise). A wave was classified as a binary variable: first wave (week 9–43 of 2020) and second wave (week 44 of 2020 to week 13 of 2021). The definitions of other covariates are available in a previous paper.2 Owing to the significant proportion of missing data, the missing indicator approach, which is simple, more efficient and ensures all participants can be included in the analysis to maintain statistical significance, was used in handling missing data.29 30
Definition of variables
The unit of analysis in this study is a confirmed case.
Outcome variables
The primary outcomes for this study were test positivity rate (TPR), CI and CFR. TPR was defined as the proportion of all tests conducted that was positive for COVID-19, expressed as a percentage (number of confirmed COVID-19 cases during the study period/total COVID-19 tests conducted during the study period × 100%). CI was defined as the ratio of COVID-19 cases in a defined area to the estimated population of that area. Using a national average growth rate of 3.2%, CI for each reporting state was calculated using the projected Nigerian population of 2021 from the 2006 national population census and was multiplied by 100 000 to ease interpretation. CFR was defined as the proportion of persons diagnosed with COVID-19 who died during the study period, expressed as a percentage. TPR, CI and CFR were calculated for Nigeria and for each state separately.
Exposure variables
Age was categorised using a 10-year interval scale. The residential setting of each person was categorised into rural or urban, based on their local government area of residence. Persons with at least one symptom were reclassified as symptomatic, while those with no symptom at the time of testing were classified as asymptomatic.
Statistical analyses
Categorical variables were described using frequencies and percentages. Mean and SD were calculated for normally distributed data, while median and IQRs were calculated for non-normally distributed data. Pearson’s χ2 test was used to evaluate the association between sociodemographic and clinical characteristics with the first and second waves. A similar approach was used for the assessment of the association between sociodemographic/clinical characteristics and COVID-19 deaths in the first and second waves. A p value of <0.05 was considered statistically significant. All statistical analyses were carried out in STATA V.13 (Stata Corp). The report of this study was structured in accordance with the Strengthening the Reporting of Observational Studies in Epidemiology statement of the Equator Network (V.4).31
Patient and public involvement statement
Patients were not involved in this study.
Results
During the first wave (27 February 2020–24 October 2020) and the second wave (25 October 2020–3 April 2021), 362 550 and 439 593 records, respectively, were entered into the SORMAS database, resulting in a total of 802 143 records. This is also equivalent to the total number of tests conducted during the study period with the second wave having a 21.3% increase in the number of tests. The national epi-curve showing the COVID-19 cases during the first and second waves for the period under review is as shown in figure 1.

Distribution of confirmed cases showing outcomes by epidemiological week.
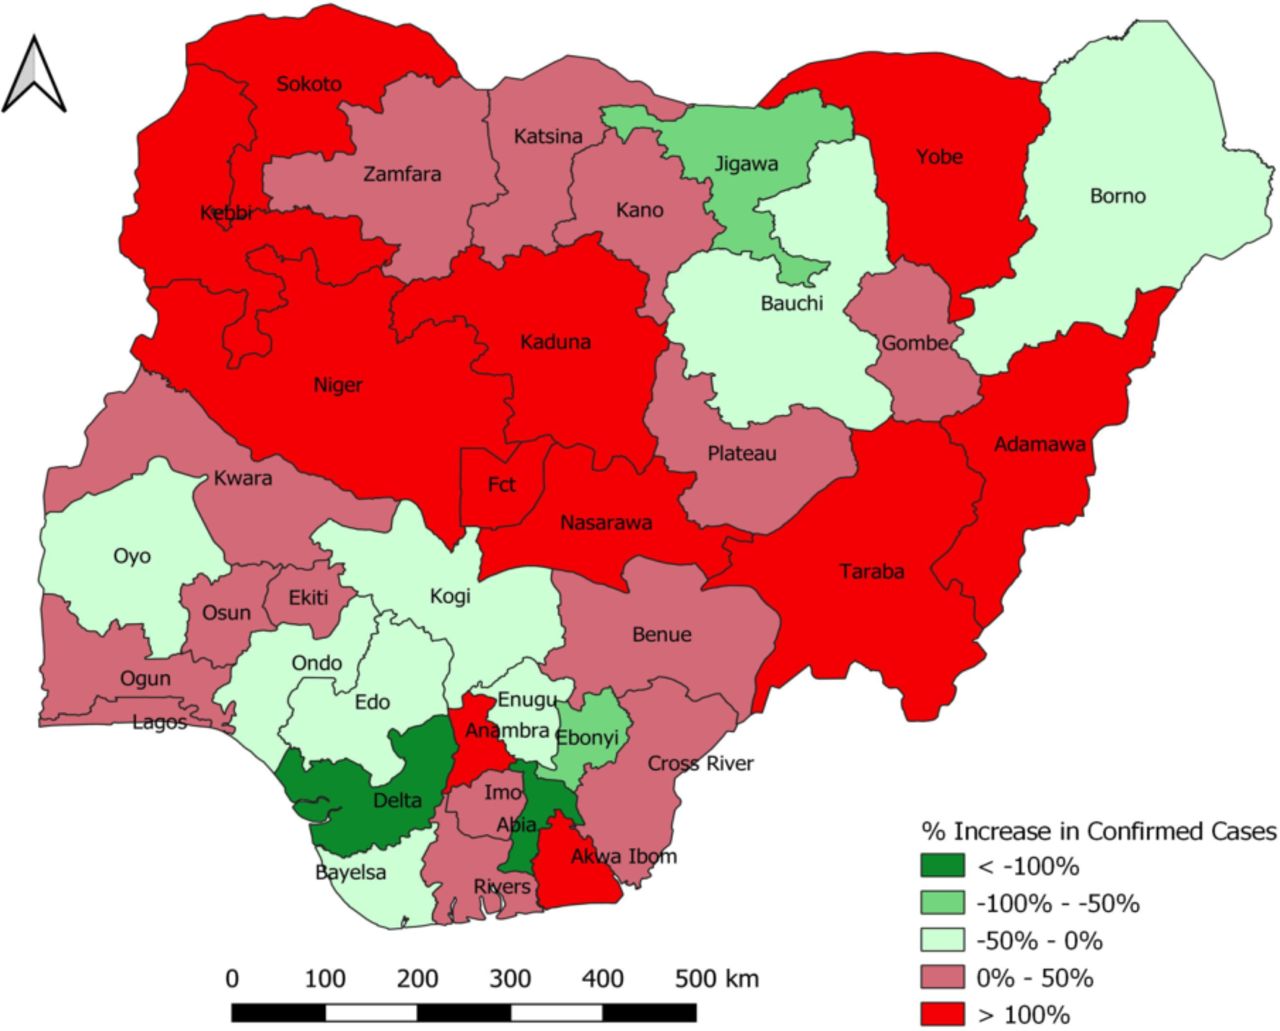
The COVID-19 indicators at the national and subnational levels for the first and second waves are as captured in table 1. TPR increased from 18.2% in the first wave to 20.8% in the second wave, representing a 14.3% increase. Subnational disaggregation showed that states with the highest TPR during the first wave were Imo (48.0%), Abia (43.5%) and Osun (41.9%), while those with the lowest TPR were Kogi (2.9%), Katsina (4.7%) and Ekiti (5.2%). During the second wave, Oyo (44.9%), Plateau (40.7%) and Kano (40.5%) had the highest TPR, while Kogi (0%), Jigawa (6.0%) and Zamfara (6.2%) had the lowest TPR. The percentage increase in the absolute number of cases between the second and first waves in each state is as shown in figure 2. The top three states with the highest percentage increase were Taraba (83%), Anambra (82%) and Akwa-Ibom (76%). States that recorded a decrease in TPR during the second wave include Abia, Bayelsa, Borno, Delta, Ebonyi, Edo, Enugu, Jigawa, Ondo and Oyo States.
COVID-19 indicators at the national and subnational levels for the first and second waves

Percentage increase in cases between the first and second waves.
During the first wave, the CI was 30.3 per 100 000 as a national average, ranging from 0.1 per 100 000 in Kogi State to 167.6 per 100 000 in Lagos State. Corresponding figures for the second wave were 42.0 per 100 000 for the national average, ranging between 0 per 100 000 in Kogi State and 215.2 per 100 000 in Lagos State. There was a decrease in the CFR during the second wave (0.7%), compared with the first wave (1.8%) at the national level. During the first wave, the top three states with highest CFRs were Yobe (11.0%), Sokoto (11.0%) and Kebbi (8.6%). During the second wave, the top three states with the highest CFRs were Delta (2.8%), Edo (2.7%) and Katsina (2.7%). Notably, despite Lagos State having the highest CI in the country during the first and second waves, CFR was 0.9% and 0.4%, respectively.
The description of sociodemographic/clinical characteristics of the confirmed COVID-19 cases and the waves in Nigeria are as shown in table 2. The mean (SD) age of those who tested positive was higher in the second wave – 33.57 (15.28) years, compared with the first wave – 37.67 (16.30) years (p value <0.001). There was a 10.09% increase in the proportion of people under the age of 30 years who got infected during the second wave, compared with the first wave. There was a statistically significant (p value <0.001) increase in the proportion of females who tested positive in the second wave (41.90%) compared with first wave (35.64%). There was a significant decrease in the proportion of infected persons who were HCWs from 7.51% during the first wave to 2.89% during the second wave (p value <0.001). Compared with the second wave, there was a decrease in the proportion of those cases who had a history of travel within 14 days of sample collection: from 3.77% to 0.98% (p value <0.001). There was also a decrease in the proportion of confirmed cases who were admitted to treatment centres during the second wave (1.36%) compared with the first wave: 10.38% (p value <0.001).
Sociodemographic characteristics and clinical features of confirmed COVID-19 cases during the two waves in Nigeria
At sample collection, there was an increase in the proportion of individuals who were asymptomatic during the second wave (79.70%), compared with the first wave (74.96%, p value <0.001). The most frequently reported symptoms among those who got infected during the first wave were cough (50.79%), fever (46.66%) and sore throat (22.90%), while during the second wave, cough (43.23%), fever (40.29%) and runny nose (38.23%) were the most reported (online supplemental file 1).
Supplemental material
The sociodemographic and clinical characteristics of patients with COVID-19 associated deaths during the first and second waves are shown in table 3. The mean age at death from COVID-19 infection was higher in the second wave: 60.72±17.42 years, compared with the first wave: 56.93±16.27 years (p value <0.001). There was an 8.74% increase in the proportion of females who died during the second wave, compared with the first wave (p value <0.001). During the second wave, the proportion of those who died in urban areas increased from 45.54% to 51.39% (p value 0.036). At sample collection, there was a decrease in those who were asymptomatic during the second wave (39.48%), compared with the first wave (44.84%, p value 0.028)). Cough, fever and difficulty in breathing remained the most common symptoms among those who died during both waves.
Sociodemographic characteristics and clinical features of COVID-19 related deaths during the two waves in Nigeria
During both waves, most of the confirmed cases were asymptomatic (first wave: 74.93%, second wave: 79.7%). The most frequently reported symptoms among confirmed cases that died during the first wave were cough (50.79%), fever (46.66%) and sore throat (22.90%), while during the second wave, cough (43.23%), fever (40.29%) and runny nose (38.23%) were the most reported (online supplemental file 2).
Supplemental material
As shown in table 4, the median time from symptom onset to time of sample collection was 2 days (0–5) and 1 day (0–3) in the first and second waves, respectively. Similarly, the time from symptom onset to presentation at a health facility decreased from 1 day (0–5) in the first wave to 0 day (0–3) s wave. Median duration in isolation remained the same in both waves (14 days). There was a decrease in the median time of hospital admission, from 15 days (10-–21) in the first wave, to <1 day in the second wave.
Timeline of socioclinical variables among confirmed COVID-19 cases
Discussion
To our knowledge, this is the first study comparing the epidemiological characteristics of the first and the second waves of COVID-19 across all states (including the FCT) in Nigeria. Our study found a 21.3% increase in the number of tests conducted and a 14.3% increase in TPR during the second wave. This finding suggests that there was increased transmission of the virus. These may be attributed to an increase in sample collection and testing capacity, increased surveillance activities and reopening of the economy and social gatherings during the second wave.6 32 The testing capacity in Nigeria was gradually built over several months of the first wave, and extensive testing infrastructure was already in place at the beginning of the second wave.32 The findings may also potentially point to the role of virus variants, which have been reported to have higher transmissibility and highlight the need for strengthened genomic surveillance.33
Similarly, there was an increase in CI in the second wave, and this may also be related to the general improvement in testing capacity in the country. Notably, there was a wide range in CI across the states during both waves. For instance, Kogi State recorded as low as 0.1 per 100 000 and 0 per 100 000 during the first and second waves, respectively, and Lagos State reported 167.6 per 100 000 and 215.2 per 100 000 during the first and second waves, respectively. However, during the first and second waves, Kogi State tested the least number of samples in the country. This may suggest an underestimation of the CI rate and, by extension, the CFR of COVID-19 in the state. Across geopolitical zones, a lower CI was reported in the Northern zone (especially in the North-eastern zone) of the country compared with the Southern zone. These disparities may not be unrelated to the stark difference in testing rates due to varying diagnostic capacities, as well as cultural, sociopolitical and security landscapes across the states and zones.
Fewer positive cases (a decrease by about 74%) reported a local or international travel history within 14 days of sample collection in the second wave; this may imply that this wave was largely driven by community transmission as opposed to the importation of cases. Considering that the incubation period could be as long as 14 days, the epi-curve (figure 1) supports an argument that this community transmission could have partly been driven by the yuletide, with the curve peaking in week 3 2021 for the second wave.34
During the second wave, there was a slight demographic shift towards a younger population. This is similar to findings by Saito et al35 in Japan. This shift may be attributed to certain activities that majorly involved this demographic during the second wave. In March 2020, the Nigerian government ordered the closure of schools, as part of its measures to curtail the pandemic, about 3 weeks after the incidence case of the disease was reported in the country.36 By the beginning of the second wave, most schools had reopened following the Federal Government’s approval of the phased reopening of schools, subject to compliance with non pharmacuetical intervention (NPIs) and the conduct of regular risk assessment activities.37 38 However, there were reports of COVID-19 outbreaks in some schools following this reopening.39 40 Following the reopening of schools, National Youth Service Corps orientation camps were also reopened.41 All Corp members underwent mandatory COVID-19 tests.42 At about the same period, the #ENDSARS protest against police brutality, which lasted for over 3 weeks in almost all states in Nigeria, occurred.43 Though anecdotal, the mass gathering of protesters who were majorly young people could have been a super spreader event for the transmission of the virus. Risk communications about the virus in Nigeria focused on emphasising the need for the general public to take responsibility to limit the transmission of the virus; it also amplified the higher risks for older populations and those with comorbidities.44 This has the potential to impact on risk and threat perception among young people, all that shape behaviour as the outbreak persists.44
Nigeria reported a decrease of about 61.5% in HCW infections during the second wave. This is incongruent with findings from Australia where an increase in HCW infections was recorded in the second wave.45 Though gaps still exist in facility-based surveillance activities for COVID-19 infection among HCWs, the findings from our study may be associated with the implementation and scale-up of innovative infection prevention and control measures and the increase in the distribution of personal protective equipment across health facilities in the country.46 47
The proportion of symptomatic individuals was lower in the second wave compared with the first wave. This is similar to findings from Spain, where there was a decrease in the proportion of symptomatic cases in the second wave.18 CFR was about three times less during the second wave, with a drop from 1.8% to 0.7%. These findings may be attributed to the higher proportion of younger people who got infected during the second wave. While young people contributed more to the number of COVID-19 cases during the second wave, there were fewer deaths among this demographic compared with older adults. Consequently, this could have led to the decrease in CFR seen during the second wave.
This study also found a decrease in the time from symptom onset to sample collection and a reduction in time from symptom onset to health facility visit. Increased risk perception with as high as 81% knowing that asymptomatic persons could transmit the infection, is a potential driver of this increased demand for testing.18 The findings may also be related to improved health-seeking behaviour as a result of sustained risk communication activities, wider access to testing allowing prompt diagnosis, isolation and treatment, enhancement in medical care and surveillance activities.32 48
Though there was an increase in morbidity and mortality among females in the second wave, males accounted for most of the cases reported during the first and second waves. This is congruent with results from other studies conducted in Nigeria.2 49 Galasso et al50 analysed the gender differences in COVID-19 attitudes and behaviour across eight high-income per capita countries with advanced health systems and found gender differences in risk and threat perception of COVID-19. Women were more likely to consider COVID-19 a serious health problem and were more likely to adhere to public health and social measures (PHSMs) compared with males; however, the proportion of women who complied with PHSMs decreased during the second wave.50 There may be limited applicability in Nigeria, considering the distinct socioeconomic and sociocultural differences with the countries surveyed. The audience perception survey in Nigeria however, based on the extended parallel process model for risk communications during the second wave, did not find any substantial gender differences in the perception of COVID-19 and adherence to PHSMs.51 Women were almost as likely to have low threat perception and low efficacy to comply with PHSMs (59%) as men (58%). The increase in morbidity and mortality during the second wave may be associated with the reopening of the economy and the general laxity in compliance with PHSMs, and other confounding factors like the presence of comorbidities and overall health status prior to infection. During both waves, mortality was highest among the elderly (>60 years). Several studies have found mortality to be higher among the elderly compared with younger age groups.52 53 This may be due to the higher risk for severe disease and the increased likelihood for comorbidities among this age group.54
Strengths and limitations
This study presents findings from the epidemiological comparison of the first and second waves of the COVID-19 pandemic in Nigeria based on reported cases on the SORMAS database. However, findings should be carefully interpreted considering certain limitations. A considerable proportion of the data across the variables analysed was missing. A similar study that analysed data from the database during the first 4 months of the pandemic also reported substantial missing cases.2 Despite the implementation of a data quality improvement project in April 2020 to drive data completeness of the SORMAS database to >90%, incomplete COVID-19 data remain a challenge, particularly at data collection points. Missing data across the variables ranged from 0.74% (sex – table 2) to 90.89% (quarantine location – table 1) and from 0.53% (sex – table 2) to 86.70% (quarantine location – table 1) during the first and second waves, respectively. Across sociodemographic characteristics (age group, sex, residential setting, education completed and current occupation), the average proportion of missing variables was 40.10% in the first wave and 46.60% in the second wave. Missing data may reduce the generalisability of the results to the target population and may lead to biased inferences. In addition, there could be a chance that some tests were carried out but not uploaded to SORMAS, thus excluding them from this analysis.
Conclusion
Regardless of the study limitations, this study provides country-level insight into the epidemiological characteristics of the first and second waves of COVID-19. Nigeria reported a larger but less severe second wave of COVID-19, with a notable increase in testing capacity in the second wave. Perhaps, the limited testing capacity during the first wave could have exaggerated the apparent increase in cases seen during the second wave. Further analysis at the subnational level could provide additional information on the drivers of COVID-19 transmission across the various states and regions of the country. Genomic surveillance will also be helpful to provide further insights into the role of variant strains of the virus. With efforts to balance containment of COVID-19 transmission and mitigation of its effects on health, community and economic systems, continued monitoring and analysis of epidemiological data is essential to implement evidence-based PHSMs. To aid the dissemination of accurate data to drive informed decision making, we propose the training and retraining of data collectors with close monitoring and periodic supportive supervision, in addition to an improvement in the SORMAS data quality. We recommend the sustenance of COVID-19 preventive measures and risk communication activities especially targeting the elderly who are at higher risk of mortality. We also recommend the rapid scale-up of vaccination to prevent the resurgence of another wave.
Data availability statement
Data are available on reasonable request. Data may be made available on request, subject to compliance with the Nigeria Centre for Disease Control (NCDC) data sharing policy.
Ethics statements
Patient consent for publication
Ethics approval
The study protocol was approved by the Nigerian National Health Research Ethics Committee (NHREC/01/01/2007-22/06/2020).
Acknowledgments
We appreciate all the Nigerian frontline health workers for their contribution to the collection of the data used for this study. We acknowledge the leadership and coordination provided by all state commissioners for health, epidemiologists and disease notification and surveillance officers. We are also grateful to colleagues, including members of the Epidemiological Working Group of the Nigeria COVID-19 Research Coalition (NCRC) who provided technical and administrative support for this manuscript. In addition, we acknowledge the African Field Epidemiology Network (AFENET) for providing financial support towards the publication of this manuscript.
References
Supplementary materials
Supplementary Data
This web only file has been produced by the BMJ Publishing Group from an electronic file supplied by the author(s) and has not been edited for content.
Footnotes
Handling editor Senjuti Saha
Twitter @KElimian, @Ehimario, @solaruna, @Mohtareek, @aadekaiyaoja, @tokwor7, @johnoladejo, @chinwe_ochu
Contributors EI acts as the Guarantor of this study
Funding The authors have not declared a specific grant for this research from any funding agency in the public, commercial or not-for-profit sectors.
Map disclaimer The inclusion of any map (including the depiction of any boundaries therein), or of any geographic or locational reference, does not imply the expression of any opinion whatsoever on the part of BMJ concerning the legal status of any country, territory, jurisdiction or area or of its authorities. Any such expression remains solely that of the relevant source and is not endorsed by BMJ. Maps are provided without any warranty of any kind, either express or implied.
Competing interests None declared.
Provenance and peer review Not commissioned; externally peer reviewed.
Supplemental material This content has been supplied by the author(s). It has not been vetted by BMJ Publishing Group Limited (BMJ) and may not have been peer-reviewed. Any opinions or recommendations discussed are solely those of the author(s) and are not endorsed by BMJ. BMJ disclaims all liability and responsibility arising from any reliance placed on the content. Where the content includes any translated material, BMJ does not warrant the accuracy and reliability of the translations (including but not limited to local regulations, clinical guidelines, terminology, drug names and drug dosages), and is not responsible for any error and/or omissions arising from translation and adaptation or otherwise.