Article Text

Abstract
Background Hundreds of thousands of people have been killed during the Syrian civil war and millions more displaced along with an unconscionable amount of destroyed civilian infrastructure.
Methods We aggregate attack data from Airwars, Physicians for Human Rights and the Safeguarding Health in Conflict Coalition/Insecurity Insight to provide a summary of attacks against civilian infrastructure during the years 2012–2018. Specifically, we explore relationships between date of attack, governorate, perpetrator and weapon for 2689 attacks against five civilian infrastructure classes: healthcare, private, public, school and unknown. Multiple correspondence analysis (MCA) via squared cosine distance, k-means clustering of the MCA row coordinates, binomial lasso classification and Cramer’s V coefficients are used to produce and investigate these correlations.
Results Frequencies and proportions of attacks against the civilian infrastructure classes by year, governorate, perpetrator and weapon are presented. MCA results identify variation along the first two dimensions for the variables year, governorate, perpetrator and healthcare infrastructure in four topics of interest: (1) Syrian government attacks against healthcare infrastructure, (2) US-led Coalition offensives in Raqqa in 2017, (3) Russian violence in Aleppo in 2016 and (4) airstrikes on non-healthcare infrastructure. These topics of interest are supported by results of the k-means clustering, binomial lasso classification and Cramer’s V coefficients.
Discussion Findings suggest that violence against healthcare infrastructure correlates strongly with specific perpetrators. We hope that the results of this study provide researchers with valuable data and insights that can be used in future analyses to better understand the Syrian conflict.
- health policies and all other topics
- health systems
Data availability statement
Data are available in a public, open access repository. Data are available upon reasonable request. Data may be obtained from a third party and are not publicly available. The dataset used in our analyses is available at: https://github.com/EastBayEv/syria_overview_bmjgh2021. Given the political sensitivity of the research, information on individual incidents compiled by the research team using open source technology are available upon request to researchers. Data aggregated from third party sources must be requested directly from the source institutions via their websites. Data presented in this study must not be used for commercial gain, nor sold or passed on to any third party without the express written consent of Airwars, Physicians for Human Rights and Safeguarding Health in Conflict Coalition and Insecurity Insight.
This is an open access article distributed in accordance with the Creative Commons Attribution Non Commercial (CC BY-NC 4.0) license, which permits others to distribute, remix, adapt, build upon this work non-commercially, and license their derivative works on different terms, provided the original work is properly cited, appropriate credit is given, any changes made indicated, and the use is non-commercial. See: http://creativecommons.org/licenses/by-nc/4.0/.
Statistics from Altmetric.com
Key questions
What is already known?
There is extensive and compelling evidence demonstrating the violence against civilians and civilian infrastructure in Syria since the conflict started in 2011. Previous research and reports already document the dramatic number of medical facilities that have been attacked by airstrikes in particular.
What are the new findings?
This study collates these data from three sources and presents the first known overview of civilian strikes by describing the relationships between the year, location, perpetrator, weapon and affected infrastructure types. Analyses of these data indicate that, among other correlations, the Syrian government is correlated with attacks that specifically target healthcare facilities, the Russian military is correlated with violence in Aleppo, and the US Coalition is correlated with violence in Raqqa. These results provide epidemiological and data-driven support for empirical evidence of civilian violence.
What do the new findings imply?
The study offers important contributions into how data science methods can be used to analyse complex conflict data. The associations we identified support physical and documentary evidence of civil destruction and underscore that the violence against civilians in Syria is widespread. These data are critical to supporting the Syrian people as they look towards rebuilding health systems, reconstructing civil societies and seeking accountability for violations of international humanitarian law.
Introduction
Violence against civilians remains a frequent aspect of modern conflict despite its short-term and long-term adverse consequences. This violence takes many forms and is often characterised as physical trauma inflicted on individuals but also includes the destruction of civilian infrastructure and non-physical attacks that can disrupt food chains, water and sanitation, communications and social structures that impact the lives, livelihoods, health and welfare of civilian populations. Understanding civilian violence is critical to informing relief efforts, advocating for better policies and protections and for holding parties to the conflict accountable for violations of international humanitarian law (IHL).1 Despite its importance to understanding the scope and scale of a conflict, as well as how to mitigate the trauma, measuring violence against civilians remains challenging. Internationally, despite the obligations of IHL to protect non-combatants and limit civilian harm, there is a limited formal documentation of the obligation of warring parties to measure or report harm they may have caused. The USA, for example, has no robust mechanism to define the civilian impacts of its military actions, measure their occurrence in any transparent way, mitigate harm or compensate the victims—and most other countries are even farther behind in these measures.2
Despite international protections and requirements for proportionality, violence against civilians continues unabated. The experiences of the Syrian people over the past 10 years are perhaps the most notable recent example of catastrophic and complex civilian violence.3–12 Despite its scale and duration, civilian violence in the Syrian war is not well understood and there are no reliable estimates of civilian mortality. Estimates of population movements were limited before the Humanitarian Needs Assessment Programme began in 2016 and the United Nations stopped reporting civilian casualty data early in the conflict.13–15
Civil society groups including the Syrian Network for Human Rights, the Syrian Observatory for Human Rights, and the Violations Documentation Center document civilian harm by providing information about deaths and injuries but these data are limited by population movements, irregular counting on the ground and challenges in verification.16–20 Since civilian casualties are difficult to document, examining damage to civilian infrastructure may act as an important proxy to better understand the scope and scale of the war and its impacts at the community level.21 Several groups are documenting the destruction of water and sanitation facilities, schools, markets and social and religious structures.22–28 Research studies are beginning to evaluate the scope of violence against particular sectors, especially healthcare which has specific protections under IHL.6 29–32 While the data are often patchy and spread across various organisations and databases, many use investigative methods in which user-generated social media or news media reports are scrutinised and collated to identify incidents and, in some cases, verify them with multiple sources (known as open-source intelligence aka OSINT).33 The availability of these resources and the need for more information on civilian violence together present a unique opportunity to explore how civilian infrastructure is attacked in the Syrian context and better understand the characteristics, typologies and implications of the destruction.
One of the better studied types of civilian violence in Syria is that against healthcare facilities, transports, patients and personnel. These attacks are a frequent but often under-reported part of both international and local conflicts across the globe.34–37 Acts of violence against health result not only in loss of life and health services directly due to the violence, but also lead to long-term morbidity and mortality from disrupted health systems, the destruction of facilities, loss of supplies and the shortage of health service providers.38–43 Since the Syrian civil war started in 2011, health services in particular have been victim to hundreds of aerial bombardments.25 Additionally, personnel have been arrested and tortured, ambulances and vaccine convoys looted and destroyed, and patients killed and blocked from access.44–52 While many involved parties, including the governments of Syria, Russia, the USA and multiple non-governmental groups including ISIS, al-Nusra Front and others, are implicated in such violence, by far the vast majority of strikes on health have been publicly attributed to the aligned Russian and/or Syrian government forces.53 54
We aim to better understand civilian violence in Syria through the lens of infrastructure attacks and explore potential relationships between civilian violence and the associated factors of time, governorate, perpetrator and weapon to help expand the available perspectives and methods used for conflict research. We implement a novel dataset compiled from three conflict databases that document violence by international actors and violence against health facilities. In addition to summary statistics, we present multivariate correlations via multiple correspondence analysis (MCA) with squared cosine variable representation measures. To investigate the reliability of the MCA, we also provide k-means cluster classification accuracies (purity scores) of the MCA row coordinates, nested k-fold cross-validated binomial lasso classification with various performance metric evaluations, and Cramer’s V statistics and associated confidence intervals (CIs).
Methods
Dataset
We use data from three databases: Airwars, Physicians for Human Rights (PHR) and Safeguarding Health in Conflict Coalition/Insecurity Insight (SHCC/II) to investigate attacks against different infrastructure categories in Syria. These data were selected based on the following criteria: availability (either publicly available online or via consultation with the organisation), level of specificity to characterise unique incidents and verification procedures for how data were collected and presented. These data contain information about attacks against various governorates, dates, infrastructure types and weapons used along with the perpetrators responsible. We included data from January 2012 through December 2018. Little data were available for later years at the time of this analysis.
Airwars is a non-profit monitoring and advocacy group that tracks and assesses claims of civilian non-combatant casualties from international military actions based on open-source investigations from a wide range of sources as well as military reports.55 Airwars shared data about Russian strikes in Syria beginning on 30 September 2015 through 12 October 2018, and on US-led Coalition strikes from 23 September 2014 to 19 October 2018.55 PHR is a non-profit human rights organisation and has developed a publicly available registry and mapping of attacks on health in Syria since March 2011 using open-source information from press reports and social media corroborated by field sources.25 26 We manually extracted data available on the public online map for this study. For the year 2018, we supplemented this dataset with data that we received electronically from SHCC/II, a coalition that collects and collates data on security incidents in humanitarian settings by collaborating directly with humanitarian and human rights organisations and conducting open-source investigations .23 For its attacks on health data, SHCC/II identified and consolidated data from sources provided by PHR, the Syrian American Medical Society and others.24 28 Airwars’ event-based data is publicly available in incident reports at https://airwars.org along with more detailed methodologies.55 PHR’s incident data is available as brief reports on an interactive map at https://syriamap.phr.org/#/en along with its methodologies.26 SHCC/ datasets on health attacks are available for download on the Humanitarian Data Exchange at https://data.humdata.org/dataset/shcchealthcare-dataset by year.
The dataset is represented by four categorical variables (year, governorate, perpetrator and weapon) along with five binary present/absent variables for infrastructure type (health, private, public, school and unknown) coded as 1 or 0. It contains 2502 rows that contain 2689 total attacks. PHR and SHCC only document attacks on healthcare facilities while Airwars documents civil infrastructure attacks in qualitative incident reports from which the target structure was extracted and classified into one of the category types we developed, a priori. The dataset contains many strikes against ‘Unknown’ infrastructure types, defined as a strike that was recorded by one of the agencies but with undetermined specificity of the locations and degrees of destruction and potentially executed in an indiscriminate manner. The dataset used in our analyses is available online (https://github.com/EastBayEv/syria_overview_bmjgh2021).
Statistical methods
We included a multifaceted statistical framework to investigate characteristics of the types of attacks against the different infrastructure types: summary statistics and visualisations, MCA, k-means clustering of the MCA row coordinates, binomial lasso classification and Cramer’s V statistics. Summary statistics consist of bar plots with the total number of attacks by year, governorate, perpetrator and weapon along with frequencies and proportions for the five different infrastructure categories. All statistical analyses were performed using R V.4.1.0 and the stats package56 along with the others cited later.
Multiple correspondence analysis
MCA is an unsupervised (ie, it does not seek to predict an outcome) dimension reduction and data mining technique to investigate latent structures not readily observable in tabular data. It is similar to principal component analysis but is ideal for nominal categorical data and was thus ideally suited for our dataset. Although strikes were recorded as 1s and 0s, and can be interpreted mathematically as such, they translated to ‘present’ or ‘absent’ categories for the MCA and Cramer’s V analyses.57–60 Abdi and Valentin succinctly summarised MCA:
Correspondence analysis (CA) is a generalization of principal component analysis tailored to handle nominal variables. CA is traditionally used to analyze contingency tables, but is also often used with data matrices that comprise only nonnegative data. CA decomposes the chi-square statistics associated to the data table into two sets of orthogonal components that describe, respectively, the pattern of associations between the elements of the rows and between the elements of the columns of the data table. When the data table is a set of observations described by a set of nominal variables, CA becomes multiple correspondence analysis (MCA).61
We use MCA to distill variation between the different categorical groups within columns of the dataset that can be reinterpreted as single point coordinates along the new linearly combined axes of variation. These coordinates can be plotted to illustrate exploratory relationships that would be otherwise difficult to ascertain and that might not be well suited to significance testing due to their categorical and often imbalanced nature. Squared cosine distance was used to measure the confidence of the point placements in the reduced dimensional space.61 62 This value ranges between 0 and 1 and the larger the squared cosine value the more confident we are about a particular point’s placement, as Rodriguez-Sabate and colleagues explained:
The quality of a variable (cosine2) represents the distribution of the inertia of this variable across dimensions (normalized between 0 and 1 which represents the whole inertia of the variable; a value lower than 0.1 indicates a poor representation of the variable in the computed dimensions). The term cosine-squared refers to the fact that this value is also the squared cosine value of the angle the point makes with the specific dimension (it may also be interpreted as the correlation of the respective point with the respective dimension) … Eigenvalues represent the relative relevance of each dimension to the total inertia (it is normalized to 1 which represents all the information of all the variables in all the dimensions). The highest eigenvalue was always in the first dimension, progressively decreasing across the following dimensions.63
Inertia is the total variation within the dataset and a scree plot is traditionally used to examine which reduced dimensions of variation to include in analyses. We focus exclusively on the first and second dimensions because variation was more evenly dispersed across the many remaining dimensions. This is not to say that other relationships do not exist in the other remaining dimensions, so we also provide a figure that provides squared cosine values across the first 20 dimensions. However, interpreting results of unsupervised techniques such as the MCA is challenging. It is hard to be sure if point locations are the result of the nature of the dataset itself, its highly dispersed, sparse and categorical nature, and/or imbalanced class distributions. To gain a better understanding of the results we also implement purity scores across multiple k-means clusters on the row coordinates from the MCA to examine classification accuracy of the different variables, binomial lasso classification to look at related variables for predicting attacks on healthcare infrastructure, and Cramer’s V statistics to try and better understand the relationships illustrated by the MCA. MCA was coded using the FactoMineR, factoextra, corrplot and ggplot2 packages.58 60 64–66
k-means clustering
We perform clustering on the row coordinates produced by the MCA. k-means clustering is an approach to divide row observations into smaller and smaller subsets of like types to form point clusters based on their shared distances to the centre of a cluster, called a centroid. The goal of this algorithm is to find groups in the data, with the number of groups represented by the variable k. k-means clustering requires the user to specify the number of clusters and eight was the optimal number of clusters based on the silhouette method (binary distance dissimilarity measure and k-means analysis method).67 Cluster homogeneity was evaluated using the purity score, an external evaluation metric for assessing cluster classification accuracy, for two through nine clusters.68
Binomial lasso classification
We then focused specifically on the potential validity of attacks against healthcare because of their far-reaching and devastating impacts on civilian life. We used binomial lasso classification (least absolute shrinkage and selection operator, a form of penalised regression) to predict whether or not a strike occurred against civilian healthcare infrastructure in Syria.69 Lasso penalises the beta coefficients to zero for independent variables that are not related to the outcome, thus removing them from the model and ostensibly producing a model with less predictors that is easier to interpret. In our case, the outcome is binomial because we predict whether or not a strike occurred against healthcare infrastructure.
Like other supervised machine learning algorithms (ie, ones that seek to predict an outcome variable), binomial lasso classification relies on data splitting procedures to assess model performance. In the simplest cases, data are divided into training and test sets. Normally this entails partitioning a (often majority) portion of the original data into the training set so that the algorithm can build a model that learns the relationships between the outcome (in our case whether a healthcare facility was struck or not) and the characteristics of the other independent variables as predictors. Performance is evaluated through confusion matrix derivation metrics such as classification accuracy, sensitivity, specificity, precision, false discovery rate and so on. Then, the trained model is applied to the remaining portion of the withheld/test data, in order to predict the outcome on data that the model has not yet seen. In this manner, the algorithm can be used to evaluate how well the trained model could learn not just the relationships in the known data but also predict unknown outcomes and generalise to new data without knowing the ground-truth labels in advance.
Performance of the lasso model was evaluated using a variety of metrics based on nested 20-fold cross-validation, which repeats the train/test splitting process described above 20 times in a stratified manner and that rotates different portions of the data for training and testing to ensure that all observations are part of a test set at least once.70 The lasso allows for further utility through model selection. A model can be selected by choosing values of lambda from the ordinary least squares solution that includes coefficients for all independent variables, to a simpler model that includes only the non-zeroed-out coefficients, but that is within one standard error of the minimum error value.
To account for potential imbalance between attacks on healthcare (601 instances) versus non-healthcare attacks (2088 instances), we calculated area under the curve-receiver operator characteristic (AUC-ROC). We also oversampled the data so that the number of attacks against healthcare were approximately the same as the number of non-healthcare attacks through generation of ‘synthetic positive instances using ADASYN algorithm. The number of majority neighbors of each minority instance determines the number of synthetic instances generated from the minority instance’71 and fit the algorithm a second time using the mikropml R package72 to produce 15 additional performance metrics for comparison with the original model. For both fitting processes, the categorical variables year, governorate, perpetrator and weapon were one hot encoded to indicator variables; the five infrastructure type variables were already represented by 1s and 0s and represented categorically to indicate if a strike was recorded as present or absent, respectively.
Cramer’s V
Finally, we measured the strength of associations between the columns of the dataset via Cramer’s V coefficient (phi or ϕc). This value ranges between 0 and 1 and is similar to a χ2 test of independence for effect size but is interpreted like a correlation coefficient for large tables.73 Values of 0–0.30 indicate a weak correlation, 0.30–0.70 indicate a moderate correlation and 0.70–1.00 indicate a strong correlation. Confidence intervals were computed using non-central χ2 method at 95% confidence.
Cramer’s V statistics were calculated using the DescTools R package.74
Results
The US Coalition, Russian military and the Syrian government account for perpetrating 2446 out of 2689—or 91%—of the attacks in the dataset. Barplots showing total number of attacks by year, governorate, perpetrator and weapon are shown in figure 1. Frequencies and proportions of infrastructure attacks by year, governorate, perpetrator and weapon are presented in table 1. The sum of each infrastructure type column by the four row subgroups (year, governorate, perpetrator and weapon) all sum to the same values shown in the Total and Total of proportion rows, thereby contributing to the same overall percentages of the 2689 strikes although the frequencies vary by the four row subgroups. Unknown infrastructure types were the most frequently struck (37%), followed by health (22%), public (20%) and private (18%) types. Schools (3%) were targeted much less often based on these data.
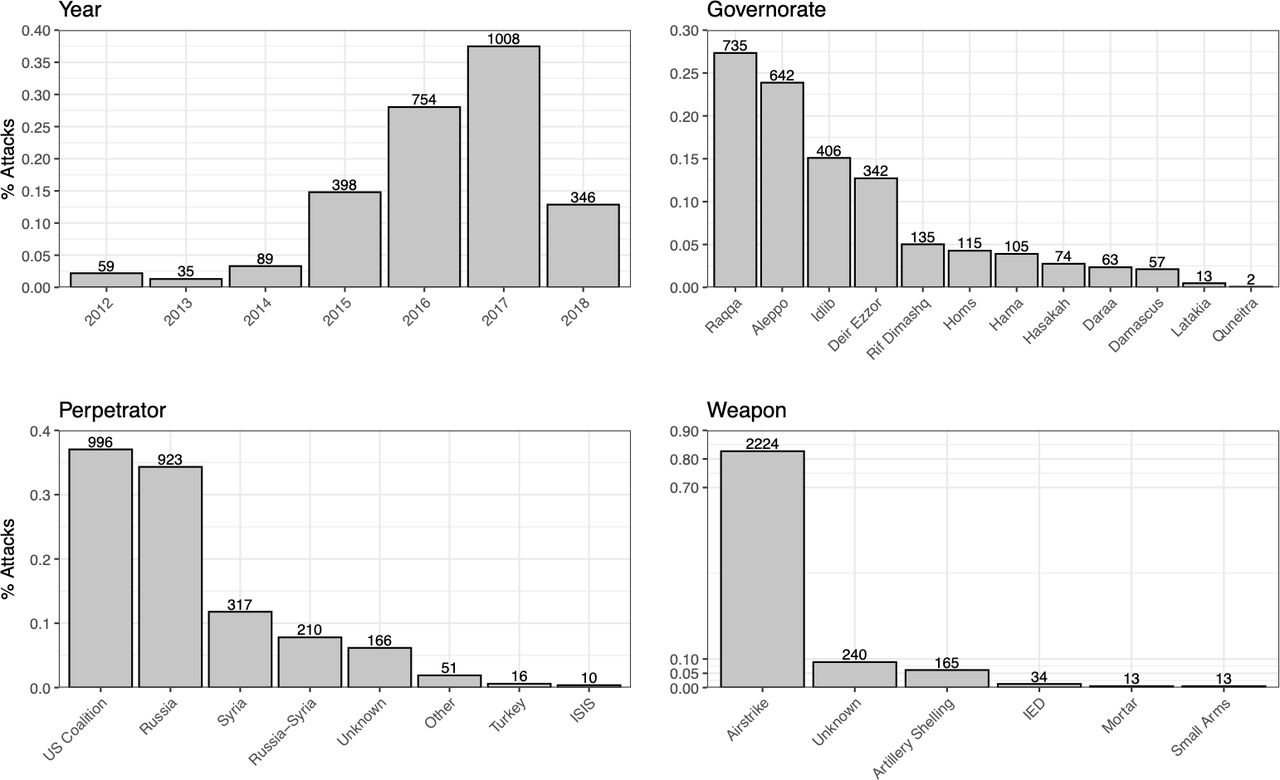
Barplots showing total number of attacks by year, governorate, perpetrator and weapon. Category is shown on the x-axis and percentage of total attacks is shown on the y-axis. Attack frequency is the number on top of each bar.
Affected infrastructure type by year, governorate, perpetrator and weapon, 2012–2018
The row totals provide an informative glimpse into the distribution of these attacks on civilian infrastructure. According to these data, 15% and 28% of attacks occurred during 2015 and 2016, respectively, as the conflict was escalating. Thirty-seven per cent of attacks occurred during 2017, the height of the conflict, and followed by 13% of attacks in 2018. By governorate, the hardest hit were Raqqa (27%), Aleppo (24%), Idlib (15%) and Deir Ezzor (13%), with the other governorates being struck less than 10% of the time. Furthermore, the US Coalition was reportedly responsible for 37% of these attacks, while Russia was responsible for 34%, Syria for 12%, and the Russia–Syria Coalition responsible for 8% of attacks; the other perpetrators were responsible for less than 8% of attacks. Airstrikes were the overwhelming method of violence employed and were used for 83% of strikes.
Multiple correspondence analysis
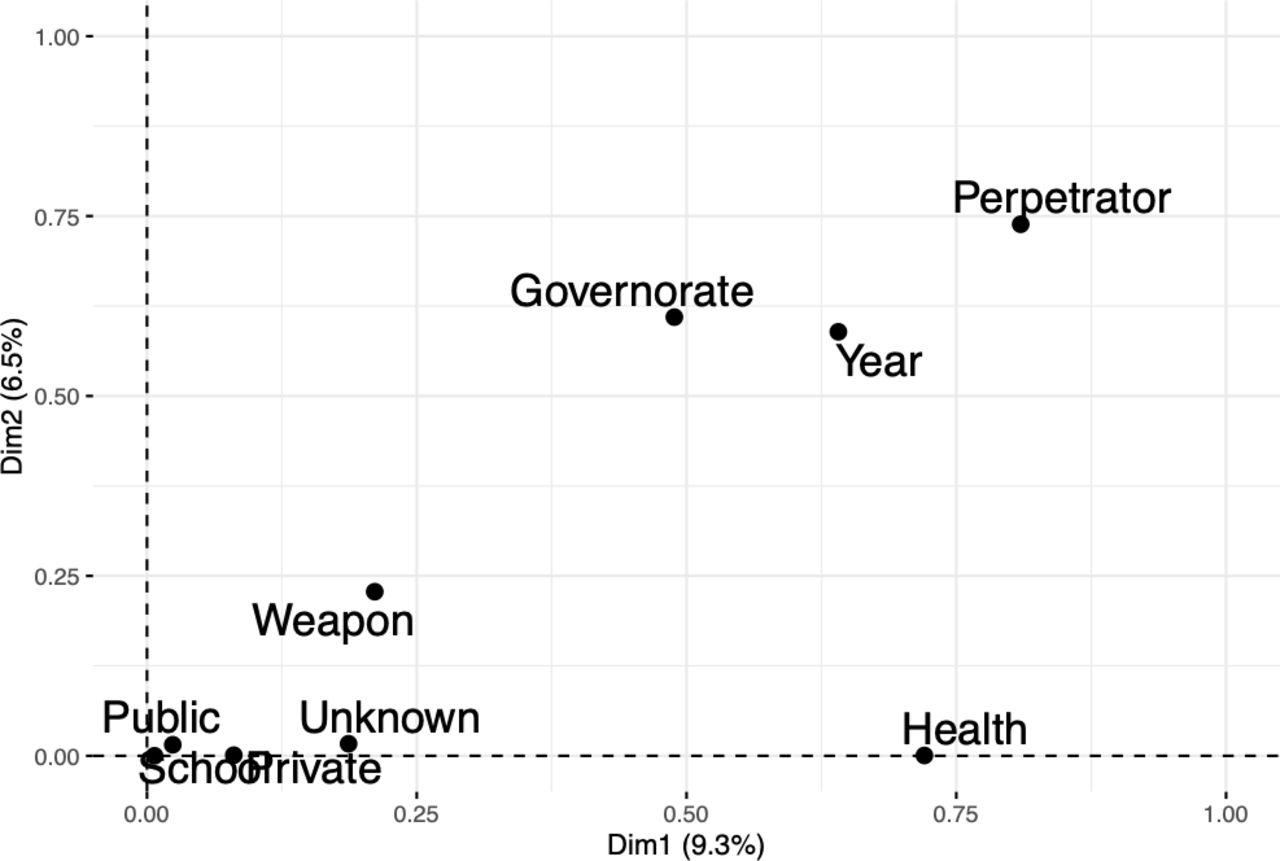
A multivariate view elucidates additional patterns in these data. The first two dimensions of variation from MCA analysis contain 9.3% and 6.5% of variation explained, respectively. Relationships between the nine variables in the dataset are shown in the MCA variable plot in figure 2. This figure shows that governorate, year and perpetrator contribute most to variation along the x-axis and y-axis together, while health infrastructure contributes to variation only along the x-axis. Weapon contributes considerably less to variation along both axes, while unknown infrastructure type contributes only slightly along the x-axis.

Multiple correspondence analysis variables plot to illustrate the relationships of the variables from the dataset along the first two dimensions of variation.
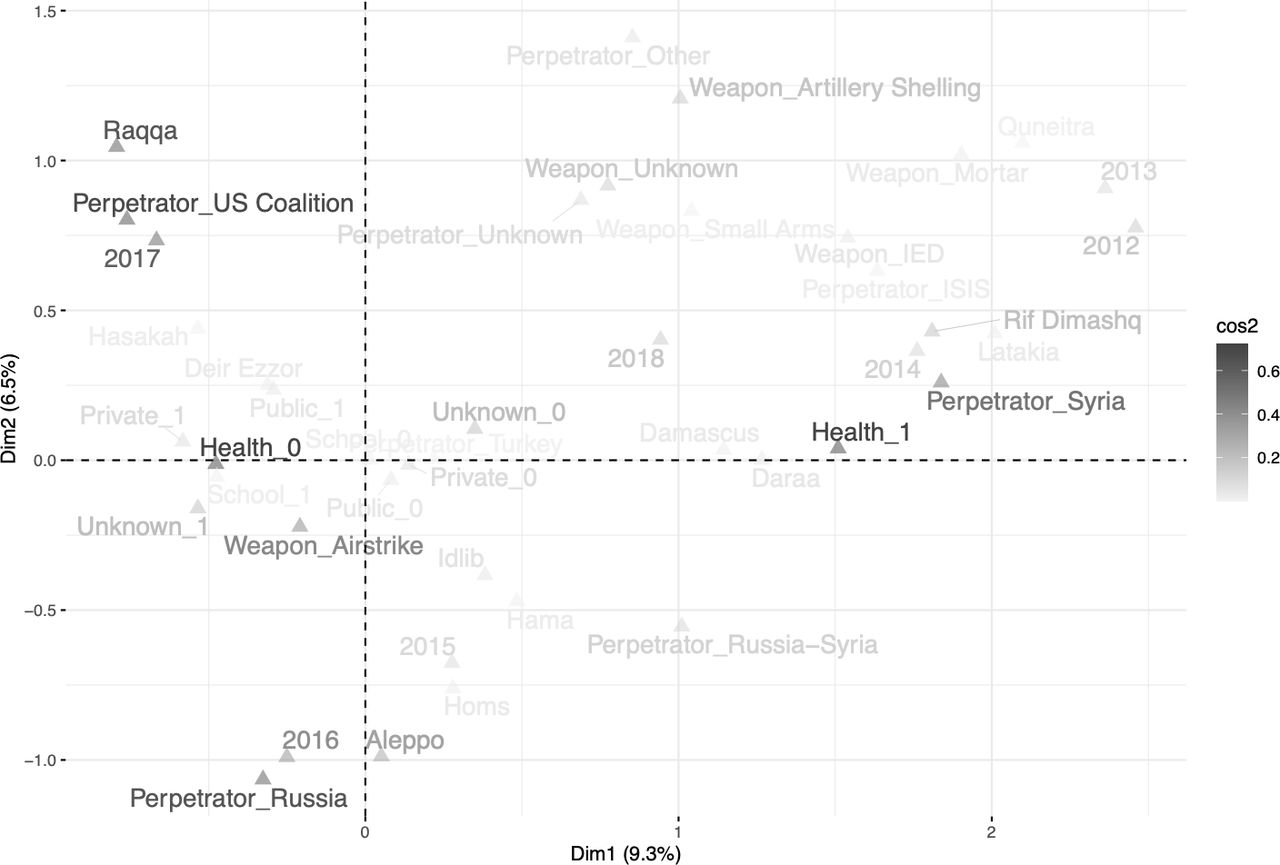
More profound relationships between year, governorate, perpetrator and affected infrastructure type are shown in figure 3. For a particular infrastructure type, a ‘1’ indicates that this infrastructure class was targeted and a ‘0’ means it was not targeted (eg, ‘Health 1’ vs ‘Health 0’, ‘School 1’ vs ‘School 0’, etc). Here, the closeness of the text demonstrates the degree of association between the variables, while the colour of the text indicates confidence in their placement with darker text representing greater confidence as measured by squared-cosine similarity. Four topics of interest emerge: (1) US Coalition led strikes against Raqqa in 2017 (upper-left portion of the plot), (2) Russian campaigns in Aleppo in 2016 (bottom left), (3) Syrian government attacks against healthcare facilities (right side) and (4) airstrikes across non-health infrastructure (left side). Interestingly, attacks attributed to the Russia–Syria Coalition are found in between the perpetrators Russia and Syria in the lower-right portion of the plot, although with lesser confidence. Variable representation quality for 20 axes of variation from the MCA is shown in figure 4. Larger and darker circles indicate a higher squared cosine value along that axis.
k-means classification

Multiple correspondence analysis squared cosine distance (cos2) plot. Very high confidence of point placement is labelled with darker text, high confidence placement with grey and moderate confidence with light grey text. Note disparate locations of whether healthcare was attacked (Health 1) or not (Health 0) along the x-axis.
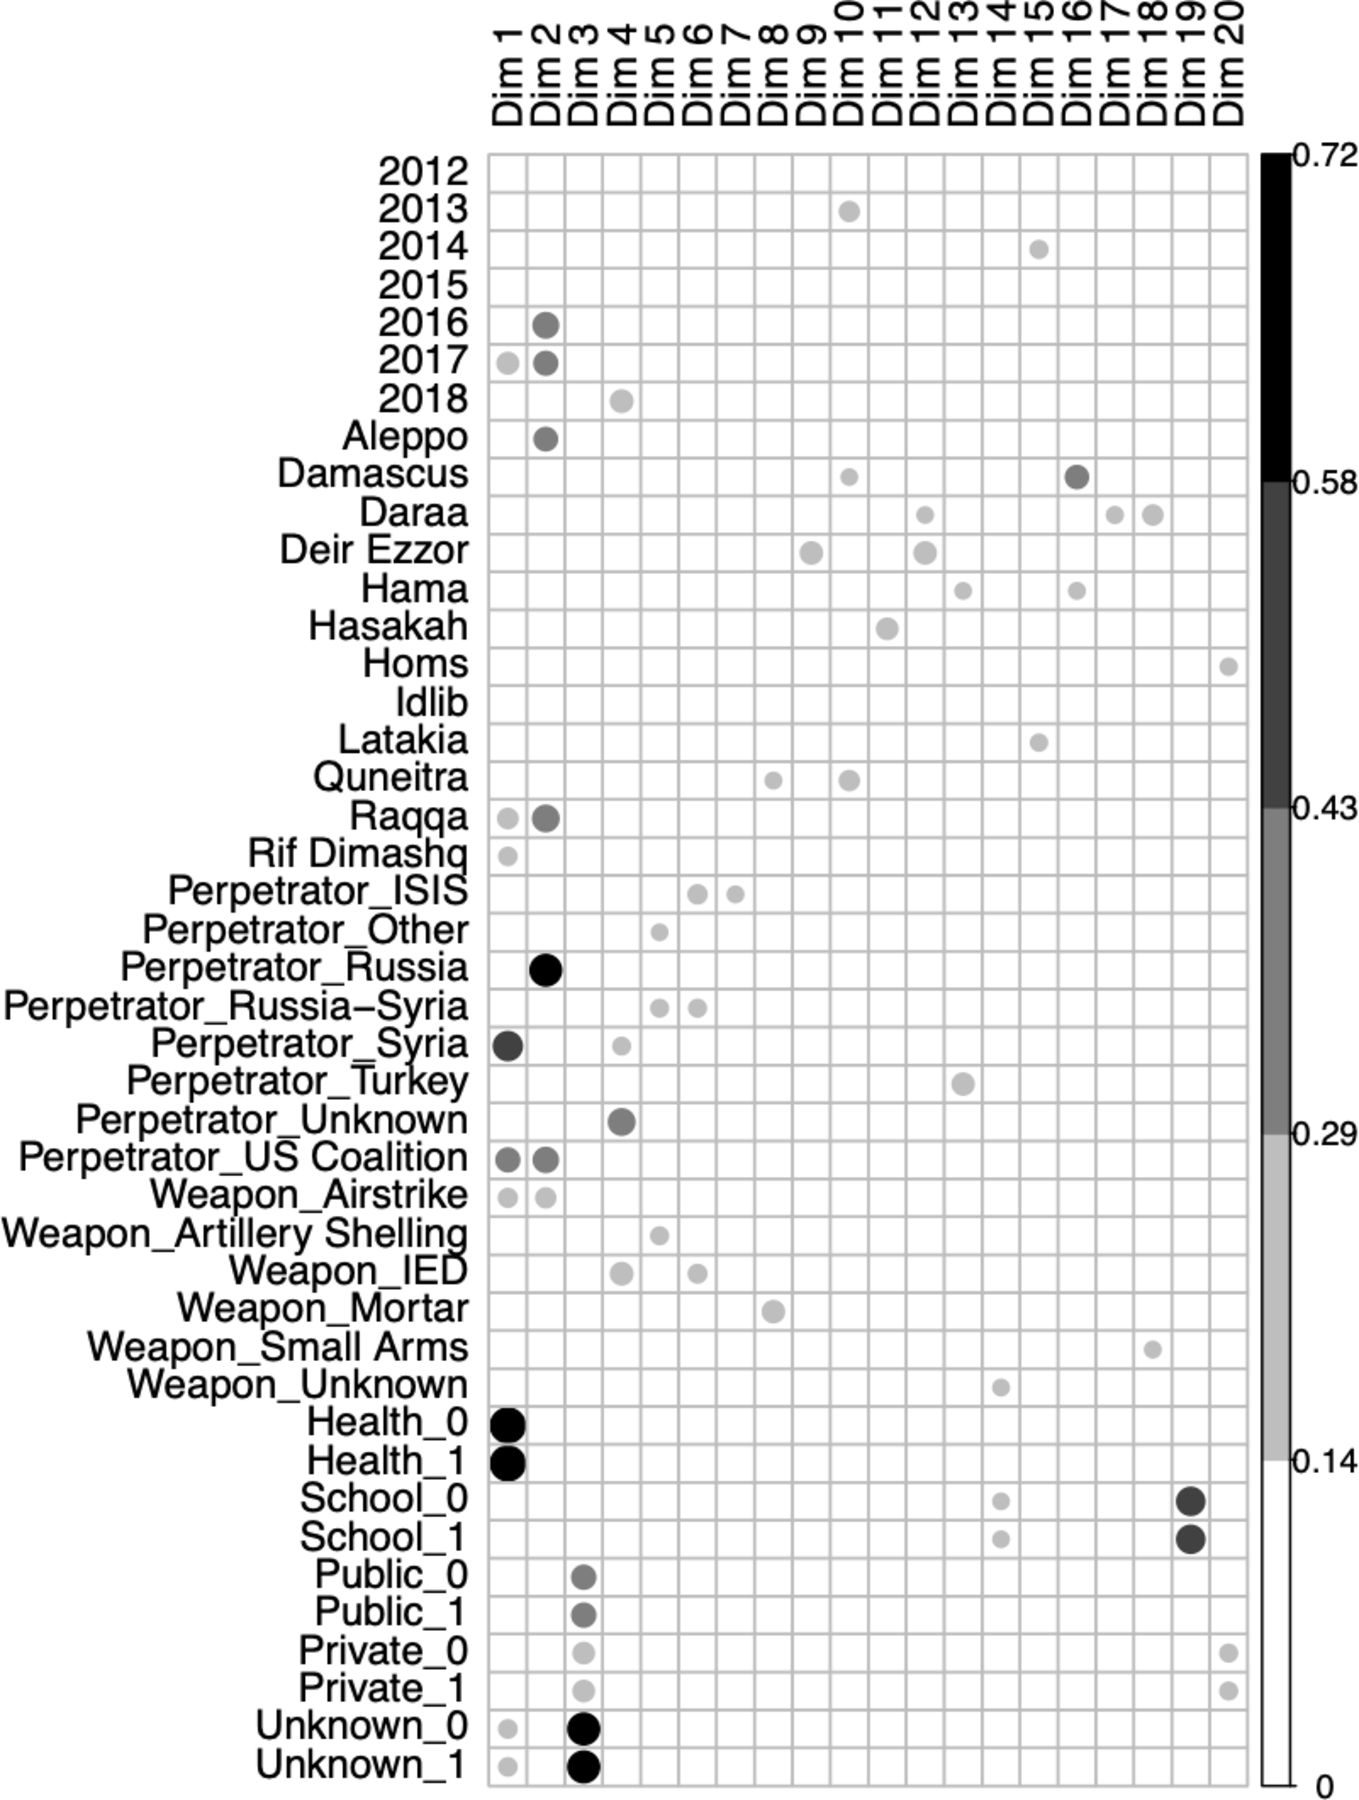
Squared cosine distance plot showing degree of representation for all variable categories across 20 axes of variation defined by the multiple correspondence analysis. Larger and darker circles indicate better variable representation on that particular axis.
Results of the k-means cluster purity scores show that the school variable had the highest mean classification value (0.97), followed by health (0.92), weapon (0.84), private (0.81) and perpetrator (0.81). Public, unknown, year and governorate all have scores lower than 0.80. Overall, these mean scores are similar to the ones shown for the supposed optimum number of eight clusters (table 2). These scores suggest that several variables in the data, including attacks against healthcare, cluster similarly even when parameters are modified.
k-means cluster purity scores (classification accuracies) for varying numbers of clusters (2 through 9) based on row coordinates produced by multiple correspondence analysis
Binomial lasso classification
AUC-ROC=0.985 for the most regularised lasso model with nested 20-fold cross-validation that is within one SE of the minimum (lambda=0.054, log lambda=−2.923). AUC-ROC=0.972 for prediction for the holdout/test dataset (750 randomly selected observations from the original dataset). Absolute values for the simplest model within one SE of the minimum contained seven non-zero coefficients (out of the 43 total) and are shown in table 3. Attacked unknown, public and private infrastructure types have the highest coefficients, followed by perpetrators Syria, Russia–Syria Coalition and US Coalition. One thousand eight hundred and seventy-seven synthetic attacks against healthcare (compared with the actual 601) were used for the balanced comparison against the actual 1901 attacks not against healthcare infrastructure in the oversampled data cross-validated lasso model. Performance metrics for this second model are found in table 4. The binomial lasso classification models suggest that certain infrastructure types and specific perpetrators tend to characterise attacks on healthcare.
Non-zero coefficients for the one SE nested cross-validated lasso model
Performance metrics for the adaptive synthetic (ADASYN) oversampled cross- validated lasso model for attacks on healthcare
Cramer’s V
Cramer’s V coefficients and confidence intervals are shown in table 5. The coefficient is displayed in the upper triangle. Coefficients greater than 0.30 are denoted in bold text to indicate a moderate or strong correlation. Their CIs are shown in the lower triangle; grey shading indicates a CI for a moderate or strong coefficient from the upper triangle. Of the 36 total pairwise comparisons, 24 are weak, 11 are moderate, 1 is strong. Perpetrator correlates strongly (V=0.75) with attacks against health infrastructure, while attacks on health infrastructure correlate moderately with year (V=0.56) and governorate (V=0.46). Unknown infrastructure type correlates with a few of the other variables but is difficult to interpret due to its unknown nature.
Cramer’s V coefficients and CIs for correlations between variables in the dataset
Discussion
This exploratory study illustrates the potential of conflict data, both publicly available and collected and shared by non-profit organisations, to contribute to the evidence base of civilian harm and on violations of IHL in times of conflict. Through the presentation of novel, aggregated data specifically about attacks on civilian infrastructure and violence against healthcare in the Syrian civil war, we provide a new lens on the many incidents that caused grave civilian harm and profound disrespect for principles of proportionality and protection of civilians enshrined in IHL. As data collection in conflict settings advances across the globe, standards for data collection and coordination must be strengthened to fully leverage the promise of data science methodologies for analysis of conflict data. This study underscores several correlations of interest, particularly that the Syrian and/or Russian governments are primarily responsible for the majority of attacks against health in Syria (81%). These findings highlight that these strikes may not simply be the collateral impact of modern conflict or of civilian strikes.
Importantly, visualising conflict data in multidimensional space through unsupervised, exploratory methods such as MCA is useful to gain high-level clarity of variables of interest. In this manner, the human eye can potentially better understand the many complicated relationships from war contexts in effective and preattentive ways that might be missed by both univariate and more complex modelling approaches. The four topics of interest identified by the MCA squared-cosine plot (figure 3) support previous findings that the Syrian government is largely responsible for strikes on healthcare facilities in their own country as well as links between the Syrian and Russian governments to attacks on Syrian health infrastructure.32 75 76 While many of these initiatives used analysis of detailed information regarding a single or several specific instances of violence, the aggregated data used in this study strongly supports these assumptions. Recent research and human rights reporting present findings consistent with those in this analysis: that violence against healthcare has been significant in the Syrian conflict, and that the vast majority of airstrikes on health facilities were perpetrated by Syrian government and Russian military forces. PHR and Human Rights Watch investigations point to Syrian and Russian government forces in eye-witness testimony77–79 and several open-source investigations verify claims of Russian involvement in airstrikes in Syria.80 With regard to US-led Coalition strikes on civilians in Raqqa in 2017, Amnesty International has detailed how the coalition conducted its air campaign in 2017 to oust Islamic State from its de-facto capital, resulting in thousands of civilian deaths.45
Results of statistical analyses support these assertions, especially for attacks against health. First, MCA offers an overview into the multivariate correlations of the variables in the data. Notably, it reveals that while perpetrator, year and governorate have strong discriminatory power along the first two dimensions of variation, health is only discriminatory along the first dimension (figure 3). Furthermore, we see attacks against health (Health_1) and the state actor (Perpetrator_Syria) not just closely aligned in the positive direction of the first dimension in, but also with high confidence in their placement as represented by the squared cosine score to indicate the appropriateness of this relationship. This can also be roughly understood from the summary statistics in table 1. Second, support is offered by the k-means cluster accuracy scores in table 2, which indicate that perpetrator clusters at 0.88 accuracy at the optimal eight number of clusters (along with a 0.81 mean score). Here, only School (0.97) and Health (0.92) have higher accuracies for the eight cluster model. Third, binomial lasso classification indicates that whether or not healthcare was attacked is readily predictable, but that using a penalised model highlights variables that are most related to the outcome as shown in table 3. Importantly, we see that struck unknown, public and private infrastructures correlate the most with affected health infrastructure, followed closely by the Syrian government, the Syria–Russia Coalition and the US Coalition and suggests that these variables are strongly tied to attacks on health. Finally, the lone strong Cramer’s V coefficient (V=0.75) in table 5 is found between health infrastructure and perpetrator. It is difficult to ascertain how attacks against unknown infrastructure types might influence correlations between perpetrator and attacks against known infrastructure.
In September 2015, the Russian government approved a request to begin airstrikes in Syria and these first instances of Russian strikes appear in our dataset in September 2015.81 Ultimately, in December 2016, the Russian-backed Syrian government fully recaptured Aleppo from the opposition.55 82 Russian involvement in the air campaign to assist the Syrian government in retaking Aleppo during 2016 is also well-documented.55 Our results also ostensibly confirm that Russian government forces conducted direct airstrikes on Syrian soil, in addition to militarily and financially supporting the Syrian government, which carried out its own strikes. Our findings represent the first attempt to quantify how much infrastructure has been destroyed with prejudice across Syria. While much of the attention has, for good reason, focused on the protection of health, the destruction of life and other infrastructure (eg, water/sanitation and power facilities, rail, roads, parks, ports, telecommunications, religious, cultural, and entertainment facilities, and schools) potentially highlights the systematic and catastrophic breakdown of the social order.83 These areas of civilian violence require more documentation and analysis. Although the US Coalition is responsible for just 4% of attacks against health, it is important to note that it is responsible for 37% of all attacks in our dataset. Finally, the destruction of non-health infrastructure across Syria during the conflict is well-documented in numerous reports.32 84 85
This research supports the voices of many human rights advocates that contend violence against civilians in Syria must be investigated under the Rome Statute of the International Criminal Court’s definitions of war crimes and crimes against humanity. The frequency of strikes on health, and the strength of correlation of the perpetrators of this violence, does not provide hard evidence of strategic violence but does suggest that there are temporo-spatial relationships between the perpetrators and type of infrastructure that was afflicted. While violations of IHL are typically seen through a legal and case-by-case lens, the statistical analyses used in this study can be a valuable tool to highlight the value of data analysis of aggregate data on many incidents for the protection of human rights. Triangulating these data with witness and documentary evidence can strengthen calls for accountability and support for victims. Stronger data collection protocols and transparency of air and ground strikes by all actors would allow for stronger methodologies to provide more opportunities to identify trends and correlations among conflict indicators.
Limitations
Data limitations
We acknowledge that this initial exploratory study has significant weaknesses. Most importantly, key parts of conflict data are missing from our analysis because these data are not publicly available and accessible by researchers. These include, but are not limited to, ground strikes against non-health infrastructure and airstrikes perpetrated by non-international actors. Hopefully, organisations that already collect these data can share their methodologies and/or be given more resources to expand their scope of purpose to include data on additional indicators (ie, ground strikes, local armed groups, conflict timelines, local perceptions of events, etc). Augmenting the data collected in conflict in such ways will be an important next step in this sector. Furthermore, especially during a war, extracting complex qualitative information into categorical data designed for statistical analysis can never fully capture the true complexity of a conflict and the dynamic interplay between the myriad factors and variables at play. We hope that this information will be of use to other researchers for more complex and nested analyses to investigate certain components of conflict that are not directly visible.
Additionally, our multi-organisation dataset depends on the work of data collectors and personnel at civil society institutions, sometimes at great personal risk. The intrinsic limitations and potential inaccuracies of the various organisations’ methodologies are embedded in our data and collaboration with additional organisations could augment the research in more informative ways. Collating, cleaning and deduplicating data that came with differing details and methodologies was challenging and also potentially introduced error. Additionally, our analyses included data that was sent to us by various organisations updated up to April 2019. Some incident information that was added to publicly available databases after that date is not in our analysis and should be used for further research.
Statistical limitations
Results were impacted by biases from the framing of our study itself, potential class imbalances in the data, and the statistical methods chosen for analysis. Historical and representation biases are hard to truly ascertain, especially because data collection in conflict settings can be dangerous. The challenges of data collection in such scenarios thus impact analysis, interpretation and the conclusions able to be drawn. First, computation of summary statistics will be biased based on the impossibilities of on-the-ground data collection in war zones. This is inevitable due to the lack of support that these agencies receive and again underscores the need for more urgency around data collection protections and safety. Second, these biases will also produce potentially deceptive correlations as identified by MCA and Cramer’s V. It is important to understand where in the dataset sparsity occurs and why; in conflict it is difficult to discern if data are missing completely at random (that it is a random missing subset of the larger dataset, data generative process or data ecosystem) or missing conditionally at random (that it is missing based on conditional relationships with other variables) versus unrecorded/not able to be recorded. Two variables in our dataset—year and unknown infrastructure type—might be particularly susceptible to this. The positively skewed number of attacks by year could potentially provide false discriminatory power. However, when removed from the analysis results did not change considerably and were thus left in to provide the reader with a temporal component that would not exist if it were removed. Only those collecting data within the wars themselves have the ability to better speak about these endeavours, and must continue to be an integral part of the research process.
Finally, the impacts on exploratory analysis will permeate any validation technique if distorted baseline measures are present. In the case of lasso classifications that can produce sparse solutions (ie, only a few variables from the dataset are actually used in the model to predict the outcome), the emphasis on interpretation of the non-zero coefficients could be misleading. Or, the coefficient for a particular independent variable might be removed not because it is unrelated to the outcome, but potentially because it is correlated with another independent variable whose coefficient was penalised and removed. However, we feel that lasso is better suited for this type of analysis compared with multinomial logistic regression because the latter is more likely to poorly model the tails of the distribution. However, other dimension reduction, clustering and machine learning techniques should be incorporated to continue to better understand the human impact of conflict data.86 87
Conclusions
This study underscores the alarming number of incidents that impacted civilians in Syria from January 2012 through December 2018 and provides further evidence of the grave nature of civilian harm and destruction of infrastructure—and more specifically, health systems—in Syria. The findings support growing calls for investigation of and accountability for war crimes by the UN Security Council and International Criminal Court and International Court of Justice. Our research highlights the potential for other correlated factors in the Syrian conflict—especially between perpetrators and strikes on health. Our results emphasise the need for more reliable data collection, data accessibility, and better cross-agency collaboration to document more accurately and consistently these acts of violence. Future data science research should continue to include more complex statistical modelling when more informative data become available. Additionally, it is unclear how reliable correlations of health, school, private and public infrastructure are to the vague ‘Unknown’ category.
While it is unknown whether or how data analyses such as those reported in this paper could influence legal accountability mechanisms, the direct evidence from interviews, physical evidence and documentation, embedded in each attack analysed in this work combined together, provides a trove of evidence. The findings of this research may strengthen the overall claims regarding the attacks, the perpetrators and the trends. In addition to the data we report on, we hope that the novel methods contributions of this study have a lasting effect on understanding conflict and its consequences. Funders should better support additional data collection as well as better coordination among civil society initiatives and militaries to create well-designed, transparent and robust databases that foster more collaboration and analysis.
Data availability statement
Data are available in a public, open access repository. Data are available upon reasonable request. Data may be obtained from a third party and are not publicly available. The dataset used in our analyses is available at: https://github.com/EastBayEv/syria_overview_bmjgh2021. Given the political sensitivity of the research, information on individual incidents compiled by the research team using open source technology are available upon request to researchers. Data aggregated from third party sources must be requested directly from the source institutions via their websites. Data presented in this study must not be used for commercial gain, nor sold or passed on to any third party without the express written consent of Airwars, Physicians for Human Rights and Safeguarding Health in Conflict Coalition and Insecurity Insight.
Ethics statements
Patient consent for publication
Ethics approval
No identifying or personal information was obtained for this study and all information is aggregated at the governorate level by year to avoid disclosure of vulnerable data. This study was reviewed and exempted by the University of California, Berkeley’s Institutional Review Board. Data from Airwars and SHCC/II were generously shared and the organisations contributing these data consented to the analysis and publication. PHR data were extracted from the public site. Of note, data shared by Airwars were a one-time snapshot and additional revisions/amendments that may be available on the Airwars site are not part of our dataset. Per our data guidelines, data presented in this study must not be used for commercial gain, nor sold or passed on to any third party without our express written consent.
Acknowledgments
We especially acknowledge the Syrian health workers, first responders, humanitarian actors and advocates on the front lines of this conflict who go unnamed but not unappreciated. We also thank Chris Woods of Airwars, the MENA research team at Physicians for Human Rights, Christina Wille and Helen Buck of Insecurity Insight and Safeguarding Health in Conflict Coalition for providing access to the data. Jae Yeon Kim provided helpful advice about CI calculations for the Cramer’s V statistics. Sayaka Ri assisted with extraction of data from PHR’s online interactive map. We thank the Human Rights Center at UC Berkeley’s Open Source Investigation lab students for conducting data extraction. We also thank Stephanie Croft, Alexa Koenig, Andrea Lampros and Félim McMahon at UC Berkeley for feedback, guidance and review on open-source investigations. We thank Hazem Rihawi, Diana Rayes, Naser AlMhawish and Ahmad Tarakji for sharing their knowledge and experience about Syria and contextualising this work. We are grateful for the two anonymous reviewers who helped us considerably improve the quality of this manuscript.
References
Footnotes
Handling editor Seye Abimbola
Twitter @rohinihaar
Contributors LSR and RJH conceived of the project. BP led the data collation and extraction. EM conducted the analysis. EM and BP wrote the draft. RJH and LSR reviewed the draft. All authors reviewed and approve of the final manuscript.
Funding The authors have not declared a specific grant for this research from any funding agency in the public, commercial or not-for-profit sectors. Publication made possible in part by support from teh Berkeley Research Impact Initiative (BRII) sponsored by the UC Berkeley Library.
Competing interests None declared.
Patient and public involvement Patients and/or the public were not involved in the design, or conduct, or reporting, or dissemination plans of this research.
Provenance and peer review Not commissioned; externally peer reviewed.