Article Text

Abstract
Introduction Cardiovascular disease (CVD) risk factors are increasing in sub-Saharan Africa. The impact of these risk factors on future CVD outcomes and burden is poorly understood. We examined the magnitude of modifiable risk factors, estimated future CVD risk and compared results between three commonly used 10-year CVD risk factor algorithms and their variants in four African countries.
Methods In the Africa-Wits-INDEPTH partnership for Genomic studies (the AWI-Gen Study), 10 349 randomly sampled individuals aged 40–60 years from six sites participated in a survey, with blood pressure, blood glucose and lipid levels measured. Using these data, 10-year CVD risk estimates using Framingham, Globorisk and WHO-CVD and their office-based variants were generated. Differences in future CVD risk and results by algorithm are described using kappa and coefficients to examine agreement and correlations, respectively.
Results The 10-year CVD risk across all participants in all sites varied from 2.6% (95% CI: 1.6% to 4.1%) using the WHO-CVD lab algorithm to 6.5% (95% CI: 3.7% to 11.4%) using the Framingham office algorithm, with substantial differences in risk between sites. The highest risk was in South African settings (in urban Soweto: 8.9% (IQR: 5.3–15.3)). Agreement between algorithms was low to moderate (kappa from 0.03 to 0.55) and correlations ranged between 0.28 and 0.70. Depending on the algorithm used, those at high risk (defined as risk of 10-year CVD event >20%) who were under treatment for a modifiable risk factor ranged from 19.2% to 33.9%, with substantial variation by both sex and site.
Conclusion The African sites in this study are at different stages of an ongoing epidemiological transition as evidenced by both risk factor levels and estimated 10-year CVD risk. There is low correlation and disparate levels of population risk, predicted by different risk algorithms, within sites. Validating existing risk algorithms or designing context-specific 10-year CVD risk algorithms is essential for accurately defining population risk and targeting national policies and individual CVD treatment on the African continent.
- cardiovascular disease
- epidemiology
- hypertension
- community-based survey
This is an open access article distributed in accordance with the Creative Commons Attribution Non Commercial (CC BY-NC 4.0) license, which permits others to distribute, remix, adapt, build upon this work non-commercially, and license their derivative works on different terms, provided the original work is properly cited, appropriate credit is given, any changes made indicated, and the use is non-commercial. See: http://creativecommons.org/licenses/by-nc/4.0/.
Statistics from Altmetric.com
Key questions
What is already known?
African countries continue to undergo distinct epidemiological transitions, marked by increasing levels of cardiovascular disease (CVD).
Numerous CVD risk algorithms have been developed to estimate 10-year CVD risk using known CVD risk factors, with few studies exploring the application of these algorithms in contrasting settings on the African continent.
What are the new findings?
Estimated overall 10-year CVD risk for all participants ranged from 2.6% to 6.5%, depending on the algorithm used, and was higher in men than in women.
A greater magnitude of risk factors and higher 10-year CVD risk were found in both rural and urban South Africa compared with the east and west African sites.
Levels of 10-year CVD risk varied by algorithm, with little agreement and poor correlation between algorithms within sites, and significant differences in correlation between sites.
What do the new findings imply?
Existing 10-year CVD risk algorithms need to be carefully validated, or recalibrated, to determine both individual and population level 10-year CVD risk specific to particular African environments.
Failure to apply the appropriate algorithm for the context will likely result in off-target policy, unnecessary cost and incorrect targeting of individuals for treatment.
Introduction
It is estimated that the number of people on the African continent over the age of 65 years will be more than triple from 31.9 million in 2019 to 101.4 million by 2050.1 One consequence of this demographic transition is an increase in the burden of non-communicable diseases (NCDs), estimated to result in 73% of all deaths globally.2 In 2017, cardiovascular diseases (CVDs) accounted for 43% of NCD deaths, or 17.8 million deaths worldwide,2 with 75% of the global deaths due to CVD found in low/middle-income countries (LMICs).3 Much of this burden is a consequence of the rising prevalence of modifiable risk factors, with 2017 Global Burden of Disease (GBD) reporting that half of all deaths globally can be attributed to four risk factors: hypertension, high blood glucose, smoking and high body mass index (BMI).4 In Africa, less is known and more needs to be done to understand the epidemiology of NCDs to allow for better health policy planning.5
Health systems in sub-Saharan Africa (SSA) are unprepared for the manifest CVD consequences of risk factors such as diabetes and hypertension.6–8 Understanding both risk factor development and their consequences (myocardial infarction, stroke, peripheral vascular disease) is essential to ensuring an appropriate health system response to these conditions. Understanding differences between countries can engender learning and may assist policymakers in other countries to craft policies aimed at managing or preventing the rise in modifiable risk factors.
At the individual level, CVD risk predictor algorithms use information on risk factor status to determine future risk of CVD and inform appropriate prevention, clinical care and treatment. A number of algorithms have been developed, often based on data from populations living in western, high-income countries, with the Framingham CVD risk algorithm being one of the earliest. In recognition of contextual variation, additional tools such as Globorisk and the WHO and International Society of Hypertension (WHO/ISH) and more recently the WHO CVD Risk Chart Working Group (WHO-CVD) algorithms have been developed to account for regional-level and country-level differences in future risk. These have been incorporated into guidelines for the treatment of cardiometabolic disease.9 10 For improved applicability to LMIC settings, further developments have led to some of these algorithms not requiring blood-based laboratory results, and can derive risk using simple ‘office’ measures, such as BMI; Framingham, Globorisk and WHO-CVD all have versions with and without laboratory measurements.
In Africa, where different regions—and countries—are found to be at different stages of the epidemiological transition,11 it is likely that risk of future CVD will vary across populations. The use of risk predictor models at the population level can allow for comparisons between populations to estimate the future burden of CVD events, enable the focusing of resources towards preventing these diseases and ultimately, target interventions to mitigate this increasing risk. However, given the number of CVD risk predictor algorithms available, it is necessary to understand how these perform in disparate African countries to enable the choice of an algorithm that will best inform policy.
While CVD risk predictor algorithms have been widely used in high-income populations to examine the burden of future CVD events, very few population-based studies have taken place in Africa.12 13 No published work, to our knowledge, has compared CVD risk, using risk predictor algorithms, across different African countries based on population-based, epidemiologic data. Using data collected as part of the Africa-Wits-INDEPTH partnership for Genomic studies (the AWI-Gen Study), this analysis presents the magnitude of CVD risk factors experienced by individuals and the resultant 10-year CVD risk levels in six geographically diverse African sites from four countries, using common CVD risk predictor algorithms to highlight differences in future CVD risk across sites. Given their use in clinical settings10 and their incorporation into guidelines for treatment of cardiometabolic disease9 in Africa and country-specific predictions,14 15 Framingham, Globorisk and WHO-CVD 10-year CVD risk algorithms were selected for this analysis.
Methods
The data used in this study form part of the AWI-Gen Study and the methods used for the collection of these data are detailed in a recent publication by Ali and colleagues.16 We briefly summarise the study settings, participants and data collection methods relevant to the analysis below.
Study setting
Leveraging existing INDEPTH Health and Demographic Surveillance Sites (HDSS), the AWI-Gen Study recruited participants from six diverse SSA sites representing urban and rural settings in four countries: South Africa, Kenya, Ghana and Burkina Faso. The two rural South African sites (the Agincourt HDSS17 and Dikgale HDSS18) are located in the northeastern corner of South Africa and both are comprised of contiguous villages. The Soweto site,19 in comparison, run by the Developmental Pathways for Health Research Unit, is located in the urban Soweto township, adjacent to Johannesburg, the largest city in South Africa. The African Population Health Research Center HDSS20 is also an urban site, but based in two slum communities in Nairobi, Kenya. Finally, the west African sites are the Navrongo HDSS21 and the Nanoro HDSS.22 The Navrongo HDSS, located in northern Ghana, covers the rural Kassena-Nankana east and west districts. The Nanoro HDSS, located in rural Burkina Faso, covers 24 villages in the central-west region of the country.
Study participants
Participants aged 40–60 years were randomly selected from the population in each of the sites. Additionally, in the Agincourt HDSS, participants who had participated in previous studies were invited to participate (and a random sample was used to supplement this sample). In Soweto, participants were recruited from the existing ‘Birth-to-Twenty plus’ cohort19 of caregivers, and a random, geographical-based, sampling frame was used to supplement this sample. Pregnant women, first-degree relatives of existing participants and individuals with physical impairments preventing measurement of blood pressure were exclusion criteria for this study.
Data collection
Data collected from individuals consisted of a survey, anthropometric measures, blood pressure and fasting blood tests. We used data from the questionnaire on highest level of education attained (no formal education, primary, secondary or tertiary education); socioeconomic status (socioeconomic status quintiles; determined by using a principle components analysis of the household assets, which were then categorised into quintiles for each of the six sites, with the quintiles then used to compare within and across sites23); whether participants were currently working; their marital status (categorised as never married or co-habited, married/living with partner and divorced/widowed). Participants self-reported on treatment for a number of conditions, including diabetes, hypertension and dyslipidaemia, as well as whether they currently smoked tobacco. All survey, anthropometric and blood pressure data were captured by trained field staff with rigorous data quality control mechanisms in place.16
Collection of input variables for algorithms
Each algorithm required a number of input parameters to derive the estimated 10-year CVD risk. The process used for collecting these input parameters is described below. The results also include an analysis of the proportion of the population with known risk factors. The methodologies and definitions used to derive these risk factors are presented in online supplemental appendix 1.
Supplemental material
Body mass index
Height was taken using a Harpenden stadiometer (Holtain, Wales) fixed to the wall; weight using a Physician Large Dial 200 kg capacity scale (Kendon Medical, South Africa). BMI was expressed as the weight (kg) divided by the square of the height (m2). Continuous BMI values were used in the algorithms.
Blood pressure measurement
Blood pressure was measured three times with patients seated at rest, with arm resting on a desk or table, at 2 min intervals, using a digital sphygmomanometer (Omron M6, Kyoto, Japan). Systolic and diastolic measurements were recorded in mm Hg. The final two measurements were averaged, with the average systolic blood pressure being used in the CVD risk modelling algorithms.
Serum analysis: lipids and glucose
Serum lipids and glucose were analysed using a Randox Plus clinical chemistry analyzer (Crumlin, UK) using colorimetric assays. Total cholesterol and high-density lipoprotein (HDL) results were presented in mmol/L and converted into mg/dL by multiplying the results in mmol/L by 18. Continuous total cholesterol and HDL values were used in the algorithms.
Individuals were dichotomised into those with diabetes (fulfilling the definition found in online supplemental appendix 1) or those without diabetes for input into the algorithms.
The analysis was restricted to individuals aged 40–60 years old to allow comparison across sites. Individuals with missing data were excluded from the analysis; in addition, individuals with total cholesterol levels less than HDL levels were also excluded from the analysis.
Cardiovascular risk prediction
Ten-year risk of cardiovascular events was predicted for each individual using the Framingham cardiovascular risk score (predicting coronary death, myocardial infarction, coronary insufficiency, angina, ischaemic stroke, haemorrhagic stroke, transient ischaemic attack, peripheral artery disease, heart failure)24; Globorisk (risk of fatal or non-fatal CVD defined as death from ischaemic heart disease, sudden cardiac death, death from stroke or non-fatal coronary disease or stroke)25 and the WHO-CVD cardiovascular risk score (predicting 10-year risk of a fatal or non-fatal myocardial infarction or stroke (termed CVD in this algorithm)).14 Each of the three algorithms had both a ‘lab’ variant and an ‘office’ variant. Age, sex and current smoking status were used in all algorithms and their office or lab variant. In addition to these inputs, the Framingham office algorithm, the Globorisk office algorithm and the WHO-CVD office algorithm required the BMI of the individual. All three lab algorithms required total cholesterol measurements, with the Framingham lab algorithm also requiring HDL.14 Both Framingham algorithms (office and lab) and WHO-CVD algorithms (office and lab) also required diabetes status, with both Framingham algorithms (office and lab) also requiring current hypertension treatment status (dichotomised into whether a person self-reported to be on anti-hypertensive treatment or not). Online supplemental table 1 presents details on the input variables and output predictions of each algorithm. The resulting CVD risk score was then categorised in each algorithm into low, moderate and high (<10%, 10%–20% and >20%, respectively).
Supplemental material
Definition of high-risk individuals under clinical management
In order to highlight the practical implications of using different 10-year CVD risk algorithms, we undertook a subanalysis to estimate the proportion of algorithm-determined high-risk individuals (those having a 10-year CVD risk score of >20% as determined by each algorithm) who were currently under clinical management. Self-reported information on whether or not a participant was currently on pharmacological treatment for a number of conditions, including diabetes, hypertension and dyslipidaemia was collected during the household survey. A dichotomous variable was derived, with individuals who self-reported as currently taking medication for any of these three conditions considered to be under clinical management to reduce their cardiovascular risk (‘under clinical management’). The number of high-risk individuals under clinical management was then divided by the total number of high-risk individuals per algorithm and the results presented as the proportion of high-risk individuals under clinical management.
Statistical analysis
All analyses were carried out in Stata V.14 and the Stata package whocvdrisk.14 Continuous variables are presented as median and IQR and categorical variables as percentages. χ2 and t-tests were used to compare associations and the differences between group averages, respectively. Both inter-rater agreement (using the kappa statistic) and correlation (using the Spearman correlation) between different algorithms are reported. Agreement was defined as poor/fair, moderate, substantial or excellent when the kappa was found to be <0.40, 0.41–0.60, 0.61–0.80 or 0.81–1.0, respectively.26 Additionally, the Fisher’s z-score was calculated to compare correlation coefficients across different sites. P values <0.05 were considered significant.
Patient and public involvement
Each site undertook a process of community engagement and each participant in the study provided informed, written consent in the language of their choice (generally the local language).
Results
A sample of 10 703 individuals aged 40–60 years were enrolled into the study. Of these, 354 (3.3%) individuals were excluded from the analysis due to missing data, yielding 10 349 individuals for analysis. Women comprised 54.6% (n=5654) of the sample and the median age of the overall sample was 50 years (IQR: 45–55). Nanoro participants accounted for 20% of the sample, while Navrongo and Nairobi both contributed 19%; Soweto, Agincourt and Dikgale contributed 18%, 13% and 11%, respectively.
Table 1 presents the sociodemographic characteristics by site. Education was found to vary considerably across sites, with the vast majority of participants from rural Burkina Faso and rural Ghana self-reporting no formal education (83% and 71%, respectively), whereas the majority of participants from the other four sites had received primary or secondary education.
Sociodemographic variables by study site, AWI-Gen baseline data
Cardiovascular risk factors
Examining five cardiovascular risk factors (BMI ≥25 kg/m2, current tobacco use, diabetes, high blood pressure and dyslipidaemia) that contribute to the CVD algorithms, we found that the number of CVD risk factors differed significantly between sites, with individuals from rural West African sites having fewer risk factors on average than individuals from the rural and urban South African and urban Kenyan sites, with the averages ranging from 1.0 (SD: 0.57) in Nanoro, rural Burkina Faso to 2.5 (SD: 0.76) in Soweto, urban South Africa. Importantly, more than 80% of participants at all of the sites had at least one risk factor, with more than 65% of participants from the three South African sites having two or more risk factors. Nine participants (0.48%) from the urban Soweto site and one participant (0.05%) from the urban Nairobi site were found to have all five measured risk factors (figure 1). The average number of risk factors also significantly differed between the sexes (p<0.001) in the three South African sites and the Nairobi site, with women having the same or higher average number of risk factors in all sites but the rural Burkina Faso site.

Distribution of risk factors (BMI ≥25 kg/m2; current tobacco use, diabetes, hypertension or dyslipidaemia) by site. BMI, body mass index.
10-Year CVD event risk
The average 10-year risk of cardiovascular events by site, risk calculator and sex is presented in table 2. The scores derived using each risk calculator varied, as would be expected, given both the different input variables used in the algorithm and the different outputs that each has been developed to predict. In most cases, the Framingham office algorithm resulted in the highest 10-year risk scores, followed by Framingham lab algorithm, Globorisk office, Globorisk lab and WHO-CVD office and WHO-CVD lab (online supplemental table 2).
Median (IQR) of overall population risk per algorithm by site and by sex, AWI-Gen baseline data
Generally, participants from the Soweto site had the highest 10-year risk of cardiovascular events followed by the rural South African sites (Agincourt and then Dikgale) with the Framingham and WHO-CVD algorithms, but not the Globorisk office and labs (see online supplemental table 2). The estimated 10-year risk in men was greater than that in women using each of the algorithms, sometimes more than three times higher as in the case of Nanoro using the Framingham BMI algorithm; however, the difference between sexes varied substantially by algorithm (table 2).
Furthermore, there was considerable variation in estimated risk between the same calculators using either the office or lab version, with the office version for each of the three algorithms providing higher overall population risk scores than the lab version (table 2).
Level of population risk
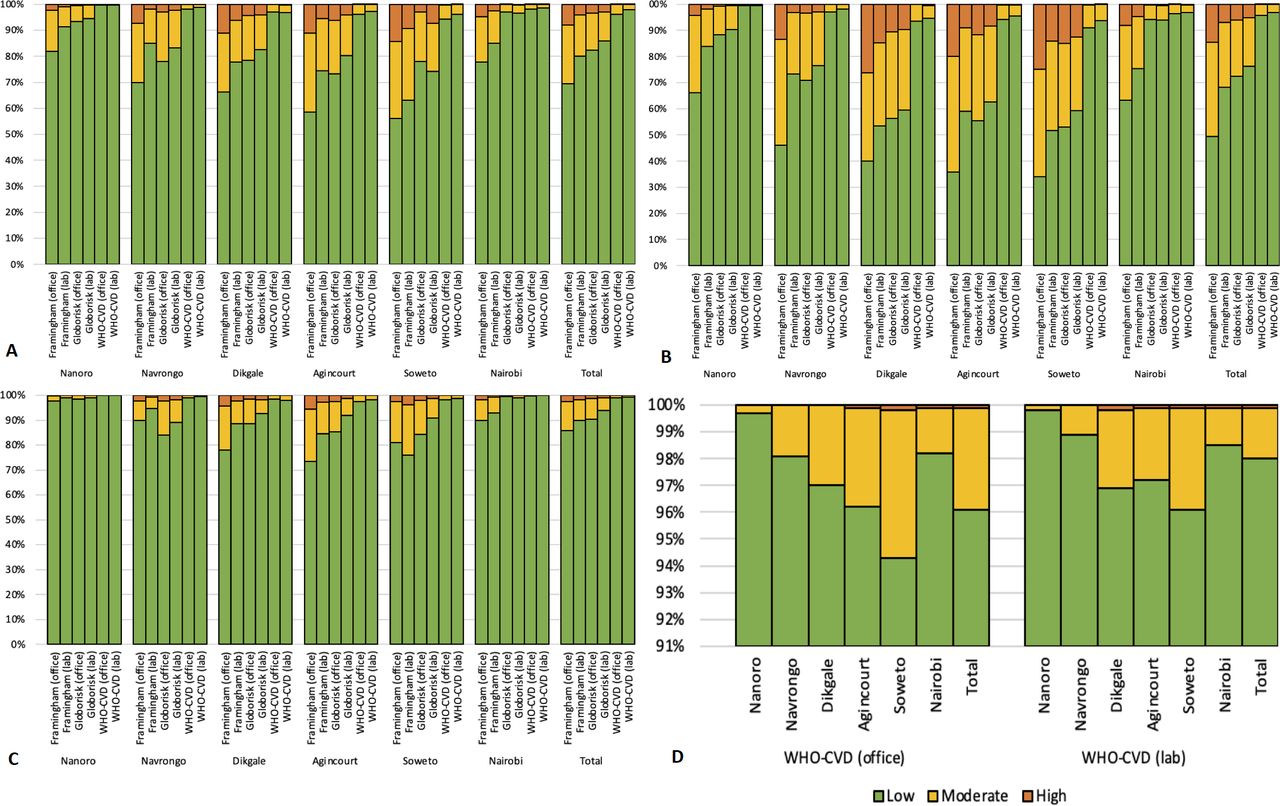
When using the pre-defined thresholds of low, moderate and high 10-year CVD risk, the proportion of the population (as total, or by sex) considered to be at high risk varied within sites depending on the algorithm used (figure 2). Considering the entire study population, Framingham office predicted the largest proportion of individuals at high or moderate risk, followed by Framingham lab, then Globorisk office, Globorisk lab, then WHO-CVD office with WHO-CVD labs. The pattern was similar to the total at individual sites, with some differences by total population and when results were considered by sex (figure 2). Using the WHO-CVD office and lab algorithms, only five and seven individuals, respectively, were identified in the whole study sample as high risk.

Proportion of people at low (<10%), moderate (10%–20%) or high (>20%) 10-year CVD risk by algorithm. (A) Total; (B) men; (C) women and (D) showing CVD risk levels calculated using WHO-CVD (office) and WHO-CVD (lab), by AWI-Gen site with an adjusted scale for ease of showing the differences. AWI-Gen, Africa-Wits-INDEPTH partnership for Genomic studies; CVD, cardiovascular disease.
Level of population at risk under clinical management
In examining those determined to be at high risk for a cardiovascular event in the next 10 years (here defined as a risk score >20%), we found varying levels of individuals who self-reported as being under clinical management for hypertension, diabetes and dyslipidaemia by risk algorithm (table 3).
Proportion of individuals at high 10-year risk for a CVD event by each algorithm who self-report as being under clinical management (%), AWI-Gen baseline data
Agreement and correlation of 10-year CVD risk algorithms across the entire study population, AWI-Gen baseline data
By site, Agincourt and Dikgale had higher proportions of high-risk individuals defined using any algorithm under clinical management (ranging from 20% to 100%), while Nanoro, Nairobi and Navrongo had lower proportions (ranging from 0% to 40%). These wide ranges were due in part to the low numbers of individuals identified as high-risk. Soweto generally experienced the highest levels of ‘high’ 10-year CVD risk in men and some of the lowest proportions of men under clinical management.
Regardless of the algorithm used, high-risk women were found to have higher levels of treatment than men, with these differences in treatment levels most pronounced when using the Framingham BMI and Framingham lipid algorithms. Only using the WHO-CVD algorithms were >50% of high-risk men found to be on treatment in any one site; using all other algorithms, between 0% and 46.9% of high-risk men reported being on treatment.
Agreement between algorithms
Agreement (kappa) and correlation between algorithms across all sites and in individual sites are shown in table 4 and online supplemental tables 3 and 4. Comparing the three existing CVD risk algorithms and their variants across the combined sites, moderate or substantial agreement was found between the ‘office’ and ‘lab’ versions of the three algorithms, with the strongest agreement seen between the Globorisk office and lab algorithms; correlation was also strongest between these algorithms (kappa: 0.64 (95% CI: 0.62 to 0.67); Spearman’s: 0.74). Between different algorithms, poor agreement was found, except between Framingham (both office and lab algorithms) and Globorisk (both office and lab algorithms) where moderate agreement (kappa ranging from 0.41 (95% CI: 0.39 to 0.43) to 0.55 (95%CI: 0.53 to 0.57)) across sites was found. Poorest agreement and correlation were found between the Framingham office algorithm and the WHO-CVD lab (kappa: 0.03 (95% CI: 0.03 to 0.04); Spearmen’s: 0.28) (table 3). Generally, the same agreement and correlation patterns between algorithms were seen when examining individual sites (online supplemental table 3).
Supplemental material
Supplemental material
The correlation and agreement of algorithms between sites also showed substantial differences (online supplemental table 4). The greatest differences were seen between the South African sites or Nairobi with the west African sites (Navrongo and Nanoro).
Discussion
Relying on three commonly used 10-year CVD risk predictor algorithms and their variants,13 27 administered to a large cohort of ageing individuals residing in six SSA sites, this study found high levels of modifiable CVD risk factors with substantial variation and little agreement in predicted 10-year CVD risk across both the algorithms and the sites. This work furthermore highlights substantial differences in the levels of self-reported treatment of individuals identified to be at high risk, depending on the algorithm used to estimate risk—given the health service resource implications of this finding, it represents an important policy and clinical treatment consideration.
Variation in CVD risk by site and sex
While variation between the algorithms was observed in this study, general trends by algorithms persist, allowing us to compare estimated risk across sites. The results highlight varying levels of 10-year CVD risk by region, with lowest levels of estimated risk observed in the rural west African sites, higher levels in the urban Nairobi site and highest levels in the three South African sites. It is important to note that the rural South African sites had populations with higher levels of estimated risk than the urban Nairobi site across algorithms, which is perhaps surprising given the urban context of the Nairobi setting compared with the rural South African context. South Africa is well known to have a high and increasing burden of both CVD risk and morbidity and mortality.28 29 This study confirms these findings by demonstrating the highest level of CVD risk factors among the three South African sites, with more than one-quarter of each site’s population having at least three risk factors and more than one-third of Soweto’s population having at least three risk factors.
Our findings confirm the expected high level of CVD risk regardless of algorithm—a result of the epidemiological transition underway in Africa. Of concern, this study found nearly half of participants had at least two CVD risk factors and, depending on the algorithm used, the total 10-year risk of a future CVD event across all sites ranged from 2.6% to 6.5%, representing the population-level probability of experiencing a CVD event in the next 10 years. While our results likely reflect true inter-country variation in CVD risk, the interpretation of the level of risk at both the country and individual level remains obscured given the variation by algorithm as well as by the fact that the study population from each site was not nationally representative.
Little data from LMICs (especially from Africa) on 10-year CVD risk exist, making comparison of our results to previous studies difficult. However, the Research on Obesity and Diabetes among African Migrants (RODAM) Study has looked at CVD risk in Ghana, and when comparing our AWI-Gen Ghanaian findings to those of Boateng and colleagues,13 we found a lower proportion to be high risk using both the Framingham BMI and Framingham lipid algorithms (7.3% vs 19.4% and 1.8% vs 12.3%, respectively). Two possible reasons for these observed differences are the older ages included in the RODAM sample (40–70 years) versus the AWI-Gen sample (40–60 years), and the location of the study (both rural and urban in the RODAM study vs only rural Ghanaian participants in this study).30
Regardless of the algorithm employed, men were found to have higher levels of predicted 10-year risk than women across all sites. It is generally agreed that CVD affects women 7–10 years later than men31 and this is thought to be related to menopause, with endogenous oestrogen exposure delaying the development of atherosclerosis.32 Comparing CVD risk profiles of men to women 10 years older in high-income countries, one finds similar risk levels.33 This finding may differ in African populations as women from lower-income settings may undergo menopause earlier than women in higher-income settings.34 In the present study, the median (and mean) ages of study participants of both sexes were similar, likely resulting in the higher overall CVD risk seen in men. Yet as the African population continues to age, the expected increase in CVD risk between sexes may not be equal, with greater increases possible among women compared with men.35
Variation in CVD risk by algorithm
Using three commonly used CVD risk algorithms and their non lab-based variants, this study found substantial variation within sites, by algorithm. Comparing the lab and non-lab-based variants, there was generally better agreement, notably between the two Globorisk variants. The differences between algorithm variants are a likely result of the differing weight each risk factor contributes to the algorithm. Previous smaller African studies have examined differences between the two Framingham algorithms, and the pooled cohort equation algorithm in Ghanaian migrant and home populations13 and a single urban Kenyan site27 and our findings are similar with regards to the substantial variation of risk levels when using different algorithms. However, the current study goes beyond these earlier works by finding variation by algorithm across and within six diverse African sites. Previous studies also largely found similar trends in risk level—with Framingham office algorithms predicting higher CVD risk than laboratory algorithms.13 36 Previous cohort studies conducted outside of Africa have also shown the Framingham algorithms to overestimate coronary heart disease risk37 38 and require recalibration.39 In a large study from India, the Framingham algorithm was found to result in higher levels of risk compared with the Globorisk algorithm.40 Due to the fact that the WHO-CVD risk algorithm was only released in late 2019, to our knowledge, no study has sought to compare this new algorithm with other algorithms as was done in this study.
From this study, it is not possible to determine which algorithm most accurately estimates risk and there are likely to be a number of factors contributing to the variation in risk seen when using different algorithms. First, it is important to note that the calculated risk output definitions differ slightly by algorithm. For example, the Framingham algorithm output includes fatal and non-fatal CVD events including transient ischaemic attack and angina, while the Globorisk algorithms do not include transient ischaemic attack and angina.24 25 This could contribute to some of the increased risk levels seen when using the Framingham algorithm, but is unlikely to be the only factor. Another consideration likely contributing to the variation is the input variables. Framingham takes into account lipid levels, diabetes status and treatment for hypertension, while Globorisk does not, and WHO-CVD only includes diabetes status. Future analysis examining the role that the output and input factors described above play in predicting CVD risk is needed.
Each algorithm relies on coefficients derived from the analysis of population cohorts largely from the USA and Europe, with the Globorisk and WHO-CVD algorithms then re-calibrating the models using nationally representative health surveys or data from the GBD to derive more contextually relevant algorithms.14 15 24 However, data from GBD methods are challenged by studies being small, out of date, or reliant on modelling. Confirming the level of risk that each variable confers on an individual in a specific context would allow for the validation, or further recalibration, of these tools. It is possible that certain known CVD risk factors confer different levels of risk, depending on context and underlying genetics.41 42 However, there is a paucity of research on this topic on the African continent that hopefully studies like AWI-Gen, the CRSN Heidelberg Aging Study43 and the Health and Aging in Africa: A Longitudinal Study in an INDEPTH community12 44 can begin to address.
Levels of treatment by algorithm
In predicting population CVD treatment needs, it is important to choose a locally validated tool, given the substantial variation in risk levels that these results highlight. Using the recently released WHO-CVD risk prediction models, we see extremely low numbers of individuals with estimated high CVD risk across each study site. This has major cost and policy implications, as many treatment guidelines, such as WHO’s package for essential noncommunicable diseases in primary healthcare, which many LMICs use, take into account risk scores for evaluation and planned treatment.14 33 Based on the results of this study, the proportion of the population requiring treatment could vary by as much as 14% in urban South Africa, depending on the risk predictor algorithm used (Framingham BMI vs WHO-CVD (lab)). Given the recent release of the WHO-CVD algorithms, it will be important to examine the veracity of the CVD risk predictions generated by these algorithms over the coming years.
Strengths and limitations
This study has several strengths. First, the analysis was carried out using data from a large multisite, multicountry population-based sample of ageing Africans in diverse settings. The study employed rigorous, harmonised data collection methods in well-established research sites, ensuring that the input variables used in the algorithms were accurate, with the outcomes likely to represent the 10-year CVD risk in the studied populations. However, this study also has limitations. Treatment data from Soweto women are missing and having it would have allowed for a greater appreciation of treatment levels among urban women in a context of high CVD risk. Furthermore, the treatment analysis defined an individual as being under clinical management if they self-reported being on treatment for diabetes, hypertension or dyslipidaemia. We did not explore whether the individual was on the correct treatment for a specific condition. The intent of the analysis was to highlight the proportion of high-risk individuals, defined by the various 10-year CVD risk algorithms, that had also been identified by the healthcare system as requiring treatment. Related to this, it is possible that our estimates may have underestimated the proportion of high-risk individuals under clinical management as individuals who are on treatment may actually not be defined as ‘high risk’ due to the positive effects of their current treatment regimen. Second, many of the CVD risk factors rely on self-report and may be influenced by recall bias or social preference; however, the results of this work are largely aligned to previous findings from similar African studies.12 45 46 Finally, it is important to acknowledge that these population risk prediction levels are based on models, developed from studies largely carried out in high-income countries. Previous studies have suggested poor estimation of risk among minority groups.47 48 As such, employing these algorithms in LMICs, such as the six African sites of this study, may result in incorrect risk prediction. While the Globorisk and WHO-CVD algorithms attempt to take into account the likely contextual differences by re-calibrating their models using nationally representative data from diverse settings, more needs to be done to confirm the accuracy of the predicted risk in diverse populations, especially given the recent emergence of the WHO-CVD algorithm. The study populations in this research are not nationally representative and, as such, the results are unlikely to represent national levels of CVD risk. Only through the establishment of African cohorts and the careful follow-up and recording of CVD events, will these algorithms be validated, or adjusted, to account for the genetic, environmental, dietary and behavioural diversity found on the African continent. Context-specific CVD risk equations, or at least validation of existing tools, are needed as the African continent continues to experience rising levels of NCDs.
Conclusion
Africa continues to undergo an epidemiological transition marked by increasing levels of CVD, largely driven by the high prevalence of potentially modifiable risk factors. In order to adequately quantify and properly address the growing burden of CVD at both the population and individual level, the development and validation of CVD risk predictor algorithms is important. This study has highlighted substantial heterogeneity, with a significant lack of correlation and generally poor agreement, between algorithms. Furthermore, we found the proportion of estimated high-risk individuals under clinical management to vary considerably depending on the algorithm used to determine risk. Taken together, these findings re-affirm the need to derive context-specific CVD risk equations to allow policymakers, scientists, clinicians and individuals, the ability to correctly quantify risk and develop policies, treatment guidelines, treatment plans and behaviours that address this growing burden of CVD on the African continent. The collective advocacy by policymakers, clinicians and researchers for better CVD risk algorithms for LMICs can be an important first step.
Acknowledgments
The authors wish to thank the participants of the AWI-Gen study as well as the leadership and staff involved at each of the six field sites: Agincourt HDSS (MRC/Wits Rural Public Health and Health Transitions Research Unit (Agincourt) (South Africa), African Population and Health Research Centre (Nairobi, Kenya), Dikgale HDSS (Dikgale, South Africa), MRC/Wits Developmental Pathways for Health Research Unit (Soweto, South Africa), Navrongo HDSS (Navrongo, Ghana) and Nanoro HDSS (Nanoro, Burkina Faso). Thanks also to the Collaborative Centre based at the Sydney Brenner Institute for Molecular Bioscience, University of the Witwatersrand, Johannesburg, South Africa. RGW gratefully acknowledges funding from the South African National Research Foundation (119234) that allowed him to complete this work.
References
Supplementary materials
Supplementary Data
This web only file has been produced by the BMJ Publishing Group from an electronic file supplied by the author(s) and has not been edited for content.
Footnotes
MR and JID are joint senior authors.
Handling editor Seye Abimbola
Twitter @RyanGWagner, @EngelbertNonte1, @shukrifmohamed, @drjackoids
Contributors RGW, NJC, LM, RB, EAN, FM, SFM, GA, ST and MR contributed to the design of the AWI-Gen study and/or coordinated data collection and data preparation. JID conceived and designed the study. RGW conducted the analysis and drafted the initial manuscript, with input from JID and MR. All authors reviewed, revised and approved the final manuscript.
Funding The AWI-Gen Collaborative Centre is funded by the National Human Genome Research Institute (NHGRI), Office of the Director (OD), Eunice Kennedy Shriver National Institute of Child Health & Human Development (NICHD), the National Institute of Environmental Health Sciences (NIEHS), the Office of AIDS Research (OAR) and the National Institute of Diabetes and Digestive and Kidney Diseases (NIDDK) of the National Institutes of Health under award number U54HG006938 and its supplements, as part of the H3Africa Consortium. Additional funding was granted by the Department of Science and Technology (now Department of Science and Innovation), South Africa, award number DST/CON 0056/2014. The MRC/Wits Rural Public Health and Health Transitions Research Unit and Agincourt Health and Socio-Demographic Surveillance System, a node of the South African Population Research Infrastructure Network (SAPRIN), have been supported by the National Department of Science and Innovation, the University of the Witwatersrand, the Medical Research Council, South Africa and by the Wellcome Trust, United Kingdom (grants 058893/Z/99/A, 069683/Z/02/Z, 085477/Z/08/Z and 085477/B/08/Z).
Competing interests None declared.
Patient consent for publication Not required.
Ethics approval The AWI-Gen study received ethical approval from each site’s local and institutional review boards and the study, in its entirety, received approval from the Human Research Ethics Committee (Medical) of the University of the Witwatersrand (Wits) (protocol numbers M121029; M170880).
Provenance and peer review Not commissioned; externally peer reviewed.
Data availability statement Data used in this manuscript are available upon request.
Author note INDEPTH: International Network for the Demographic Evaluation of People and Their Health.
Supplemental material This content has been supplied by the author(s). It has not been vetted by BMJ Publishing Group Limited (BMJ) and may not have been peer-reviewed. Any opinions or recommendations discussed are solely those of the author(s) and are not endorsed by BMJ. BMJ disclaims all liability and responsibility arising from any reliance placed on the content. Where the content includes any translated material, BMJ does not warrant the accuracy and reliability of the translations (including but not limited to local regulations, clinical guidelines, terminology, drug names and drug dosages), and is not responsible for any error and/or omissions arising from translation and adaptation or otherwise.