Article Text

Abstract
Family planning market segmentation approaches typically include analysis by wealth, particularly when considering whether individuals can afford out-of-pocket expenses in the private sector. Most commonly, this is done using the Demographic and Health Survey (DHS) wealth index, which uses a relative approach by summing household asset questions and categorising respondents into five groups from poorest to wealthiest within a country. In addition, the use of absolute measures, such as segmenting populations based on whether one lives below or above the International Poverty line, defined by the World Bank as US$1.90 per person per day, may provide further useful insights when designing strategies to ensure access to family planning. While such measures are not readily available in the DHS, a simple approach can be used to combine the wealth index and World Bank poverty lines to generate an absolute measure for an additional perspective when conducting family planning market segmentation. Family planning market size estimates were made for 24 low-income countries using wealth quintiles and World Bank poverty lines. The results show large variations in market size based on what measure is used, particularly for countries with a high density of poverty. Looking at both types of measures and understanding the reasons for the differences in market size estimates between the approaches can help lend a more nuanced understanding of the distribution of wealth and income in a country, leading to improved family planning market segmentation and ultimately to ensure more women have access to a method of their choice.
- health services research
- indices of health and disease and standardisation of rates
- public health
This is an open access article distributed in accordance with the Creative Commons Attribution Non Commercial (CC BY-NC 4.0) license, which permits others to distribute, remix, adapt, build upon this work non-commercially, and license their derivative works on different terms, provided the original work is properly cited, appropriate credit is given, any changes made indicated, and the use is non-commercial. See: http://creativecommons.org/licenses/by-nc/4.0/.
Statistics from Altmetric.com
Summary box
Measures of socioeconomic position are important to consider in global health, including understanding a person’s ability to pay for family planning goods and services or ensuring that the most vulnerable have access to free or subsidised services.
Family planning market segmentation commonly uses wealth quintiles readily available in Demographic and Health Surveys (DHS), which provide a relative measure that divides populations within a country into five even groups ranging from the poorest 20% to the wealthiest 20%.
Market segmentation can benefit from using absolute measures of socioeconomic position like the World Bank International Poverty Lines, such as when estimating market size based on an individual’s ability to pay for family planning goods and services out of pocket.
Using the described methodology and provided code, researchers can generate absolute measures from the DHS surveys based on the World Bank International Poverty Lines.
Understanding the intersection of the relative and absolute measures of socioeconomic position yields a more informed understanding of the economic distribution in the population, which can better guide family planning programs.
Introduction
The relationship between one’s socioeconomic position and their access to health goods and services is a critical component in women’s health, where wealthier women have greater utilisation of modern contraception, antenatal care and facility-based deliveries.1 Family planning (FP) programmes often seek to ensure that all women, regardless of their socioeconomic position, have access to a full range of contraceptive methods and FP market segmentation is an important part of planning such programmes.2 In some cases, programmes seek to segment FP markets so that those with fewest resources have access to free goods and services, primarily through the public sector, whereas wealthier individuals have greater access to the private sector due to their ability to pay for FP out of pocket.3 4 These types of market segmentations are typically done using wealth quintiles, which is a relative measure that segments the population into five equally sized groups (ranked from poorest to richest).5 The Demographic Health Survey (DHS) wealth quintiles are widely used across several health areas for examining health outcomes by wealth status in low- and middle- income countries to understand patterns of service utilisation and inequalities and disparities.4 6–9
While wealth quintiles are the primary approach used for examining disparities in access to health services, segmenting by absolute socioeconomic measures may also provide a useful lens for market segmentation. Absolute measures, like the World Bank’s International Poverty lines, estimate the share of the population living below a set income threshold. A simple methodology can use DHS data to generate segments based on the World Bank Poverty Lines. We compare FP market size estimates using relative and absolute socioeconomic measures based on the DHS and discuss how both can provide important insights in market segmentation analyses.
Two common measures of socioeconomic position
There are two common approaches to analysing socioeconomic position. The first approach looks at the relative wealth within a country or population. The DHS wealth index uses this approach, where questions about household construction materials, water and sanitation access, and ownership of various assets (eg, television) are determined at the household level and then individuals are ranked based on the score of the households they live in. Next, the rank positions are used to categorise individuals into five groups from poorest to wealthiest within a country. While useful to understand relative wealth within a country; someone deemed ‘richer’ according to the wealth quintiles might still have few resources for out-of-pocket expenditures. Further, this measure can be difficult to compare across countries since the richest households in one country might have fewer resources than the richest households in another country.10 Additionally, wealth quintiles do not allow one to examine changes in overall wealth over time. To address these challenges, alternatives such as the Comparative Wealth Index, Harmonized Wealth Index and International Wealth Index have been proposed.10–12
In contrast, absolute measures of socioeconomic position are typically based on the flow of resources via income and expenditures. The World Bank generates poverty headcount estimates for most countries based on a complex methodology using multiple sources and assumptions, including country-specific survey data on income and consumption and information on prices, exchange rates and purchasing power parity.13 These estimates classify the proportion of a country’s population living under the International Poverty Line, as defined as US$1.90 per person per day, in 2015 based on 2011 purchasing power parity. Additional measures of poverty at higher thresholds, US$3.20 (lower middle income poverty line) and US$5.50 (upper middle income poverty line), are also calculated.
It is important to recognise that wealth and income are not the same thing; rather they provide different means of quantifying socioeconomic position.14 Many alternative measures exist, including the Unsatisfied Basic Needs measure, which focuses on non-income aspects of poverty and the Multidimensional Poverty Index that includes health, education and living standards and considers incidence and intensity of deprivation.15–17 While these and other measures play an important role in understanding deprivation and inequality, our focus is on the DHS wealth index and World Bank poverty thresholds, since they are widely used and can be easily interpreted for integration into DHS market segmentations.
Applying absolute dollar thresholds to DHS relative wealth data
Since income variables are not included in the DHS, one can use the relative wealth index and apply an absolute threshold to the World Bank poverty thresholds. This is done by ranking individuals according to the wealth index and then using the absolute dollar thresholds to generate new variables that incorporate absolute measures. For example, if 50% of the population in a country live below the US$1.90 per day threshold, then the bottom 50% of individuals as measured by the wealth index are considered to live in extreme poverty (figure 1), as defined by the World Bank.18 This approach assumes that if you lined up everyone in a country from poorest to richest based on the wealth index, people would stay in a similar order if instead you lined them up based on their household income. While the order will not be identical, researchers have found this assumption sufficient for developing an absolute measure based on wealth variables.19–21

Comparing the international poverty line and wealth quintiles.
To compare relative and absolute measures, we examined DHS data from 24 countries that met three criteria: (1) they were designated by the World Bank as low-income countries in 2017, (2) World Bank poverty headcount percentages were available and (3) a DHS survey was available between 2010 and 2019. We generated an income-based variable that used the DHS wealth index rank and applied World Bank poverty thresholds for those living below US$1.90 per day and those living above the upper middle income poverty line of US$5.50 per day.22
Figure 2 shows the proportion of women of reproductive age (WRA) in each wealth quintile that is estimated to be living in absolute poverty. This figure shows substantial variation by country, from Madagascar where 100% of the bottom three quintiles (‘poorest’, ‘poorer’ and ‘middle’) and 84% of the fourth ‘richer’ quintile are living in absolute poverty, to Nepal, where less than a third (32%) of those in the poorest quintile are living in absolute poverty. This variation is important when considering how policy-makers segment the population by these metrics and what they mean for understanding FP markets, as demonstrated in the two scenarios described below. For simplicity, these scenarios only look at these two measures of relative wealth and absolute poverty and potential FP users based on current FP use and future FP intentions. When conducting a full market segmentation analysis, it is important to also include a wide range of other variables related to demographics, prior contraceptive use, knowledge and attitudes around FP, and other market factors.23

Per cent of women of reproductive age in each wealth quintile living below the US$1.90 per day poverty line among 24 low-income countries.
Scenario 1: estimating the market size for FP vouchers aimed at poor women
Consider a scenario where an organisation wants to increase access to FP for the poor in a low-income country by providing vouchers that can be exchanged for free FP services at designated clinics. Using the DHS wealth index, one might aim to serve the two bottom quintiles (poorest and poor), consisting of approximately 40% of WRA. Alternatively, one may consider the number of WRA who are living below the International Poverty Line.
For each of the 24 countries, the potential market size for FP services was estimated as WRA who were already using some form of FP or indicated an intent to use FP in the future in the most recent DHS survey. These proportions were applied to the 2017 estimate of WRA based on the World Population Prospects published by the United Nations Population Division. Next, two estimates of the potential market for FP vouchers were made by applying two different definitions of ‘the poor’: (1) proportion living under US$1.90 per day (absolute poverty) and (2) proportion in the bottom two wealth quintiles (eg, relative poverty).
Table 1 shows that across the 24 countries, the totals are not dramatically different at 31 million women using the absolute poverty line and 28 million women using the poorest and poor quintiles. When looking at individual countries, however, the resulting market size can vary widely depending on which measure is used. For example, in the Democratic Republic of the Congo, using absolute poverty results in 6.4 million women while using relative poverty results in 3.3 million women. The difference between these two estimates can be explained by looking at figure 2, where those living in absolute poverty are not just those in the ‘poorest’ and ‘poorer’ quintiles, but include all women in the ‘middle’ quintile and 60% of those in the ‘richer’ quintile.
Market size estimate for family planning voucher aimed at poor women or reproductive age in 24 low-income countries
Interventions in low-income countries often express the challenges of reaching the poorest of the poor.24 25 While efforts should certainly be made to reach those most in need, for countries with a high proportion of the population living in absolute poverty, targeting voucher services only to the bottom quintiles may inadvertently leave out women who could benefit greatly from receiving free or subsidised services. In contrast, in places like the Gambia, where only 54% of those in the poorest quintile are living in absolute poverty, targeting a voucher programme to focus only on those living in absolute poverty may limit the reach of such programme. In this context, and others with a lower density of poverty, a quintile approach may be more useful for estimating market size.
Scenario 2: estimating market size for FP commodities aimed at wealthier women
Now, consider a scenario where an organisation that wants to estimate the market size for a new brand of oral contraception that would be available in pharmacies and drug shops over the counter but would require the client pay out of pocket for the product. In this scenario, one would want to estimate the number of potential users with the ability to pay. Focusing again on women who are currently using or intend to use FP, one can estimate the richest 20% of WRA as those with the means to pay for this product. Alternatively, one could examine the proportion of the population living above the upper-middle income poverty line of US$5.50 per person per day. While US$5.50 a day translates to approximately US$8000 per year for a family of 4 and certainly does not designate one as wealthy, it can serve as a measure of one being comfortably above the poverty line in a low-income country.
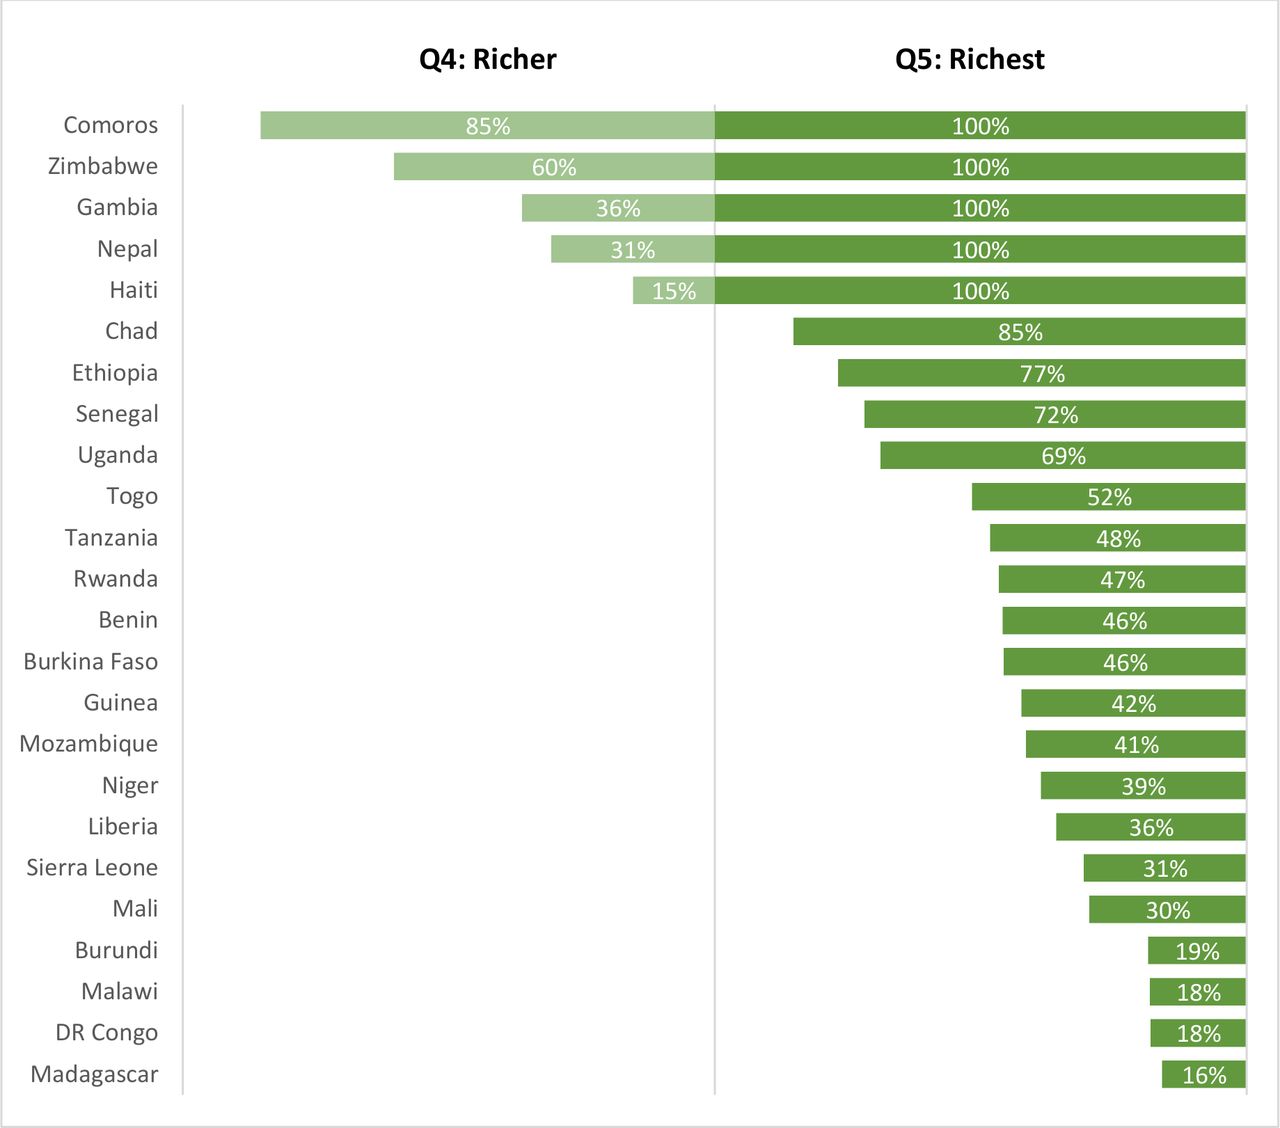
Figure 3 details the overlay of the relative and absolute variable for the 24 low-income countries. For five countries (Comoros, Zimbabwe, Gambia, Nepal and Haiti), all the women in the ‘richest’ quintile and many in the ‘richer’ quintile are living on more than US$5.50 per day. The remaining 19 countries show less than 100% of women in the ‘richest’ quintile living above US$5.50 per day. Table 2 shows substantial differences in the estimated market size based on whether the absolute or relative measures is used, with the use of the US$5.50 threshold resulting in a much smaller market size estimate on average. Malawi and Madagascar show particularly stark differences with the top quintile yielding 5.5 and 6.6 times that of the absolute US$5.50 threshold, respectively. This is because, as shown in in figure 3, in both countries only a small share of women in the richest quintile live on more than US$5.50 per day.

Per cent of women of reproductive age in the fourth and fifth quintile living above the US$5.50 per day poverty line in 24 low-income countries.
Market size estimate for social marketed family planning commodity aimed at wealthier women of reproductive age (WRA) in 24 low-income countries
For a programme seeking to size the market potential for a contraceptive pill that must be purchased at either a commercial or subsidised price, focusing on those living on more than US$5.50 per day will likely provide a more useful estimate in most contexts than looking that looking membership in the top quintile. However, further considerations likely factor in the ability or willingness to pay for a contraceptive pill and programmers should also incorporate data from market research studies to address consumer preferences and willingness to pay.
When to use a relative versus absolute approach?
We recommend that programme planners explore both approaches within their market segmentation work and determine which approach makes the most sense for the given context and question. While there is not a simple answer to which approach is better, several factors are relevant to help determine which approach to use for making FP market size estimates.
The distribution of income within a country or countries is the first important consideration. In countries like Nepal and the Gambia, with few women living under the poverty line and many living above US$5.50 per day, a quintile approach makes sense when trying to reach the poorest or wealthiest in the country. In contrast, using quintiles may be insufficient in countries with high levels of poverty, such as in Madagascar, Burundi, Democratic Republic of the Congo and Malawi. In these contexts, segmenting by quintiles can create misleading distinctions when the both the ‘poorest’ and many ‘richer’ women are living in extreme poverty.
Another consideration is to what extent precision is needed for market size estimation. While the World Bank poverty thresholds are useful in applying an absolute lens on wealth index data, there are several assumptions involved in the calculations and the estimates do not account for substantial regional variations within a country.13 Further, the approach described in this paper allows for estimating an individual’s position as above or below a poverty line but not estimating the actual income of an individual or household. If one is in need of precise estimates, particularly when focused on a subnational region, a better approach would be to collect income and consumption data in conjunction with health data directly rather than applying the World Bank poverty thresholds to the DHS wealth index.
Finally, one should consider the overall affordability of FP goods and services when generating market size estimates. As demonstrated in the tables and figures, when thinking about a woman’s ability to pay for FP out of pocket, her relative position in the ‘richest’ quintile may not be sufficient for inclusion in the market estimation. In this case, the absolute threshold of US$5.50 may be more appropriate measure for estimating those with the financial resources to pay for FP. However, as noted earlier, the US$5.50 a day threshold does not indicate that a woman is ‘wealthy’, and affordability could still be an issue for women living above this threshold. An examination of client preferences and willingness-to-pay measures should also be included.
A few words of caution
As noted earlier, a key limitation of this approach is that it assumes some similarity in the distribution of households based on wealth as in the distribution of households based on income. Researchers have noted differences between these two constructs when looking at data over time and across countries. One study in China found that asset-based wealth inequality was decreasing over time while income inequality was increasing.26 Another study found the strength of the relationship between asset-based wealth and income differs by country.27 These findings raise important questions on how both asset-based and income-based metrics can be advanced. Important research has already been conducted in this space and we look forward to there being continued improvements in our understanding of these dynamics.
Despite these questions, other research has shown that wealth indices can be used to meaningfully provide estimates of absolute income measures.19–21 For example, a study covering 66 countries combined DHS wealth indices with estimates of the wealth distribution in countries to estimate absolute wealth at the household level and a validation exercise found a strong correlation between World Bank Poverty Headcounts and their derived absolute measure.20
Acknowledging that the alignment between income and wealth is imperfect, it is important to distinguish between using the combined measure for aggregate versus individual-level analysis. At the individual level, there is a risk of individuals being misplaced around the cut-offs between thresholds and being assigned to the wrong group. For this reason, we do not advocate using the combined measure to estimate the income of individuals or to be used as an explanatory variable in regression analysis. At the aggregate, however, individual misplacement is not expected to have a substantial impact on the segmentation results. We conducted a sensitivity analysis to see the impact of assuming some displacement of women between living on less than US$1.90 per day and living on US$1.90–3.20 a day, which resulted in minimal impact on the estimated market size for vouchers for poor WRA.
In summary, given how widely DHS wealth quintiles are used to explore health inequalities and develop strategies for segmenting markets, we believe that adding this simple approach of also segmenting by absolute income level provides useful new insights from existing measures and data sources.
Conclusions
Understanding the FP market involves consideration of many important factors, such as method mix and supply, consumer preferences and market sectors. The socioeconomic position of FP clients is relevant in appropriately segmenting the market by ability to pay for FP or for targeting subsidised or free services. While disaggregation by absolute income thresholds is not published as standard results in DHS surveys, the online Family Planning Market Analyzer (http://fpmarketanalyzer.org/) includes data on FP use by absolute income segmentation data based on the most recent DHS in 58 countries, and STATA code provided in online supplemental annex A allows researchers to replicate these results for additional DHS surveys.
Supplemental material
There are advantages to both the relative and absolute approaches to looking at socioeconomic position. Looking at both types of measures and understanding the reasons for the differences in market size estimates between the approaches can help lend a more nuanced understanding of the distribution of wealth and income in a country, leading to improved FP market segmentation.
Acknowledgments
The authors would like to thank Sarah Bradley at Abt Associates for reading and providing comments on a previous version of this manuscript.
Footnotes
Handling editor Sanni Yaya
Contributors NB drafted the manuscript and created the tables and figures. Both MW and MR contributed data analysis and a detailed review and edits on the manuscript draft.
Funding This study was funded by United States Agency for International Development (AID-OAA-A-15-00067).
Competing interests None declared.
Patient consent for publication Not required.
Provenance and peer review Not commissioned; externally peer reviewed.
Data availability statement Data are available in a public, open access repository.