Article Text

Abstract
Introduction The Indian national Civil Registration System (CRS) is the optimal data source for subnational mortality measurement, but is yet under development. As an alternative, data from the Sample Registration System (SRS), which covers less than 1% of the national population, is used. This article presents a comparison of mortality measures from the SRS and CRS in 2017, and explores the potential of the CRS to meet these subnational data needs.
Methods Data on population and deaths by age and sex for 2017 from each source were used to compute national-level and state-level life tables. Sex-specific ratios of death probabilities in five age categories (0–4, 5–14, 15–29, 30–69, 70–84) were used to evaluate CRS data completeness using SRS probabilities as reference values. The quality of medically certified causes of death was assessed through hospital reporting coverage and proportions of deaths registered with ill-defined causes from each state.
Results The CRS operates through an extensive infrastructure with high reporting coverage, but child deaths are uniformly under-reported, as are female deaths in many states. However, at ages 30–69 years, CRS death probabilities are higher than the SRS values in 15 states for males and 10 states for females. SRS death probabilities are of limited precision for measuring mortality trends and differentials. Data on medically certified causes of death are of limited use due to low hospital reporting coverage.
Conclusions The Indian CRS is more reliable than the SRS for measuring adult mortality in several states. Targeted initiatives to improve the recording of child and female deaths, to strengthen the reporting and quality of medically certified causes of death, and to promote use of verbal autopsy methods can establish the CRS as a reliable source of subnational mortality statistics in the near future.
- public health
- epidemiology
This is an open access article distributed in accordance with the Creative Commons Attribution Non Commercial (CC BY-NC 4.0) license, which permits others to distribute, remix, adapt, build upon this work non-commercially, and license their derivative works on different terms, provided the original work is properly cited, appropriate credit is given, any changes made indicated, and the use is non-commercial. See: http://creativecommons.org/licenses/by-nc/4.0/.
Statistics from Altmetric.com
Key questions
What is already known?
The Sample Registration System (SRS) is currently the main source of mortality statistics in India since the Civil Registration System (CRS) is yet under development.
Limitations in sample size, as well as problems with quality of causes of death result in considerable uncertainty in population-level mortality estimates from the SRS, and these limitations could be potentially be addressed through strengthening the CRS.
What are the new findings?
This evaluation found that the CRS has high levels of reporting coverage for death registration in most states and also measured higher levels of mortality at ages 30–69 years in several states as compared with the SRS, and with high precision.
Key CRS limitations are uniform low reporting of child deaths, low female death registration in many states, and critical gaps in cause of death ascertainment.
What do the new findings imply?
Interventions are required to improve child and female death registration, to strengthen medical certification of cause of death in hospitals and to introduce verbal autopsy to ascertain causes for home deaths.
These interventions will establish the CRS as a routine and reliable source for national and subnational mortality measurement in India in the near future.
Introduction
Mortality measures by age, sex and cause are essential inputs for population health assessment, health policy and research. Civil registration and vital statistics systems based on medical certification of causes of death are the optimal data source for mortality measurement, given their legal mandate for total coverage, and design characteristics that potentially assure timeliness and data quality.1 In particular, the size and dispersion of population in a large country such as India create a critical need for robust mortality and health measurement at state and even district levels. For monitoring progress towards the United Nations Millennium Development Goals, information on numbers of deaths and death rates are required each year from important conditions including tuberculosis, heart diseases, diabetes, cancers, maternal and child health conditions and road traffic accidents, among others.2 These data are required to quantify major health problems, plan and implement health services, monitor their impact and guide research priorities to reduce deaths and thereby to improve the health of the population.3
The current Civil Registration System (CRS) in India is implemented by the Office of the Registrar General of India (ORGI) housed in the Ministry of Home Affairs, under the Registration of Births and Deaths Act, 1969.4 In anticipation of the long lead time for CRS development as a reliable source for vital statistics, the government of India established a nationally representative Sample Registration System (SRS) in 1970 as an interim population-based data source. In its current form, the SRS operates in 8850 sample units and covers about 0.6% of the national population. In each unit, births and deaths are continuously recorded by local registrars, with established follow-up procedures for quality control and ascertainment of causes of death.5 Over time, the SRS has served as the main data source for estimating mortality indicators for India, principally due to its assurance of high levels of completeness of death registration.6 Also, since 2001, the SRS uses formal verbal autopsy (VA) methods for ascertaining causes of death.7 Data from the SRS have been recently used by two different research groups to estimate national-level and state-level cause-specific mortality patterns, using statistical methods to fill gaps arising from limitations with quality of VA recorded causes of death.8 9 However, differences in estimation methodology have resulted in considerable variations between the two mortality estimates, and hence limiting the direct utility of either set of estimates for health policy and evaluation. Such data uncertainty underscores the overall limitations of the SRS for cause-specific mortality estimation in India, even at the national level.
Under these circumstances, the CRS could serve as a viable source of mortality statistics at national and subnational levels, given its mandated universal coverage and other quality assurance elements described elsewhere.10 In brief, the CRS is based on a comprehensive legal framework and is implemented in a decentralised model through a multisectoral network of registration units across urban and rural areas. All deaths are registered at the local CRS registration unit using a death report (form 2).11 Physician-attended deaths must also be certified as to cause using a medical certificate of cause of death (MCCD) (form 4/4A), which is to be submitted along with the death report (form 2) to the local CRS unit for death registration.12 The system design provides an administrative framework for registration infrastructure across the country, prescribes uniform operating procedures, has established processes for compilation and submission of vital statistics, and includes routine practices for monitoring system performance and for data analysis. In 2012, the Ministry of Health and Family Welfare and the ORGI convened a ‘Committee on Strengthening the Civil Registration System’, which recommended a range of interventions to improve system performance.10 13 These included mobilisation of human, technical and financial resources from the National Rural Health Mission to strengthen CRS, and better coordination and supervision of CRS at all levels, among others.10 13 Since then, annual CRS reports indicate a steady improvement in reporting coverage, along with concomitant improvements in completeness of death registration from 67% in 2011 to 79% in 2017.14
This article describes findings from a detailed evaluation of quality of data from the CRS in 2017. Where applicable, data from the SRS were used as reference values to evaluate reliability and plausibility of age–sex variations in CRS death registration, both at national and state levels for India’s large states. The findings were used to infer the comparative utility of data from the two sources for mortality measurement at subnational level, and to make recommendations for further development of the CRS into a viable source of vital statistics for India.
Data sources and methods
The two principal data sources used for this analysis are the annual CRS and SRS vital statistics reports for 2017.14 15 This data quality evaluation presents an in depth analysis of CRS reporting coverage, estimated completeness of CRS death registration and comparative analysis of estimated summary measures of mortality from the two sources, as derived from national-level and state-level life tables by age and sex. The evaluation also presents a summary of the information reporting cascade of data from the MCCD scheme, along with measures of hospital reporting coverage and a summary indicator of the quality of cause attribution.
CRS reporting coverage is defined as the proportion of registration units in each state that submitted statistical reports for the reference period. This data was extracted from the CRS annual report for 2017, along with data on total population, total numbers of registered deaths and proportions of delayed registration beyond 1 year from the date of death. Completeness of death registration is defined as the proportion of registered deaths out of the expected deaths that are estimated to have occurred in the reference population during the period for analysis. Death registration completeness in the CRS was computed and compared across two methods. The first method, used by the ORGI (termed as the ORGI method) applied the SRS observed crude death rate in 2017 for each state to the state population estimate for 2017, to compute the expected deaths that would have occurred in 2017. Completeness was reported by ORGI for each state as the proportion of observed CRS 2017 deaths out of these expected deaths.16 The second completeness estimate was derived from the Adair-Lopez model, which estimates death registration completeness as a function of its relationship with the registered crude death rate, an estimate of the true under-five mortality rate for the study population, and the proportion of individuals aged above 65 years in the study population.17 The model equations for these relationships were developed using population and mortality rates from 2451 country years of vital registration data. The Adair-Lopez model comprises two variants, the first of which includes an estimated factor of under-five mortality registration completeness in the study population, while the second variant excludes this factor. For our analysis, relevant input parameters were derived by sex for each state from CRS data for 2017 and used as inputs to estimate national-level and state-level completeness across all ages by sex, using the second variant of the model. This second variant is recommended for use in situations where death registration completeness at all ages is not expected to be associated with child mortality registration completeness, and such absence of association was observed in the CRS data.
Life tables for India and 35 states and union territories were computed from the CRS 2017 data, and for 22 states with larger populations from the SRS data for 2017.18 The key inputs required for life table analyses are population and death distributions by sex and age categories from each data source. For the SRS life tables, these distributions were computed using data from the SRS 2017 annual report for 22 states, which contain the following information for each state:
Total sample population.19
Detailed proportionate population distributions for each sex by the following age groups: <1, 1–4, 5–9, 10–14….80–84, 85+ years.20
Age-specific death rates for each sex according to the same age groups.21
The inputs for CRS life tables were derived through a separate process based on the following primary data available for 2017:
Estimated total population by sex for each state/union territory.22
Total CRS deaths by sex for each state/union territory.23
For 28 states/union territories, the numbers of CRS deaths by sex for the following age groups: <1, 1–4, 5–14, 15–24….55–64, 65–69, 70+.24
First, the state-specific SRS population distributions by age were applied to total state population estimates by sex for 2017, to derive state-wise age–sex population estimates for the 22 large states. For 14 smaller states and union territories, detailed SRS population age distributions from neighbouring states were used to derive their age–sex CRS population estimates. Next, for 28 states/union territories, the SRS detailed death distributions by age were used to interpolate the coarser age groups of CRS reported deaths to derive CRS deaths according to the same age–sex categories as the population estimates.24 For the eight remaining states, the detailed CRS death distributions by age were interpolated from their total registered death numbers by sex, using standard death distributions by age from states with potentially similar epidemiological characteristics as follows:
Madhya Pradesh as the standard for Bihar, Jharkhand and Uttar Pradesh.
Himachal Pradesh as the standard for Uttarakhand and Sikkim.
Punjab as the standard for Haryana.
Assam as the standard for Manipur.
For Maharashtra, the death age distributions from CRS 2016 were used as the standard for deriving similar distributions for CRS 2017.
These detailed population and death distributions according to identical age categories from SRS and CRS were then analysed to compute sex-specific life tables for India and states for 2017.18 Summary life table-derived mortality measures used for comparisons between CRS and SRS included life expectancy at birth, and probabilities of dying by sex from each source at national/state level across the following age groups:
Birth to five years to represent childhood mortality.
Five to fourteen years to represent school age mortality.
Fifteento twenty-nine years to represent mortality during adolescence and young adulthood.
Thirty to sixty-nine years to represent premature adult mortality.
Seventy to eighty-five years to represent mortality among the elderly.
The variance for each mortality measure from the CRS was calculated according to the Chiang II method, which is incorporated into the spreadsheet calculation tool.25 The variance of SRS mortality measures was also estimated using the Chiang II method, since cluster-specific death counts were not available for the 8850 sample units of the SRS, and therefore non-parametric methods could not be applied to estimate variance.26
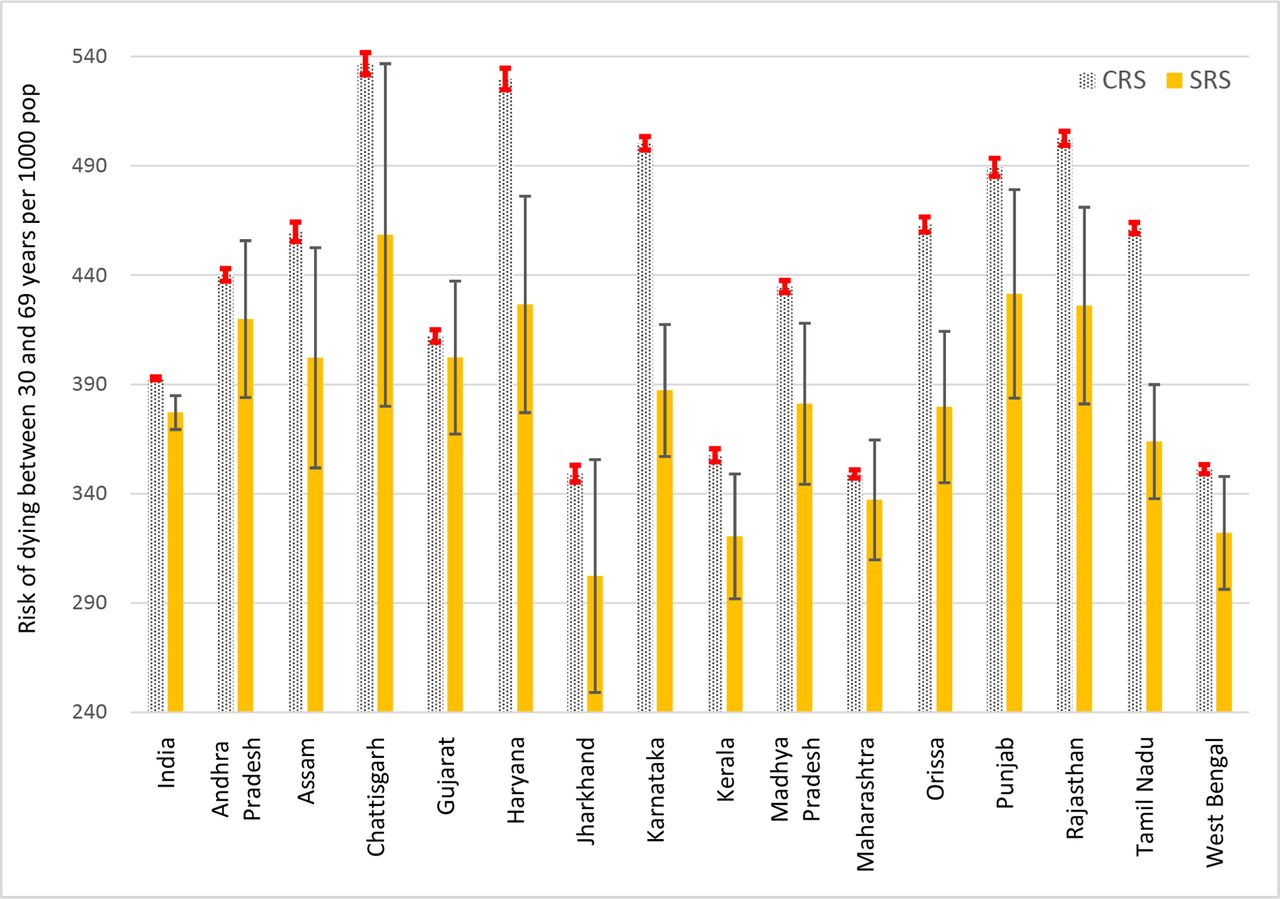
For an in-depth understanding of the influence of age-specific completeness on overall CRS completeness, heat maps were generated to show the ratio of mortality risks from the CRS and SRS by age group for each sex. The SRS measures were used as the reference standard, given the known high levels of completeness of SRS death registration. Ratios were colour coded to reflect lower or higher death recording by the CRS in comparison to the SRS, for the same age–sex group. To understand the impact of precision of mortality estimates from either source on their potential utility for population health assessment and health policy, bar charts were developed to compare risks of premature adult mortality (between 30 and 69 years), along with estimated 95% CIs. This is the defined age interval for the recommended international indicator to measure the risk of premature adult mortality from four major non-communicable disease categories, namely, cardiovascular diseases, cancers, diabetes and chronic obstructive pulmonary diseases.27 Where detailed data on causes of death may not be available, a reliable estimate of the all-cause mortality risk at these ages can serve as a basis for applying cause-specific proportional mortality models to infer the likely mortality risk from these conditions. Charts were developed separately for males and females, for states with CRS reported risks that were higher than the SRS.
Finally, to evaluate the quality of data on causes of death from the CRS, a descriptive table of the performance of the MCCD scheme in 2017 was developed.12 The table shows the cascade of MCCD reporting for each state, starting with the number of accredited hospitals, the number of hospitals covered by the MCCD regulations, the institutions that submitted annual reports in 2017, the eventual proportions of registered deaths in each state that were medically certified as to cause, and the proportions of these certified deaths that were assigned non-specific conditions as underlying causes of death. The table also reports an estimate of the proportion of SRS deaths recorded in 2017 that received some form of medical attention at death, from either a government or private hospital.28 This statistic indicates the proportion of deaths for which there is a likelihood of obtaining some medical inputs for diagnosing the causes of death.
Results
Reporting coverage and completeness
A broad overview of the operational characteristics of the CRS and SRS is presented in table 1 as a basis for understanding subsequent analyses. The CRS is implemented through an extensive network of registration units across the country, with high levels of reporting coverage in most states, except for levels below 60% in the hill states of Arunachal Pradesh, Nagaland and Uttarakhand. The estimates of death registration completeness are reasonably correlated across the ORGI method and the Adair-Lopez models for all states. Estimated completeness levels also generally correlate well with the reporting coverage levels, except in Madhya Pradesh and Uttar Pradesh, which show low completeness despite high reporting coverage. This indicates that a number of registration units in these states had submitted reports with considerably less than expected death registrations. A more detailed analysis across districts in these states could help identify locations where interventions could be required to improve CRS performance. Delayed registration is generally low, except in the case of Arunachal Pradesh (50%) and Nagaland (37.6%), but data are not available for some states, and this could influence the validity of annual mortality measures reported from the CRS.
National and subnational operational characteristics of the CRS and SRS in India
The SRS does not experience problems with reporting coverage or completeness of death registration, given its strengths in performance, as described elsewhere.6 However, a key drawback is the design limitation from sample size. While there are large numbers of sample sites in each state, the low population coverage and resultant low numbers of observed SRS deaths are indicative of the relatively small size of each cluster, which limits the precision of SRS mortality indicators by sex, age and location, as compared with the CRS. For 14 states and union territories with smaller populations, the SRS does not even report schedules of observed age-specific death rates probably on account of these sample size limitations, which precludes the computation of life tables and their outputs for these areas.
Summary mortality measures
Table 2 shows summary mortality measures from the two sources at national and state levels. We first compared estimated life expectancies at birth and found that CRS life expectancies for both males and females are less than or equal to those from the SRS in Karnataka, Kerala and Tamil Nadu. This indicates that the SRS potentially underestimates mortality in these states. The CRS life expectancies for men are also relatively close (±1 year) to the SRS levels in Andhra Pradesh, Gujarat, Haryana, Maharashtra, Odisha, Punjab and Rajasthan. However, CRS female life expectancies in these states are considerably higher than SRS levels, suggestive of under-reporting of female deaths in the CRS, relative to the reporting of male deaths.
National and subnational summary measures of mortality for 2017 from the CRS and SRS in India
All other states with data from both sources show higher CRS life expectancies for both males and females, which indicate a general lower death recording in the CRS as compared with that in SRS sites located in these states. Further, the CRS life expectancy estimates are implausibly high (>75 years in males and >80 years in females) for several states where comparison measures from the SRS are not available, including Arunachal Pradesh, Sikkim, Manipur and Nagaland, and the union territories of Andaman and Nicobar Islands, and Daman and Diu. On the other hand, the lower life expectancies and high age-specific mortality risks observed in the union territories of Chandigarh, Delhi and Puducherry appear implausible, given the levels of socioeconomic development and availability of high-quality healthcare in these cities. These findings could be a reflection of the mandated practice of death registration and reporting of vital statistics according to the place of occurrence of death.14 The CRS data for these locations potentially include deaths that occur in individuals from neighbouring states who seek terminal medical care in the advanced tertiary hospitals in these cities, hence inflating the numerators for calculating mortality indicators. Life tables could not be computed for Lakshadweep owing to low numbers of population and registered deaths by age and sex.
Table 2 also shows the estimated probabilities of dying by sex and age from the two data sources. As mentioned previously, the SRS death probabilities by sex and age are routinely used for mortality estimation for India and states, given their reputed reliability. In summary, the SRS demonstrates considerable interstate variations in mortality patterns. For instance, there is a fivefold difference in risk of child mortality, ranging from 13 per 1000 in Kerala to about 65 per 1000 risk in Uttar Pradesh, for male and female children together. There is similar variation in adult mortality risks across states, along with considerable gender differentials, ranging between 289 and 464 per 1000 population in males and between 190 and 365 per 1000 in females.
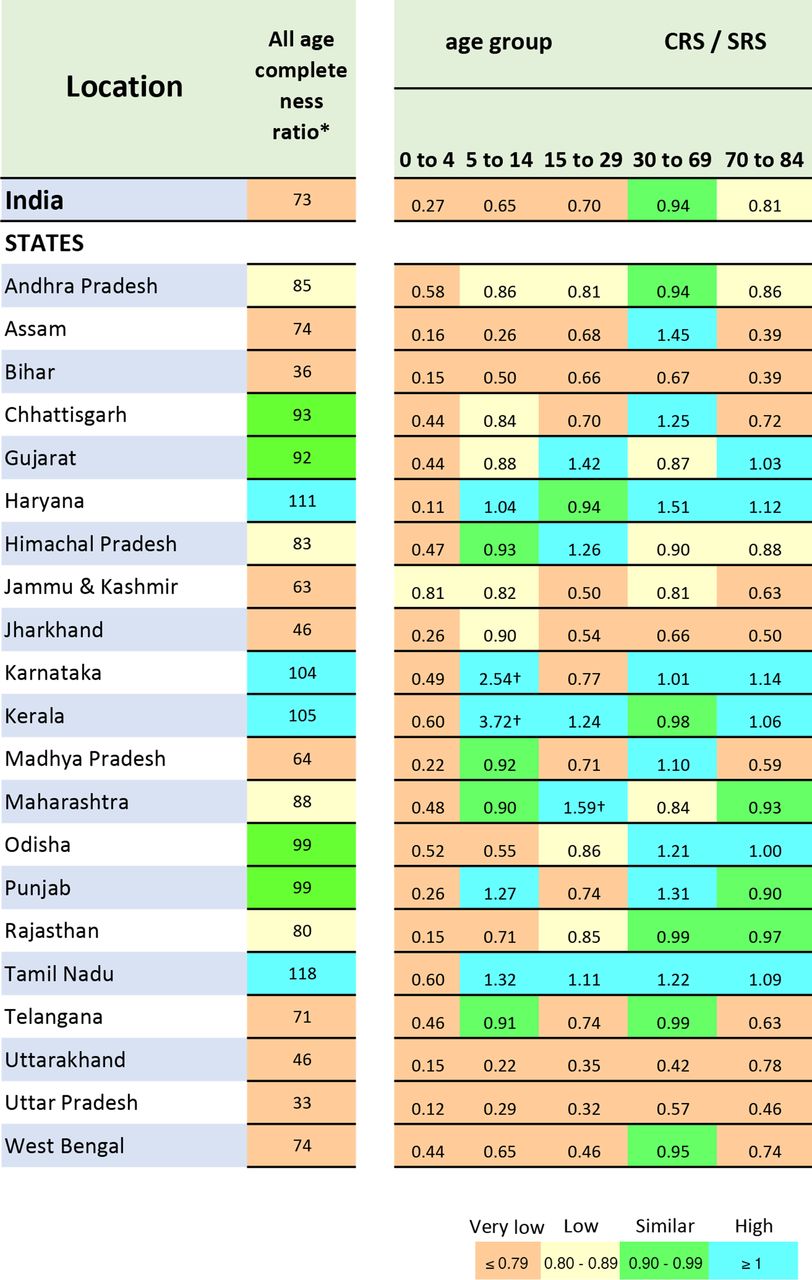
We used the SRS death probabilities as reference values to compute the ratios of completeness of CRS sex-specific and age-specific death probabilities (see figures 1 and 2). Ratios less than 1 are indicative of under-reporting by the CRS, and ratios above 1 are indicative of higher mortality recording by the CRS. As can be seen, there is general under-reporting of childhood mortality in the CRS across all states, with ratios less than 0.5 in about three-fourths of states. On the other hand, the probability ratios show higher levels of CRS death recording at adult ages (30–69 years) in most states, but particularly so for males. Even the states of Assam, Madhya Pradesh and Telangana with very low ratios of overall completeness (<0.8) show high death probability ratios at ages 30–69 years in both males and females. Similarly, the states of Chhattisgarh, Jharkhand and West Bengal have low overall completeness ratios (0.8–0.9) but show ratios of more than 1 for this age category, but for males only. Several states also demonstrate higher CRS death recording among the elderly. In addition, female death probability ratios are less than 1 in age categories above 15 years in many of the states, indicative of a general under-reporting of adult female deaths in the CRS.

Ratios of age-category probabilities of death in men from CRS and SRS by state in 2017. *Estimated according to the Office of the Registrar General of India method. †High ratios are influenced by very low numbers of SRS deaths at these ages. CRS, Civil Registration System; SRS, Sample Registration System.
Ratios of age-category probabilities of death in women from CRS and SRS by state in 2017. *As estimated according to the Office of the Registrar General of India method. †High ratios are influenced by the very low numbers of SRS deaths at these ages. CRS, Civil Registration System; SRS, Sample Registration System.
Figures 3 and 4 show the differentials between CRS and SRS death probabilities at ages 30–69 years, for states with CRS measures that are similar to or higher than the SRS. The 95% CIs also display the influence of limited size of the SRS sample, in terms of the low precision of the estimates. The graphs indicate that the SRS appears to be grossly underestimating adult mortality risks in many states in both sexes. For males, 15 states show higher CRS death probabilities, with statistically significant differences in 10 of these states. In females, the differences are statistically significant in 6 out of 10 states with higher CRS death probabilities. As mentioned before, the SRS variance measures do not account for cluster specific death count variations, since these data were not available. Measurement of this additional error would increase the 95% CIs for the SRS estimates and accentuate the already low levels of precision in SRS age-specific mo rtality risks. This would further limit the utility of the SRS estimates for understanding levels, trends and differentials across the states. On the other hand, the very narrow 95% CIs for CRS mortality risks for all states suggest that the CRS sample sizes are likely to be adequate for reasonably precise measurement of these indicators even at district level.

Comparisons of risk of dying between 30 and 69 years from CRS and SRS for men in India and selected states, 2017. CRS, Civil Registration System; SRS, Sample Registration System.

Comparisons of risk of dying between 30 and 69 years from CRS and SRS for women in India and selected states, 2017. CRS, Civil Registration System; SRS, Sample Registration System.
Medical certification of cause of death
An assessment of the availability and quality of reported causes of death provides an epidemiological perspective of the utility of data from the CRS. Table 3 shows the information cascade under the MCCD scheme of the CRS for 2017. It can be readily perceived that there is considerable heterogeneity in reporting performance across states. At one level, only 71% of registered hospitals across the country are covered under the MCCD scheme, with markedly low administrative coverage (<10%) in Bihar, Kerala and Uttarakhand, and only about 30% coverage in Punjab, Haryana and West Bengal. Further, this variable was not reported for 2017 from several larger states, including Jammu and Kashmir, Jharkhand, Madhya Pradesh and Uttar Pradesh. At the next level, there is equal concern arising from the widespread shortfall in submission of MCCD data by the covered hospitals across all states in 2017. Among the larger states, only Assam, Goa, Maharashtra and Rajasthan achieved a 100% institutional reporting coverage. Very low institutional reporting coverage (<50%) was observed from Andhra Pradesh, Gujarat, Haryana, Himachal Pradesh, Telangana and West Bengal. This variable could not be computed for several other large states notably Madhya Pradesh and Uttar Pradesh because of missing data, although about 9% of deaths are registered with an MCCD in these two states. In all these instances, hospital deaths are being registered using only the death report form (form 2), without the accompanying MCCD which is actually required for registration of physician-attended deaths. The net effect of these shortfalls in administrative and reporting coverage results in only 22% of registered national deaths in 2017 being registered along with a medically certified cause of death, with a range from 5% in Jharkhand to 100% in Goa. Another parameter for assessing data quality is the percentage of deaths certified with only symptoms or non-specific terms, such as senility, as causes of death, for which the conventional international threshold is 10%.29 The values ranged from 1% to 43% across the country and were above the threshold of 10% in 14 out of 36 states/union territories.
Reporting performance of the MCCD, 2017
Finally, to envisage the potential reach of the MCCD scheme, table 3 also reports for each state the estimated proportion of deaths that had received medical attention in a government or private hospital immediately before death. These estimates were reported by the SRS for 2017, which captures this information for every death recorded by the system. The national average for this variable is 44%, with most states reporting values closely clustered around the national average. This suggests that a well-functioning MCCD scheme could readily double the proportion of nationally registered deaths with medically certified causes, which would considerably improve the overall utility of cause-specific mortality data from the CRS.
Discussion
The analyses presented here establish several important facts about the status of current mortality statistics programmes in India and provide a scientific basis for specific interventions to improve data quality to meet these needs. An important preliminary finding is that the SRS underestimates mortality risks for ages between 30 and 69 years in several states, and this is a cause of concern, given the need for accurate mortality measurement in this age group to address the burden from non-communicable diseases27 This is coupled with the poor levels of precision of these indicators from the SRS as seen in figures 3 and 4, arising from grossly insufficient sample size. This precludes the reliable assessment of mortality differentials across states or over time, based on SRS data. It should also be noted that these deficiencies in sample size of the SRS would be accentuated when more detailed analyses of causes of death are undertaken with SRS data.
On the other hand, the CRS provides a distinct advantage in terms of precision, owing to the enhanced effect of total population coverage of the system, which eliminates sampling error. Moreover, the very high levels of reporting coverage coupled with high estimated completeness for most states as reported in table 2 effectively support an inference of better precision and reliability of CRS measures of adult mortality. Even for states with lower levels of estimated completeness, the large numbers of registered deaths suggest the potential for some districts within these states to have better levels of completeness (>85%), which would enable more reliable estimation of adult mortality for these districts. From a health policy perspective, the higher than expected levels of adult mortality observed from CRS data indicate a greater need for strengthening health systems and programmes for the control of non-communicable disease and other major causes of adult deaths in India.30
At the same time, it should also be noted that our estimates from CRS data could be biassed on account of delayed registration, arising from deaths that actually occurred in previous years being registered and counted as deaths in 2017. This information is not available for all states (see table 1), and hence the effect of this parameter could not be evaluated at national level. However, these proportions are relatively low for most states that provided these data. Also, similar trends in delayed registration were observed from previous annual CRS reports during 2014–2016, potentially resulting in a similar carry-over of deaths from year to year, which would minimise the potential for bias from delayed registration on CRS mortality measures for 2017. Another source of bias is the use of methods of interpolation to derive age distributions of deaths for some states, notably the larger states of Bihar, Jharkhand, Uttar Pradesh and Uttarakhand. Although, these states are shown to have low levels of CRS completeness, and we believe that interpolation of age distribution of deaths for these states would not have altered our inferences for the main thematic indicator of this evaluation.
From an administrative standpoint, table 2 demonstrates the huge scope and magnitude of CRS operations in India, as inferred from the availability of infrastructure deployed across 284 671 primary registration units, which implement standardised operations for death registration, despite the heterogeneity of structure and design at state and local levels.10 This is combined with apparently efficient processes for management and compilation of registration data in most states, resulting in timely reporting and dissemination of vital statistics within 18–20 months of the reference period. Even though the performance of the MCCD scheme shows several gaps in administrative as well as reporting coverage, over 1.4 million deaths are registered annually with a medically certified cause. Also, the reporting of MCCD data from all states is indicative of the presence of local capacity across the country, and hence potential for decentralised scaling up of system strengthening interventions.
Despite these structural advantages, there are several key limitations of both registration and statistical operations in the CRS. For instance, it is clearly evident that there is under-reporting of child deaths. One potential reason could be the length of the reporting period for birth registration, which is 21 days. Since the majority of infant deaths occur within the first 3 weeks, this limits the likelihood of bereaved families to report both the birth and death. For this reason, an alternate reporting model could be developed, through involvement of health sector institutions and staff in active notification of infant deaths. There is also a need to conduct social science research to investigate factors for the apparently lower levels of female death registration in most states. Next, mortality measures are not reliable for states with reporting coverage and/or estimated completeness levels which are less than 80%. These states would require a detailed assessment of the design, resources, management and operations of the CRS at state level, according to a standard international framework for such assessments.31 Where feasible, a thorough evaluation of district level mortality indicators should be undertaken according to the methodology reported here, to identify nodes that require specific attention through system strengthening interventions and capacity building programmes.32
A third key limitation lies in the performance of the MCCD scheme, ranging from low reporting coverage of hospitals to low quality of reported causes of death in some states. To address gaps in reporting coverage, the registrar–general of India has issued instructions in 2014 to extend the MCCD scheme to cover all government, private and not-for-profit medical institutions across the country, including a special note to maintain updated lists of such medical institutions in each state.33 A targeted initiative is required to implement these instructions, along with close monitoring of MCCD reporting in all states, which would help close the gap between the estimated percentage of deaths that occur under medical attention and those registered along with an MCCD, as shown in table 3. These efforts would also need to be supported by teaching programmes to strengthen quality of cause of death certification for better epidemiological surveillance.34 35
To improve the overall quality of cause attribution at death registration, there is also an urgent need to implement VA methods for home deaths without medical attention. As demonstrated by the SRS and its precedent version in the erstwhile ORGI Survey of Cause of Death Scheme in Rural areas (SCD-Rural)which operated during 1965–1999, there is considerable experience in using VA methods across India.4 7 In particular, the SCD-Rural Scheme demonstrated a viable working collaboration between the administration and health sectors at the level of the primary health centre (PHC). Currently, each PHC serves an average of 25 000 population, with about 150–200 deaths each year. Considering that about 20% of these deaths would have a medically certified cause, this would leave the PHC staff with a VA workload of about three cases per week, which appears logistically feasible, when shared across subcentres. This PHC-based model for rural areas could be combined with a strategy for using VA for deaths occurring without medical attention in urban areas.
These VA activities should be embedded within a broader CRS strengthening initiative, which also includes activities to improve registration completeness, medical certification, and data management and analysis for local empirical mortality measurement.36 Adequate and representative samples of rural PHCs and urban municipalities in each state could be selected for the initial phase of system strengthening activities.37 Such an initiative would be well within the scope of the recent ORGI instructions to strengthen infant death recording, closely monitor registration levels, and calculate vital rates at state and district level commencing from 2018.38 These instructions include a justification that CRS data are ‘exact and real data certified by registering authorities and are therefore legally admissible’ for such calculations.38
Conclusions
In conclusion, the analyses presented in this article demonstrate that India’s CRS has major strengths in infrastructure, reporting coverage, data completeness and management. In several states, these strengths also translate into more reliable CRS-based adult mortality risks than those from the SRS, hence establishing reliable mortality baseline measures for monitoring non-communicable disease mortality at state and district level in India. Looking forward, there appears to be sufficient political will and support for further reforms to strengthen local registration and statistical operations, as well as medical certification of causes of death, in the form of recent government regulations on these subjects. All these observations indicate that with appropriately designed system strengthening initiatives, the Indian CRS could be able to serve its goal as a reliable source for national and subnational vital statistics in the near future.
Acknowledgments
The authors acknowledge Aashish Gupta (University of Pennsylvania) for guidance on the methodology for estimating the variance of summary mortality indicators derived from the Sample Registration System.
References
Footnotes
Handling editor Sanni Yaya
Contributors CR conceptualised the research, led the data analysis and drafted the initial version of the manuscript. MG contributed to the data analysis and interpretation and to the development of the final version of the manuscript.
Funding The authors have not declared a specific grant for this research from any funding agency in the public, commercial or not-for-profit sectors.
Competing interests None declared.
Patient and public involvement Patients and/or the public were not involved in the design, conduct, reporting or dissemination plans of this research.
Patient consent for publication Not required.
Provenance and peer review Not commissioned; externally peer reviewed.
Data availability statement Data are available in a public, open access repository. All data used for this research is available in the public domain, and appropriate links are provided in the list of references.