Article Text

Abstract
Objectives The objectives were to evaluate the effectiveness of conducting three versus two reverse transcription-PCR (RT-PCR) tests for diagnosing and discharging people with COVID-19 with regard to public health and clinical impacts by incorporating asymptomatic and presymptomatic infection and to compare the medical costs associated with the two strategies.
Methods A model that consisted of six compartments was built. The compartments were the susceptible (S), the asymptomatic infective (A), the presymptomatic infective (L), the symptomatic infective (I), the recovered (R), and the deceased (D). The A, L and I classes were infective states. To construct the model, several parameters were set as fixed using existing evidence and the rest of the parameters were estimated by fitting the model to a smoothed curve of the cumulative confirmed cases in Wuhan from 24 January 2020 to 6 March 2020. Input data about the cost-effectiveness analysis were retrieved from the literature.
Results Conducting RT-PCR tests three times for diagnosing and discharging people with COVID-19 reduced the estimated total number of symptomatic cases to 45 013 from 51 144 in the two-test strategy over 43 days. The former strategy also led to 850.1 quality-adjusted life years (QALYs) of health gain and a net healthcare expenditure saving of CN¥49.1 million. About 100.7 QALYs of the health gain were attributable to quality-adjusted life day difference between the strategies during the analytic period and 749.4 QALYs were attributable to years of life saved.
Conclusions More accurate strategies and methods of testing for the control of COVID-19 may reduce both the number of infections and the total medical costs. Increasing the number of tests should be considered in regions with relatively severe epidemics when existing tests have moderate sensitivity.
- health economics
- pneumonia
- PCR
- mathematical modelling
This is an open access article distributed in accordance with the Creative Commons Attribution Non Commercial (CC BY-NC 4.0) license, which permits others to distribute, remix, adapt, build upon this work non-commercially, and license their derivative works on different terms, provided the original work is properly cited, appropriate credit is given, any changes made indicated, and the use is non-commercial. See: http://creativecommons.org/licenses/by-nc/4.0/ .
Statistics from Altmetric.com
Key questions
What is already known?
The sensitivity of COVID-19 reverse transcription-PCR (RT-PCR) tests is moderate, compounding the challenge of containing the pandemic that is already complicated due to asymptomatic and presymptomatic infectivity of SARS-CoV-2.
What are the new findings?
Conducting RT-PCR tests three times versus two times for diagnosing and discharging people with COVID-19 may reduce the number of infected individuals with a net saving of costs.
What do the new findings imply?
Improving the sensitivity of test strategies is important to suppress the pandemic. To that end, increasing the number of tests is an economically viable approach.
Introduction
A total of 80 813 COVID-19 cases have been reported in China as of 6 March 2020, over 60% of which were located in the epicentre of Wuhan city.1 The virus underlying COVID-19, SARS-CoV-2, was estimated to have a basic reproduction number (R0) between 1.4 and 6.5 without any intervention, which represented stronger transmissibility than SARS-CoV and MERS-CoV.2–4 This has been reflected by the rapidly increased numbers of both confirmed cases and affected countries in the past two months globally.2 To contain the epidemic, a city travel ban was enforced in Wuhan on 23 January 2020, an action that was soon followed by many other cities in Hubei province.5
Since the initial outbreak, asymptomatic carriers of the virus and related infections have been reported in several studies.6–9 In the wake of these findings, it was suspected that asymptomatic and presymptomatic infectivity might have accounted for significant portions of the spread of the disease.2 If so, prevention and containment of the ongoing epidemic can be challenging, not only in China but also in other countries. Moreover, it calls for attention to the reliability of diagnostic tests because inaccurate tests may result in non-quarantined infectors due to both case identification failures and premature discharges. In fact, premature releases of potentially infectious yet clinically recovered individuals have already been spotted in China.10
At present, reverse transcription-PCR (RT-PCR) is recommended as the standard for COVID-19 confirmation by the Chinese Center for Disease Control and Prevention (CCDC).10 However, the accuracy of RT-PCR was called into question by recent analyses which estimated the sensitivity of RT-PCR to be 30%–70%.11 12 Earlier than that, healthcare professionals already circulated anecdotal evidence that the sensitivity of RT-PCR was around 30%–50% and some professionals called for three tests to diagnose and discharge people with COVID-19.13 In response, the China National Health Commission deleted the explicit statement of two consecutive negative RT-PCR results as a conclusive dismissal of suspected cases from the ‘Guidance for the Diagnosis and Treatment Plan of Coronavirus Virus Disease 2019’ starting from the tentative sixth edition since clinicians may be overconfident about the adequacy of two tests, although such standards are still in effect for the discharge of patients.14
With only suboptimal diagnostic tools available, healthcare professionals can increase the detection rate of diagnoses by conducting additional tests. However, the costs of RT-PCR tests to the healthcare system cannot be ignored, necessitating the evaluation of incremental costs against the additional benefit. To our knowledge, such an evaluation is still absent. In the meantime, it is crucial for public health policymakers to consider the health benefit of reduced infections when investigating the effectiveness and costs of interventions on contagious diseases. For COVID-19, this entails that the impact of the interventions on asymptomatic and presymptomatic transmission should also be incorporated. By constructing a deterministic compartment model that allowed asymptomatic and presymptomatic transmission, we aimed to carry out a cost-effectiveness analysis of conducting three versus two RT-PCR tests for diagnosing and discharging people with COVID-19 based on epidemic data from Wuhan, China.
Of note, the issue of false-negative results with two separate tests has been reported outside of China as well.15 Evidence from the present study may therefore also inform test strategy planning in other countries. For example, many countries in South East Asia, South Asia, Middle East and Europe rely heavily on test kits imported from China; they may, therefore, face similar challenges of testing accuracy.16 Moreover, experts in certain countries with sufficient domestic supply of test kits, for example, the USA, shared the concern of the suboptimal accuracy of RT-PCR tests, appealing for the development of tests with higher sensitivity.17 These countries may face similar questions of whether to increase the number of tests.
Methods
Epidemic model
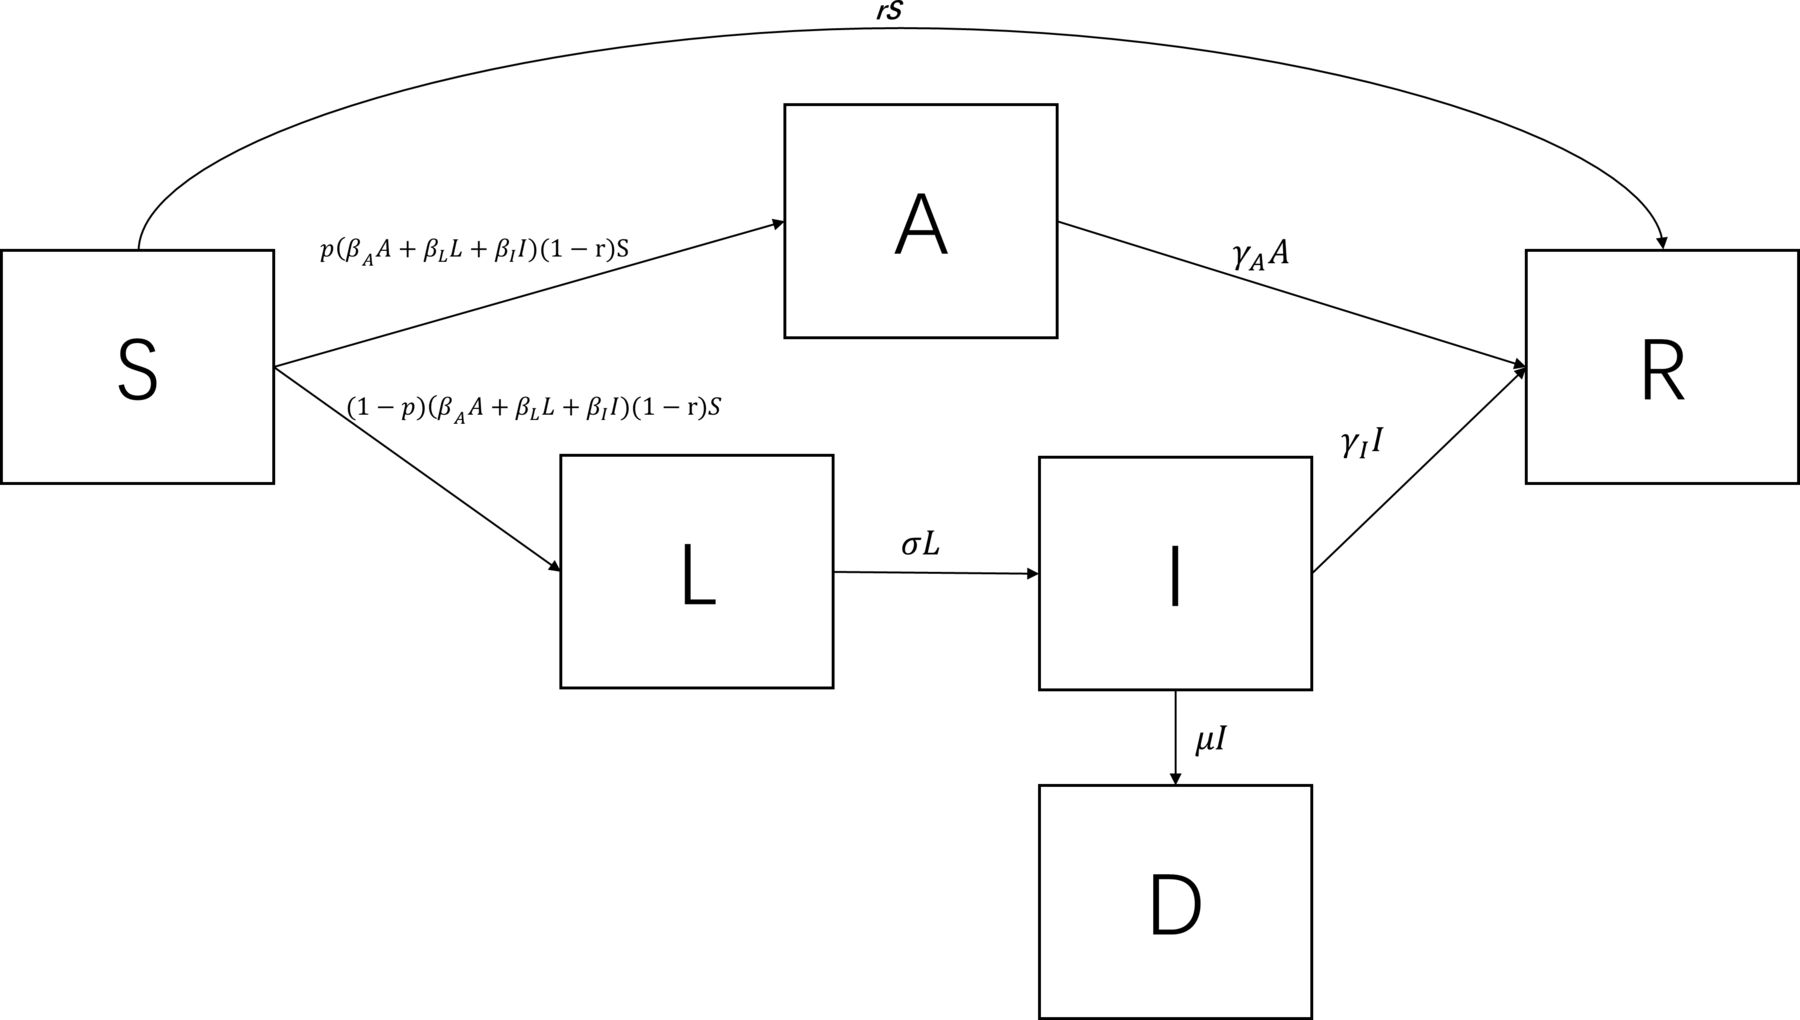
To reflect the potential transmission patterns of SARS-CoV-2, it is important to incorporate asymptomatic and presymptomatic infectivity. To that end, a deterministic compartment model was constructed which represented an extension from the conventional Susceptible-Exposed-Infected-Recovered (SEIR) model.18 The extended model consisted of six compartments, namely, the susceptible class (S), the asymptomatic infective class (A) in which the individuals never developed symptoms, the presymptomatic infective class (L), the symptomatic infective class (I), the recovered class (R) and the deceased class (D). It follows that the total number of individuals (N) in a closed system equals S+A+L+I+R+D. The structure and the parameters of the model are displayed in figure 1. In this model,  ,
,  , and
, and  represent the transmission rate of the A class, the L class and the I class, respectively. Therefore, the force of infection is
  . An exposed individual immediately enters into either the asymptomatic infective class with a probability of
p
or the presymptomatic infective class with a probability of
. An exposed individual immediately enters into either the asymptomatic infective class with a probability of
p
or the presymptomatic infective class with a probability of  . The L class envelopes several subclasses including a non-infectious period after exposure, a period of being fully asymptomatic and a period of presenting subclinical symptoms. However, data on the duration or proportion of each subclass are still lacking in the literature. Hence, the L class represents the average profile of the three subclasses. Individuals in the L class transit to the I class at the rate of
σ
, whereas individuals in the A and I classes recover at the rates of
. The L class envelopes several subclasses including a non-infectious period after exposure, a period of being fully asymptomatic and a period of presenting subclinical symptoms. However, data on the duration or proportion of each subclass are still lacking in the literature. Hence, the L class represents the average profile of the three subclasses. Individuals in the L class transit to the I class at the rate of
σ
, whereas individuals in the A and I classes recover at the rates of  and
and  , respectively. Also, individuals in the I class are subject to a case fatality rate of
μ
. The analysis did not factor in the birth rate and the background mortality rate because their impacts were relatively limited in a short time frame. The definitions of the parameters are summarised in table 1. In what follows, the system is referred to as SALIR. The flow of the SALIR system can be described using the following ordinary differential equations (ODEs):
, respectively. Also, individuals in the I class are subject to a case fatality rate of
μ
. The analysis did not factor in the birth rate and the background mortality rate because their impacts were relatively limited in a short time frame. The definitions of the parameters are summarised in table 1. In what follows, the system is referred to as SALIR. The flow of the SALIR system can be described using the following ordinary differential equations (ODEs):
 (1a)
(1a)
 (1b)
(1b)
 (1c)
(1c)
 (1d)
(1d)
 (1e)
(1e)
 (1f)
(1f)

The structure of the SALIR deterministic compartment model.
Parameters of the discrete-time SALIR transmission model
The basic reproduction number
Although not directly used as a parameter of the economic evaluation, we present here the derivation of the formula for the basic reproduction number, or R0, because it is a fundamental metric of the transmissibility of an epidemic.19 The R0 of the proposed SALIR system can be derived using the next-generation matrix method.18 19 The at-infection states in the system are A, L and I, which we denote as the vector  . The derivative of
  with respect to time is
 (2)
(2)
where  contained the new infections flowing into each of the at-infection compartments and
  contained all inputs and outputs of the at-infection compartments other than the new infections.
  is, therefore,
 (3)
(3)
To linearize around the disease-free equilibrium (DFE), which is (S*, A*, L*, I*) = (N, 0, 0, 0), the Jacobian matrices of  and
and  were taken. The Jacobian of
  at DFE takes the form F=
 (4a)
(4a)
and the Jacobian of  at DFE takes the form V=
 (4b)
(4b)
It follows that V-1=
 (5)
(5)
Therefore, FV-1=
 (6)
(6)
To determine the eigenvalues of FV-1, we use the characteristic equation det(FV-1-λI)=0, where λ denotes the eigenvalues and I is the identity matrix. FV-1-λI=
 (7)
(7)
Following this, it can be shown that det(FV-1-λI)=
 (8)
(8)
Setting equation (8) equal to zero, three eigenvalues can be obtained. The largest of them is the R0 of the SALIR system, which is given by

where
u=  ,
,
v=  ,
,
w=  ,
,
x=  ,
,
y=  ,
,
and z= .
.
Model structure modification
The model proposed above could not reflect the tailing off of growth when the total number of confirmed cases in Wuhan started to level off at around 50 000 individuals. In fact, the relatively small ratio of cases to the total population cannot be explained by reduced contacts in a well-mixed population. For example, Hou et al showed that it remained the case that the majority of people in Wuhan would be infected when the daily contact rate was toggled from 18 to 6 in a well-mixed SEIR model, although the peak time would shift out.20 To allow such a flattened trend, the original SALIR model structure was modified to incorporate social distancing. Since a dominant proportion of the families as well as communities in Wuhan adopted a high awareness of the virus and picked up strict social distancing practices and even self-isolation, we allowed a proportion of the S class individuals to move directly to the R class in each daily time step to reflect such risk-reducing measures by assuming that these individuals were not at risk during the analytic period. In this case, the R class stood for ‘recovered/removed’. The altered structure is illustrated in figure 2, where r was the proportion of S directly moving to R per day. This model structure was used as the frame of the economic evaluation. To describe the modified structure, equations (1a), (1b), (1c) and (1e) need to be replaced with equations (1a′), (1b′), (1c′) and (1e′) as below:

The structure of the modified SALIR model allowing the removal of susceptible individuals by social distancing.
 (1a′)
(1a′)
 (1b′)
(1b′)
 (1c′)
(1c′)
 (1e′)
(1e′)
Parameter estimation
To estimate the parameters of the model in figure 2, it was necessary to set some of the parameters as fixed and infer the rest of the parameters by fitting the simulated data to the observed data.21 When accessible from the literature, including both the peer-reviewed literature and the grey literature such as the preprint servers, the parameters were set as fixed. In the present study, the fixed parameters included
p
,
σ
,
μ
and  . Data from the Diamond Princess cruise ship suggested that about 17.9% of the cases were asymptomatic throughout the infection episode, which was used as the value for
p
.22 Also, a study by CCDC estimated
μ
to be 0.0015/person-day.8 In addition, several studies estimated either the mean or the median of the latent period to be around 5 days,23–25 so
σ
was set at 1/5=0.2. A study reported the mean institutionalised duration of 17 days in Wuhan, China,26 which gave rise to an estimated
. Data from the Diamond Princess cruise ship suggested that about 17.9% of the cases were asymptomatic throughout the infection episode, which was used as the value for
p
.22 Also, a study by CCDC estimated
μ
to be 0.0015/person-day.8 In addition, several studies estimated either the mean or the median of the latent period to be around 5 days,23–25 so
σ
was set at 1/5=0.2. A study reported the mean institutionalised duration of 17 days in Wuhan, China,26 which gave rise to an estimated  of 1/17.
The rest of the parameters were estimated by minimising the sum squared residuals (SSR) of the simulated and observed numbers of cumulative confirmed cases over time. However, the model was not fit to the originally observed curve in Wuhan. There were a couple of spikes in the number of confirmed cases in Wuhan as a result of artificial interruption including a sudden increase in improved availability of tests and an interim change of diagnosis criteria, which led to a fuzzy curve.27 28 Therefore, we first estimated a three-parameter logistic growth curve using the observed data on the cumulative confirmed cases from 23 January 2020 up to 6 March 2020 to smooth the epidemic curve, which was conducted in Stata V.15.1 Then, we inferred the SALIR parameters by fitting the simulated output to the predicted values of the estimated growth curve for the same period by setting 23 January 2020 as the initial state. The model simulation mandated the imputation of the numbers of individuals in classes A, L and I at the initial state. The corresponding numbers were calculated using the respective ratios to the number of cumulative confirmed cases. These values are listed in table 1. It was assumed that the observed number of confirmed cases corresponded to the number who had been in the I class of the model because asymptomatic and presymptomatic individuals were unlikely to be captured by the healthcare system.
The subsequent economic evaluation requested accrual of quality-adjusted life days (QALDs) over time by summing the time spent in each compartment weighted by health utility scores. The same process was also necessary for costs. Thus, the epidemic courses for the economic evaluation might be more conveniently represented by discrete-time processes than the ODEs for ease of costs and QALD calculation. Therefore, a discrete-time analogue of the ODEs that had daily cycles was modelled for the economic evaluation. To calibrate the discrete-time model parameters, a two-step approach was adopted. First, the parameter estimates of the ODE version of the model were obtained from a non-linear least squares procedure using the ‘SciPy’ and ‘lmfit’ packages in Python V.3.6. Second, the ODE model estimates were used as initial values in a grid search for the discrete-time model estimates,29 the implementation of which was programmed in Oracle Crystal Ball V.11. The set of parameters with the least SSR was used subsequently.
Economic evaluation
The economic evaluation was conducted from the healthcare system perspective. The same time frame for parameter calibration was used. Due to the relatively short time frame, outcomes within the simulated period (23 January 2020–6 March 2020) were not discounted. The outcomes of interest in the present analysis were incremental costs and incremental quality-adjusted life years (QALYs). Costs were in 2020 Chinese currency. The incremental QALYs could be decomposed into two sources, namely, the increased QALDs due to fewer sick days of the population and the reduced QALY loss due to fewer years of life lost (YLL). However, the present study did not simulate the lifetime of the population. Only accruing outcomes that were tracked in 43 days of the epidemic course substantially undercounts the benefit of reduced mortality associated with the three-test strategy. Hence, a fixed amount of QALY loss was attached to each death. Based on the age distribution of the deceased patients, we estimated that their mean age was 69 years.8 In the meantime, the life expectancy of Chinese was about 77 years in 2019.30 Using an annual discount rate of 5% per the China Guideline for Pharmacoeconomic Evaluation,31 each life lost was assigned a discounted QALY loss of 7.11 QALYs. Following that, the increased QALDs were converted to QALYs and then summed with the difference in QALY loss to calculate the incremental cost-effectiveness ratio (ICER). The threshold of the incremental costs/QALY was considered once the gross domestic product per capita of China in 2018 at CN¥64 644.32 If the two-test strategy was dominated, which means that it incurred higher total costs and fewer QALYs, then the net monetary benefit (NMB) was used in place of ICER. NMB was calculated as costs saved+incremental QALYs×CN¥64 644.
Because of possible false-negative results, the incremental benefit of more accurate tests pertained to fewer individuals who were neither diagnosed nor quarantined as well as fewer patients who were discharged prematurely. As such, it was important to embed into the model corresponding compartments when conducting the economic evaluation. Ideally, the model structure in online supplementary figure A1a (online supplementary materials) should be used, which could explicitly separate the I class into a compartment for fully quarantined and another compartment for the rest of I class (not diagnosed due to false-negative results, at-home isolation, not quarantined although diagnosed and failed quarantine efforts). In practice, the proportions of the two subclasses within I class were unknown. Hence, the model structures in online supplementary figure A1b and A1c were used for the courses of conducting tests twice and three times, respectively. Each of the courses contained a compartment that represented the status quo of the I class which was a mix of the subclasses mentioned earlier, whereas the course for three tests also counted the increased number of diagnosed and quarantined individuals. Such alteration still allowed the evaluation to track the numbers of additionally fully quarantined patients and reduced premature discharges that were attributable to the increased detection rate.
Supplemental material
Based on available evidence, the false-negative rate of a single RT-PCR test was set at 29% in the base case, which is equivalent to a sensitivity of 71%.12 Also, the cost of RT-PCR test kits for COVID-19 in China was based on the charge in Hubei province.33 Moreover, the daily hospitalisation costs of the fully quarantined individuals were from a published study on the healthcare resource utilisation of 105 patients with COVID-19 in Shenzhen, China.34 However, such costs only applied to additionally fully quarantined individuals. In the absence of related data, the daily costs of the mixed profiles of the I class were assumed to be 80% of the costs of the fully quarantined individuals. Productivity costs were not included to avoid double counting of the benefit of more sensitive tests.35 Even more, data on health utility weights of the patients with COVID-19 were not available to date. Hence, the average utility score of patients with severe and mild symptomatic influenza in China was used.36 It was also necessary to input to the model the fraction of patients per day who were tested for discharges, which has not been documented so far. However, the tentative guidance in China recommended negative results of two tests on two consecutive days. Hence, we assumed that tests for discharges happened on the 15th day after diagnosis on average since the mean hospitalisation duration was 17 days. The input values are shown in table 2.
The input values of the economic evaluation
To account for potential inaccurate estimates of the parameters, one-way sensitivity analyses (OWSAs) were conducted. The parameters that were varied in OWSAs and the magnitude of changes are not elaborated in this section. Instead, they are shown in online supplementary figure A4 (online supplementary materials) together with the results of OWSAs. The International Society for Pharmacoeconomics and Outcomes Research and the Society for Medical Decision Making do not include probabilistic sensitivity analyses (PSAs) in their best modelling practice recommendations for transmission models, realising that many parameters have to be jointly estimated.37 Thus, PSAs were not conducted in the present study.
Patient and public involvement
It was not appropriate or possible to involve patients or the public in the design, or conduct, or reporting or dissemination plans of our research.
Results
The calibrated parameters of the discrete-time SALIR model are presented in table 1. The observed epidemic curve, the predicted three-parameter logistic growth curve and the curve based on the output of the calibrated discrete-time model are depicted in online supplementary figure A2 (online supplementary materials). The base case estimate of R0 was 5.3. More information on the ODE model parameters, the estimate of R0 and related discussion can be located in online supplementary materials.
The base case results of the economic evaluation using the SALIR framework with social distancing are presented in table 3. In the base case scenario, the strategy of conducting tests twice was dominated by conducting tests three times, dismissing the use of ICER as a cost-effectiveness indicator. According to the results, conducting RT-PCR tests three times for diagnoses and discharges would have resulted in 850.1 QALYs of health gain and a net healthcare expenditure saving of CN¥49.1 million over the analytic period in Wuhan, amounting to an NMB of CN¥104.0 million. Among the incremental QALYs, about 100.7 QALYs were attributable to the difference in QALDs over 43 days and about 749.4 QALYs were attributable to years of life saved. In addition, the estimated number of symptomatic cases by the end of the 43 days was 45 013 and 51 144 for the two-test and two-test strategies, respectively, resulting in 6131 reduced symptomatic cases associated with the three-test strategy. Moreover, the three-test strategy decreased 69 741 symptomatic sickness days during the analytic period among the population. The epidemic curves under the two different test strategies are depicted in online supplementary figure A3 (online supplementary materials).
Base case results of the economic evaluation
The NMB results of OWSAs are illustrated in online supplementary figure A4. The results were relatively responsive to changes in the fraction of individuals removed from the susceptible state per day, the sensitivity of RT-PCR tests and the transmission rate of the I class. However, the NMB remained positive in all of the OWSAs, suggesting sustained cost-effectiveness in all scenarios. Moreover, the three-test strategy was the dominant strategy in all scenarios (results not shown).
Discussion
In the present study, we proposed and developed a deterministic compartment model that allowed asymptomatic and presymptomatic infectivity to evaluate the cost-effectiveness of conducting RT-PCR tests three times for the diagnoses and discharges of COVID-19 cases compared with conducting RT-PCR tests twice. To our knowledge, economic evaluations of COVID-19 test strategies were absent in the literature. The results of the present study suggest that the three-test strategy was cost-saving compared with the two-test strategy on top of increasing QALYs in the setting of locked-down Wuhan. The results were robust in OWSAs that covered most of the parameters within the explored ranges of variation. Since the values of several parameters were based on weak evidence, the results of OWSAs were also crucial for policy implication.
Our findings have a couple of important implications. First, increasing the number of tests to control the COVID-19 epidemic can be cost-effective when the sensitivity of tests is moderate and the price of tests is a fraction of the treatment costs. In the setting of Wuhan and the rest of China, the hospitalisation duration is relatively long,26 34 leading to high medical costs. Identifying more cases and quarantining the additionally identified cases help to reduce the number of infected individuals, which eventually leads to decreased healthcare expenditure. The same rationale holds for the discharge process of patients. This is particularly important to limit the spread of SARS-CoV-2 because of its potential asymptomatic and presymptomatic infectivity. In fact, almost 10% of the infections were transmitted by asymptomatic and presymptomatic individuals according to our model. Increasing the case identification capacity, therefore, decreases the number of community-dwelling yet infective individuals who only have subclinical manifestations or cease to show symptoms. Second, efforts to increase the sensitivity of tests are warranted. Although the present study focused on comparing conducting tests three times to twice, the implication may be extrapolated to the accuracy of tests for COVID-19 overall. For example, it is likely worthwhile to develop new test technologies with increased sensitivity. To that end, we conducted a post hoc threshold analysis to further understand how the sensitivity of the test might affect the cost-effectiveness. We found that the sensitivity of the test should be at least 89% to imply cost-ineffectiveness of the three-test strategy. Third, evidence from the present study and its implications do not necessarily have to be limited to locked-down Wuhan but may apply to regions with high risks of epidemics elsewhere in the world. Specifically, many low-income and middle-income countries (LMICs) rely on Chinese-manufactured test kits.16 While it is encouraging that the test capacities of these countries have benefited from the importation of test kits from China, it is warranted that the local decision-makers consider increasing the number of tests accordingly. Although many high-income countries managed to establish strong test capacities without massive importation, the tests in these countries may still have non-trivial false-negative rates.17 The fraction of test costs out of treatment costs is likely smaller in high-income countries than in LMICs. As such, these countries may similarly find increasing the number of tests to be cost-effective.
Several limitations should be noted when interpreting the results, many of which are related to data availability. First, several fixed parameters of the epidemic models were based on preliminary estimates. These parameters might be inaccurate themselves or not representative of the true natural history of the disease. Second, the grid-search approach we used for parameter inference could not estimate uncertainty. Hence, CIs could not be provided in the present study. Third, a couple of input values of the economic evaluation were based on assumptions or imputation. However, these parameters had relatively mild impacts on the results. Fourth, the present study only considered the gain and loss within the healthcare system. The benefit of avoiding excess infection can extend to almost every sector of society. Whereas incorporating such benefits in health economic analyses is challenging for almost any infectious diseases, the results of the analyses from the healthcare perspective represents the lower bound of the benefits of interventions. Notwithstanding these limitations, the present study offers some important data for decision-making related to the test strategies of COVID-19.
Conclusions
Conducting RT-PCR tests three times for the diagnoses and discharges of COVID-19 cases is cost-effective compared with conducting RT-PCR tests twice in the setting of locked-down Wuhan. When existing tests have moderate detection rates, regions facing severe epidemics of COVID-19 should consider intensifying diagnostic tests and methods such as increasing the number of tests.
References
Footnotes
Handling editor Seye Abimbola
Contributors Conceptualisation, design, data collection, analysis and writing: YJ. Data collection and analysis: D Cai. Data collection: D Chen. Analysis and writing: SJ.
Funding The authors have not declared a specific grant for this research from any funding agency in the public, commercial or not-for-profit sectors.
Competing interests None declared.
Patient and public involvement Patients and/or the public were not involved in the design, or conduct, or reporting or dissemination plans of this research.
Patient consent for publication Not required.
Provenance and peer review Not commissioned; externally peer reviewed.
Data availability statement Data are available on request. The data analysed during the current study are publicly available from the website of China National Health Commission or included in this article. The code and modelling files that support the findings of this study are available from the corresponding author on reasonable request.