Article Text

Abstract
Background The most ambitious sanitation campaign to end open defecation (OD) in India came to a close on 2 October 2019 and there are limited independent, robust data to measure its success. We aimed to evaluate Rajasthan’s claim of open defecation free status in March 2018 under the Swachh Bharat Mission (SBM) or ‘Clean India Mission’ by measuring OD trends from 2016 to 2018.
Methods We used publicly available data from Performance Monitoring and Accountability 2020, a representative survey with two-stage stratified cluster sampling. Enumeration areas were the primary sampling units selected by the probability proportional to size method. The repeated cross-sectional surveys independently collected household water and sanitation data in Rajasthan (n=20 485). Among households reporting toilet access, the data were pooled across the four rounds for an observational analysis using logistic regression. The primary outcome measure was regular OD among households with access to toilet facilities.
Findings Between October 2016 and July 2018 main OD practices in rural Rajasthan households decreased from 63.3% (95% CI 57.0% to 69.6%) to 45.8% (95% CI 38.4% to 53.2%) and in urban households from 12.6% (95% CI 6.0% to 19.1%) to 9.4% (95% CI 4.0% to 14.7%). Households with regular OD occurring despite access to a toilet made up 21.7% (95% CI 16.9% to 26.6%) of rural and 12.1% (95% CI 3.6% to 20.7%) of urban Rajasthan as of July 2018. The multivariate logistic regression revealed that factors related to water stress and sanitation sharing were associated with household members regularly practising OD.
Conclusions These data highlight the importance of a continued focus on constructing toilets that are affordable with low water requirements during the next phase of SBM. An independent survey that can provide robust estimates of OD is needed to monitor progress of toilet construction and use.
- cross-sectional survey
- environmental health
- public Health
This is an open access article distributed in accordance with the Creative Commons Attribution Non Commercial (CC BY-NC 4.0) license, which permits others to distribute, remix, adapt, build upon this work non-commercially, and license their derivative works on different terms, provided the original work is properly cited, appropriate credit is given, any changes made indicated, and the use is non-commercial. See: http://creativecommons.org/licenses/by-nc/4.0/.
Statistics from Altmetric.com
Key questions
What is already known?
Since the 2014 initiation of the Swachh Bharat Mission (SBM) in India there has been limited independent monitoring of toilet construction to measure success of the campaign at scale.
Rajasthan state, within the rural areas, was declared open defecation free (ODF) in March 2018.
What are the new findings?
Evidence to assess SBM from a large, randomly sampled statewide household survey in Rajasthan found open defecation practices decreased from 63.3% in October 2016 to 45.8% in July 2018 among rural Rajasthan households.
In July 2018 an additional 21.7% of rural households with a toilet facility reported that at least one member continues to openly defecate.
What do the new findings imply?
There is a need for credible, independent monitoring that can offer robust, statewide representative estimates to measure outcomes towards an ODF India.
Continued investments are needed to ensure that toilet construction will be affordable and continue into the post-SBM future.
Introduction
Open defecation (OD) is a widespread and persistent practice in India that spreads diarrhoeal disease1 accounting for an estimated 13% of the deaths in India,2 creates undignified and unsafe conditions for women and girls,3–7 transmits community-acquired multidrug resistant infections across borders,8 and contaminates the environment.9 The majority of the world’s OD takes place in India. As of December 2015, almost two-thirds of the 892 million people worldwide still practising OD were estimated to be in India.10 The Government of India was motivated to end OD entirely and in 2014 initiated the Swachh Bharat Mission (SBM) or ‘Clean India Mission’. The goal of SBM was to accelerate sanitation coverage so all households have access to a toilet and eliminate OD by October 2019, designed to coincide with Mahatma Gandhi’s 150th birthday.
Toilet construction is a critical element of SBM. Under the programme over 100 million toilets have been built as of the close of the first phase of SBM on 2 October 2019 and almost all states in India have been declared open defecation free (ODF) as documented by the real-time, publicly available data on the SBM dashboard.11 Rajasthan state, where nearly eight million toilets were constructed in rural households, was declared ODF in March 2018. The progress made to construct toilets and reduce OD in India over the past 5 years has been remarkable, however the claim that OD has ended is in question. Estimates as of late 2018, found that 53% of individuals in rural areas still openly defecated, indicating that Rajasthan had not yet achieved ODF status.12 Ongoing monitoring of toilet coverage and use is key to ensuring long-term sustainability of ODF in Rajasthan. Since 2016, Performance Monitoring and Accountability 2020 (PMA2020), in collaboration with the Indian Institute of Health Management Research University (IIHMR), has collected state-wide data on the practice of OD in Rajasthan on an independent basis. PMA2020 was created to provide rapid and frequent estimates of family planning outcomes and provided an ideal opportunity to also monitor SBM.13 In Rajasthan the PMA2020 survey was designed to be representative of the state and collected household water, sanitation and hygiene (WASH) data on a semiannual basis.
The objective of this study was to investigate the OD trends in Rajasthan during SBM from 2016 to 2018 and analyse the main household characteristics associated with OD practices in households with access to toilet facilities. This was achieved using a pooled cross-sectional analysis from four survey rounds that collected household data on the WASH characteristics and the OD practices of individuals in the household.
Methods
Setting
Rajasthan is the seventh most populous state in India and is categorised as one of the seven low income states (LIS) with 69 million people of whom 10 million are categorised as poor.14 The urban versus rural breakdown of the population as of 2011 is 25% urban versus 75% rural with a modest rural to urban migration rate of 6.2% as a per cent of the urban population.15 Among the LIS, Rajasthan stands out as having made exceptional reductions in poverty driven by economic growth that had a stronger impact on poverty reduction than is seen in other LIS states. According to the 2011 Census, Rajasthan had the sixth highest rate of OD at 65.0%, inclusive of both urban and rural.16 Rajasthan is considered one of the most water scarce states in India due to high frequency of droughts, extremely low and erratic rainfall, and very limited surface water sources. The per capita water availability is less than half (807 m3) of India’s national average (2000 m3) and is expected to decline to 457 m3 by 2045 moving Rajasthan into absolute water scarcity.17
PMA2020 data and household survey
The data for this evaluation came from the PMA2020 survey initiated in Rajasthan in 2016. The goal was to collect family planning and WASH data in semiannual surveys representative of the state’s entire population. PMA2020 uses a cross-sectional design with two-stage, cluster random sampling implemented by IIHMR in Jaipur, a public health research organisation with a focus on management research, education and training in the health and related sectors. The survey had endorsement and technical support provided by the International Institute for Population Sciences (IIPS) and the Ministry of Health and Family Welfare. Interviews for the surveys are conducted by female enumerators that hold at least a secondary education and are trained in the interviewing methods necessary to administer household questionnaires on WASH infrastructure and practices. Enumerators were also trained on the use of mobile phones and Open Data Kit (ODK) software to ensure proficiency in the technology that enables rapid data collection. All PMA2020 questionnaires were administered using ODK software and Android smartphones. The questionnaires were in English and could be switched into Hindi on the phone.
PMA2020 uses standardised household questionnaires that allow for comparability across programme countries and are consistent with existing national surveys. Prior to launching the survey in Rajasthan, local experts reviewed and modified these questionnaires to ensure all questions were appropriate for the Rajasthan setting. The household questionnaires were based on model surveys designed by PMA2020 staff at the Bill & Melinda Gates Institute for Population and Reproductive Health at the Johns Hopkins Bloomberg School of Public Health in Baltimore, Maryland, USA, IIHMR University in Jaipur, and fieldwork materials of the India National Family Health Survey.
Sampling strategy
The PMA2020 data collection in Rajasthan, India (PMA2016/Rajasthan) used two-stage cluster sampling from urban/rural strata with a sample of 147 enumeration areas (EAs). EAs were the primary sampling units selected by the probability proportional to size method. The master sampling frame of EAs was drawn by IIPS. To achieve a representative sample, households in each EA were listed and mapped. Field supervisors randomly selected 35 households from the household listing using a random number generation phone application. Trained enumerators completed a household roster and then visited each household to conduct an interview. If an eligible household member was available, defined as any competent member of the household able to provide accurate information on the age/marital status of every member, and on water and sanitation practices, the household questionnaire was administered. If the respondent could not answer the questions, another household member would be interviewed or enumerators would schedule a time to return. The EAs selected in Round 1 were revisited in subsequent rounds while the sample selection of households was done separately in each round.
Study design
The repeated cross-sectional surveys used were from four rounds of the Rajasthan PMA2020 survey: May–October 2016 (Round 1), February–April 2017 (Round 2), August–October 2017 (Round 3) and March–July 2018 (Round 4). Data collection overlapped with the execution of SBM, which was initiated in October 2014 and concluded on 2 October 2019. A pooled cross-sectional analysis was used by combining the data collected from all four rounds from Rajasthan during 2016–2018.
Outcome definition
The primary outcome evaluated in this analysis was reported OD practice among households with access to a toilet. Households that reported ‘no facility’ or stated that the household used the ‘bush’ or ‘field’ as their primary sanitation facility were considered main OD households, as they did not have access to a toilet facility and were not included in the analysis. Households that reported any other type of sanitation facility were considered to have access to a toilet and asked: ‘how many people within your household regularly use the bush/field (for defecation) at home or at work?’ Households that reported one or more people were considered to have household members practising regular OD. Households that reported zero members regularly using the bush/field at home or work for defecation were considered ODF.
Household variables
Survey questions collected information on household members, assets, livestock ownership, housing construction and WASH conditions. Wealth quintiles were constructed from this household information and provided in the data publicly available from PMA2020. The urban or rural designation was made based on the sampling classification. Respondents were asked to list the usual members of the household and the number of household members was considered as a categorical variable (1–3, 4–5, or 6+) for these analyses. Respondents were also asked to report the ages of all usual household members. To explore the hypothesis that older individuals are more likely to openly defecate, the maximum age in the household was included as a continuous variable. The month and year of the survey administration was included as a linear, continuous variable to account for the secular trends of OD in Rajasthan.
The household WASH conditions were defined in accordance with the Joint Monitoring Programme’s definitions of improved/unimproved access to water and sanitation.18 To determine the household’s main sanitation facility, respondents were asked: ‘what is the main toilet facility used by members of your household?’ For the purposes of these analyses, the categories for ‘flush/pour flush toilet connected to a septic tank’ and ‘flush/pour flush toilet connected to a pit latrine’ were combined into a single category to avoid misclassification. To understand if households were sharing their household sanitation facilities respondents were asked: “do you share this toilet facility with other households or the public?”. Sanitation sharing was reported as a categorical variable: not shared, shared with <10 households, shared with ≥10 households, or shared with the public.
To understand handwashing practices, respondents were asked if they had a designated place for handwashing. Those who responded yes were asked to show the enumerator the station. If a handwashing station was observed, enumerators indicated whether soap and water were present. For these analyses, handwashing was considered a categorical variable with the following options: handwashing station not observed, no soap or water, soap only, water only, soap and water. Households that reported not having a handwashing station and households that reported a handwashing station but the station was not observed by the enumerator were both categorised as ‘handwashing station not observed’.
To measure access to drinking water, a binary ‘improved’ versus ‘unimproved’ variable was used. Households that reported using piped water, tubewells/boreholes, protected dug wells, protected springs, rainwater, or packaged or delivered water including tanker trucks, carts and bottled water as their main source of drinking water were considered to use an improved water source. Households that reported using unprotected dug wells, unprotected springs or surface water as their main source of drinking water were considered to use an unimproved water source. The time required to collect water round trip from the main drinking water source was reported in minutes. Households that used piped water into the dwelling were assumed to have a water collection time of zero. Water collection time was analysed in quartiles. To assess the reliability of a water source respondents were asked: ‘at a time of year when you expect to have (reported drinking water source) is it usually available?’ and responded ‘yes, always’, ‘no, intermittent and predictable’ or ‘no, intermittent and unpredictable’.
Data analysis
OD survey data from the four rounds were weighted with probability sample weights to estimate the state-wide mean ODF, main OD, and regular OD rates and the 95% CIs. Logistic regression analyses were conducted to examine associations between regular OD practices among households with access to a toilet and various WASH-related household characteristics. Households that reported a main sanitation option other than OD were included in the analysis and households that reported main household OD were excluded. Household-level covariates included in the final model were selected based on their hypothesised relevance to the use of the household toilet as well as potential for confounding of the relationship.
Missingness of each variable of interest was assessed, and households with one or more missing data points (1.4% of households) were not included in the multivariate analysis. Each covariate included in the model was missing for less than 1% of respondents. Caste was considered for inclusion in the model and excluded because of a high rate of missingness—16.2% of respondents were missing a value for caste. Variance inflation factors were checked to assess the possibility of collinearity between variables. Survey date and survey round were highly collinear, and accordingly only survey date was included in the model to account for secular trends. These tests did not indicate any other substantial collinearity between variables of interest. Sensitivity analyses were carried out to examine OD trends among households that indicated OD as the main sanitation option, and another sanitation option secondarily. There were 238 households that fell into this category, representing 2% of 11 666 households that reported access to a toilet either primarily or secondarily. This sensitivity analysis did not reveal a substantial difference when these households were added to the analysis.
The data collected were cleaned and de-identified by PMA2020, with survey weights provided for analysis. Reproducibility and transparency in population health research relies on the public availability of source data and code.19–21 The data sets and corresponding survey instruments used in this article are free to download and may be requested through the PMA2020 website: https://www.pma2020.org/request-access-to-datasets (accessed on 29 October 2019). All analyses were conducted using the Stata V.15.1 statistical software package (StataCorp 2017, College Station, Texas, USA). All code required to reproduce the results, tables and figures found in this article is publicly available on Open Science Framework: https://osf.io/c84fm.
Patient and public involvement
This research was done without patient involvement.
Results
Sample selection
The total number of households visited in all four rounds was 20 485 (figure 1). Of the households visited, 19 683 (96.1%) consented to a household-level interview. Among these, 8134 households practised OD as their primary sanitation option and were excluded from the analysis. The 11 549 households with access to sanitation facilities were included in a pooled cross-sectional analysis to assess characteristics associated with regular OD practice.

Total number of households included in analyses.
OD trends in Rajasthan during SBM
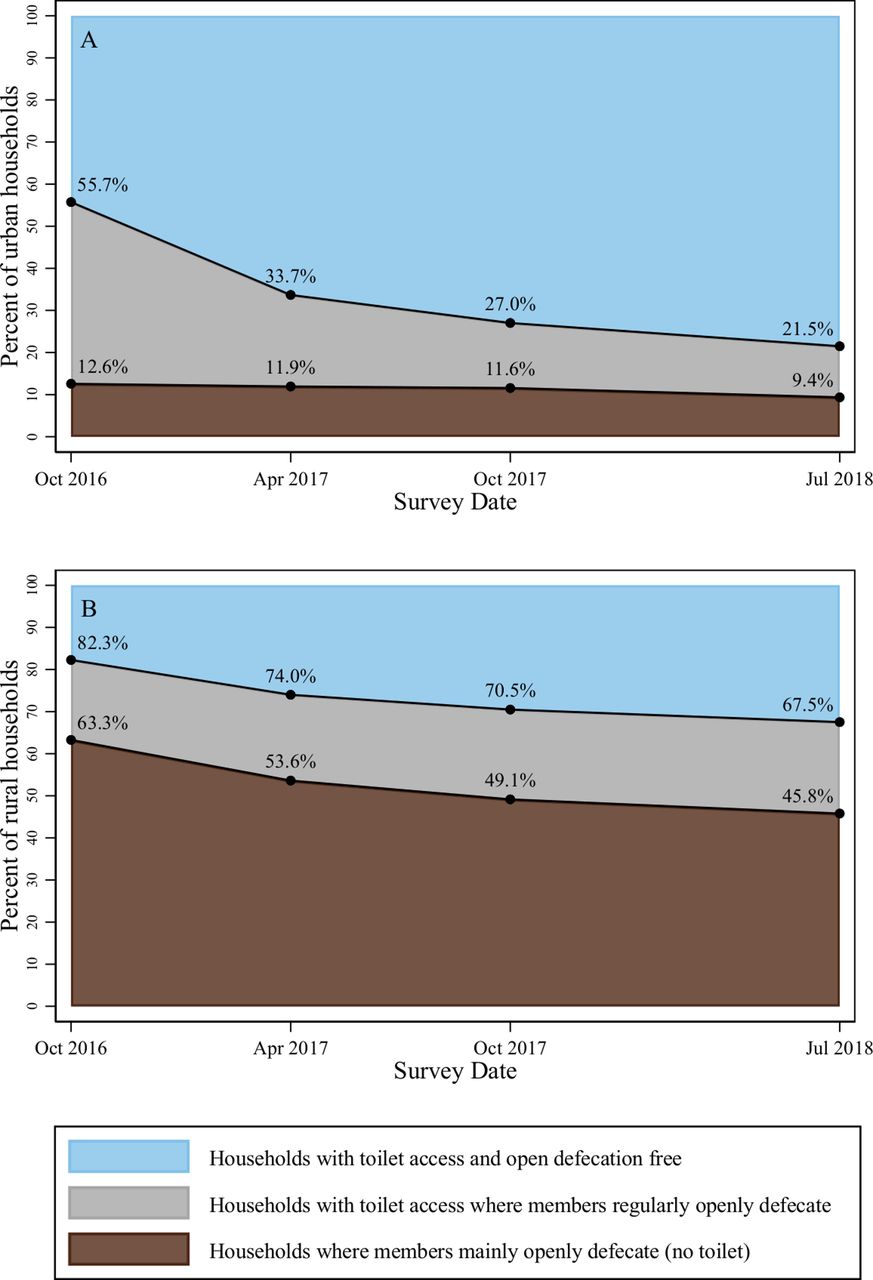
In October 2016, at the completion of the first PMA2020 survey round, the probability sample weighted population percentage of rural households practising OD as their main sanitation was 63.3% (95% CI 57.0% to 69.6%) (table 1). In subsequent survey rounds main OD in rural households decreased to 53.6% (95% CI 47.0% to 60.2%) in April 2017, 49.1% (95% CI 42.7% to 55.6%) in October 2017 and 45.8% (95% CI 38.4% to 53.2%) in July 2018 (table 1). Figure 2 shows the survey weighted proportions of urban and rural households in Rajasthan over time from October 2016 to July 2018 that mainly openly defecated (brown), households that had members regularly practising OD even though the household had access to a toilet (grey) and ODF households that did not report any members openly defecating (blue). The first round of the PMA2020 survey that concluded in October 2016, after initiation of SBM, found 82.3% of rural households had at least one member of the household practising OD (inclusive of main OD). There was a decreasing trend in the proportion of rural households reporting regular OD and by the fourth round of the PMA2020 survey in July 2018, the proportion of households with at least one member practising OD (inclusive of main OD) decreased to 67.5%.
Trends of OD in Rajasthan households with and without toilets (probability sample weighted population percentage with 95% CIs)

Survey weighted proportions of open defecation practices in urban (top) and rural (bottom) households in Rajasthan, 2016-18.
At the initiation of the PMA2020 survey in October 2016 reports of OD as the main sanitation option for households in rural Rajasthan was 63.3% compared with 12.6% main OD in urban Rajasthan (figure 3). Both rural and urban households had decreasing trends across all four rounds of PMA2020 surveys and by July 2018 after Rajasthan had been declared ODF, rural households had 45.8% main OD compared with 9.4% main OD in urban Rajasthan.

Open defecation trends in Rajasthan households: urban versus rural.
Household characteristics of study sample
The characteristics of households are described in table 2, weighted with population sample weights and stratified by the different OD classifications (ODF vs regular OD vs main OD). For ODF households, 66.8% have a flush/pour flush toilet to pit latrine or septic tank compared with 70.3% of regular OD households. A larger percentage of ODF households share their toilet with other households (less than 10) compared with regular OD households (11.3% vs 4.2%). Among households reporting main OD, 54.0% lacked an observed handwashing station compared with 16.6% of ODF households. Households that were ODF had the largest percentage that did not have to collect water (59.2%) compared with regular OD (37.9%) and main OD (12.4%) households. The wealth quintile breakdowns differed for these OD classifications: 36.3% of the ODF households were in the highest wealth quintile compared with 22.6% of the regular OD and 1.6% of the main OD households. The lowest wealth quintile made up 4.9% of the ODF households, 11.0% of the regular OD households and 40.7% of the main OD households.
Characteristics of households by open defecation practice (probability sample weighted population percentages)
Factors associated with regular OD practices in households with toilets
The unadjusted and adjusted logistic regression analyses determined the main household factors associated with regular OD practices among household members with access to a toilet (table 3). These factors included the main household sanitation option, whether that sanitation facility was shared with other households, handwashing, main source of drinking water, reliability of the main source of drinking water, time spent collecting water, urban or rural strata of the household, household wealth, number of household members, age of oldest household member, and survey month. After adjustment, households with access to either a ventilated improved pit latrine or a pit latrine with a slab, had reduced odds of someone in that household openly defecating when compared with households with access to a flush/pour flush toilet to pit latrine or septic tank (adjusted ORs (aORs) for ventilated improved pit latrine: 0.55 (95% CI 0.47 to 0.64) and aOR for pit latrine with a slab: 0.61 (95% CI 0.49 to 0.74)). Households with intermittent (unpredictable) main drinking water, after adjustment, had increased odds of having a member practising OD compared with households that always had reliable drinking water (aOR: 1.89 (95% CI1.60 to 2.24)). Households that collected water had increased odds that a member would openly defecate compared with households that did not (water collection time of zero minutes) (aOR for households with water collection time >30 minutes: 1.82 (95% CI 1.58 to 2.11); aOR 11–30 min: 1.58 (95% CI 1.41 to 1.77); aOR 1–10 min: 1.69 (95% CI 1.51 to 1.89)). And lastly, households that shared their toilet facility with less than 10 households had reduced odds that a member would openly defecate compared with households that did not share (aOR: 0.52 (95% CI 0.43 to 0.62)).
Associations between demographic and WASH characteristics and regular practice of open defecation among households with access to a toilet (n=11 549)
Discussion
This representative state-wide household survey that measured temporal trends of toilet coverage in Rajasthan found that OD continued with 45.8% (95% CI 38.4% to 53.2%) of rural households lacking access to a toilet after the state was declared ODF. These estimates align with previous estimates of OD calculated in Rajasthan during SBM.12 22–25 These estimates do not align, however with reports from the national government.26 This leads to the conclusion that an independent, robust monitoring of sanitation campaigns is necessary to achieve an ODF India.27 This study, to our knowledge, uses the only publicly available household sanitation data that were collected on a timescale relevant to SBM, at a frequency that can assess temporal trends, and at scale that allows for a representative, state-wide evaluation.
Using all four rounds of survey data there was an approximate annual 20% rate of decline in OD. In July 2018, this study found an estimated 21.7% of rural households in Rajasthan with access to a toilet still had one or more members engaging in OD practices. This highlights the importance of sanitation campaigns to construct toilets and to incorporate behaviour change practices that increases use of the toilets.28–34 Regular toilet usage is one of the important aspects of the second phase of SBM called ODF Plus and promotes sustained use of sanitation facilities.
In this analysis, we gained insight into toilet usage by asking if anyone in the household regularly used the bush or field to defecate at work or at home. Our finding was consistent with prior evidence that household-level sanitation questions underestimate the amount of OD.35 During the first round of the survey 27.2% of all households with toilets stated that at least one household member was still openly defecating outside of the home. This percentage decreased over the four rounds to 18.4% of households in July 2018. Effort has been made by SBM to support behaviour change through mass training programs and local innovation.36 Despite the progress, these toilet usage rates have stagnated similarly to previous sanitation campaigns. Under the Indian Total Sanitation Campaign in Odisha among households with latrines, 37% of members reported never defecating in them.37 In Tamil Nadu in 2016, 54.8% of respondents practised OD despite having a household toilet.38 The reasons cited by Yogananth and Bhatnagar38 for this low toilet use was poor toilet construction and accessibility, lack of water availability, preference for OD and sociocultural factors. In this study the household characteristics found to be associated with a lack of toilet usage in Rajasthan were similarly related to a lack of water availability as well as facility sharing. This observation on facility sharing is consistent with previous work that found more users of shared sanitation (10 households or more) was associated with continued OD behaviours.39 New insight is provided by our finding that for households with limited communal toilet sharing (less than 10 households) there was a reduced odds that a household member would openly defecate when compared with households that do not share their toilet. In the post-SBM era it is important to understand the reasons for continued OD despite the construction of toilets,40 both within the household context and in communal environments such as workplaces and public markets.
The extreme water scarcity currently facing Rajasthan is projected to worsen41 42 and findings from this study show it may negatively impact sustainability of twin pit toilets. Under SBM, the standard twin pit toilet was promoted and where it was, water availability is cited as a key enabler of toilet use.43 In this study water scarcity was an underlying factor in multiple WASH household characteristics that were associated with household members continuing to openly defecate when a household had access to a toilet. Access to a ventilated improved pit latrine or a pit latrine with a slab was associated with lower odds that a household member would openly defecate compared with access to a flush/pour flush toilet to pit latrine or septic tank. Unlike twin (or single) pit toilets, pit latrines do not require water to wash away faeces. In this water-stressed region of India, the use of water to either pour or flush away faeces may not be possible under household water rationing, thereby forcing household members to openly defecate. The lack of reliability and unpredictability of a household water source was associated with household members practising OD. Finally, longer collection times to fetch water were also associated with OD when a household toilet was available. This study found that households under water stress practised OD more than households with less water stress and therefore it is important to take water use into consideration when designing and retrofitting toilets under the ODF Plus strategy by the Government of India.44
This analysis was the first to our knowledge to produce state-wide representative estimates of OD in urban and rural Rajasthan on a semi-annual basis during SBM. The frequency of the survey provided a unique opportunity to track progress of the SBM in Rajasthan and provide key insights into progress of the campaign with independent, third party monitoring. The consistency of the questions and sampling methods allowed for comparisons of OD estimates across each survey round and for the pooled cross-sectional analysis. A limitation was the cross-sectional design of the study did not allow for a longitudinal analysis and there was no way to control for a single household in an EA being visited more than once over each round. The other main limitation was that the household questionnaire only asked if any household members openly defecated on a regular basis and did not distinguish if the OD was occurring in the household premises or outside of it.
In a post-SBM era it is important to understand that toilet construction and behaviour change communication are both essential to achieve an ODF India. The reasons for lack of toilet use must be addressed so that the health and safety of the population in India can continue to be transformed.45 A credible, independent monitoring tool must be implemented to accurately measure progress toward this ambitious goal.
Acknowledgments
The authors thank the female enumerators who collected the data, the households who were interviewed for this research and members of the PMA2020 data collection team at IIHMR committed to producing high quality data.
References
Footnotes
Handling editor Seye Abimbola
Twitter @NatalieGExum
Contributors NGE conceived the research. EMG, GS, AK and KJS contributed substantially to research design. NGE and EMG led data analysis. NGE wrote the paper with significant contributions from EMG, GS, AK and KJS.
Funding The Johns Hopkins Water Institute.
Competing interests None declared.
Patient and public involvement Patients and/or the public were not involved in the design, or conduct, or reporting, or dissemination plans of this research.
Patient consent for publication Not required.
Ethics approval PMA2020 acquired necessary ethical approvals for data collection and public release of data sets.
Provenance and peer review Not commissioned; externally peer reviewed.
Data availability statement Data are available in a public, open access repository. The data sets and corresponding survey instruments used in this article are free to download and may be requested through the PMA2020 website: https://www.pma2020.org/request-access-to-datasets (accessed on 29 October 2019). All analyses were conducted using the Stata V.15.1 statistical software package (StataCorp 2017, College Station, Texas, USA). All code required to reproduce the results, tables and figures found in this article is publicly available on Open Science Framework: https://osf.io/c84fm.