Article Text

Abstract
Introduction We aimed to integrate all available epidemiological evidence to characterise an exposure–response model of ambient fine particulate matter (PM2.5) and the risk of chronic kidney disease (CKD) across the spectrum of PM2.5 concentrations experienced by humans. We then estimated the global and national burden of CKD attributable to PM2.5.
Methods We collected data from prior studies on the association of PM2.5 with CKD and used an integrative meta-regression approach to build non-linear exposure–response models of the risk of CKD associated with PM2.5 exposure. We then estimated the 2017 global and national incidence, prevalence, disability-adjusted life-years (DALYs) and deaths due to CKD attributable to PM2.5 in 194 countries and territories. Burden estimates were generated by linkage of risk estimates to Global Burden of Disease study datasets.
Results The exposure–response function exhibited evidence of an increase in risk with increasing PM2.5 concentrations, where the rate of risk increase gradually attenuated at higher PM2.5 concentrations. Globally, in 2017, there were 3 284 358.2 (95% UI 2 800 710.5 to 3 747 046.1) incident and 122 409 460.2 (108 142 312.2 to 136 424 137.9) prevalent cases of CKD attributable to PM2.5, and 6 593 134.6 (5 705 180.4 to 7 479 818.4) DALYs and 211 019.2 (184 292.5 to 236 520.4) deaths due to CKD attributable to PM2.5. The burden was disproportionately borne by low income and lower middle income countries and exhibited substantial geographic variability, even among countries with similar levels of sociodemographic development. Globally, 72.8% of prevalent cases of CKD attributable to PM2.5 and 74.2% of DALYs due to CKD attributable to PM2.5 were due to concentrations above 10 µg/m3, the WHO air quality guidelines.
Conclusion The global burden of CKD attributable to PM2.5 is substantial, varies by geography and is disproportionally borne by disadvantaged countries. Most of the burden is associated with PM2.5 levels above the WHO guidelines, suggesting that achieving those targets may yield reduction in CKD burden.
- environmental health
- public health
This is an open access article distributed in accordance with the Creative Commons Attribution Non Commercial (CC BY-NC 4.0) license, which permits others to distribute, remix, adapt, build upon this work non-commercially, and license their derivative works on different terms, provided the original work is properly cited, appropriate credit is given, any changes made indicated, and the use is non-commercial. See: http://creativecommons.org/licenses/by-nc/4.0/.
Statistics from Altmetric.com
Key questions
What is already known?
Ambient fine particulate matter (PM2.5) is associated with increased risk of chronic kidney disease (CKD).
What are the new findings?
The shape of the relationship between PM2.5 and CKD suggests that increased PM2.5 concentrations were associated with increased risk of CKD at lower concentrations of PM2.5, and the rate of risk increase attenuated at higher levels of PM2.5.
Globally, PM2.5 was associated with 3 284 358 incident cases of CKD each year.
The burden of CKD attributable to PM2.5 was disproportionately borne by low income and lower middle income countries
Nearly 3/4 of the global burden of CKD attributable to PM2.5 was associated with PM2.5 levels above the WHO air quality guidelines
What do the new findings imply?
The global and national effort aimed at reducing burden of non-communicable diseases in general and kidney disease in particular should recognise fine particulate matter air pollution as a driver of burden of CKD globally.
Achieving the WHO targets for fine particulate matter may yield substantial reduction in CKD burden.
Introduction
A number of large epidemiological studies have described the relationship between ambient fine particulate matter of <2.5 µm in aerodynamic diameter (PM2.5) and chronic kidney disease (CKD).1–3 Several experimental studies in mice and rats suggest that inhalation of PM2.5 promotes oxidative stress, inflammation and DNA damage in kidney tissue and leads to structural chronic kidney injury manifested by glomerulosclerosis, mesangial expansion, tubular atrophy and vascular damage, providing a plausible biological mechanism for the injurious effect of PM2.5 on the kidney.4–10 We recently described global and national estimates of CKD burden attributable to PM2.5 pollution based on an exposure–response function derived from a single US cohort with a narrow range of PM2.5 exposure that may limit generalisability of these estimates.11 A significant knowledge gap exists in that the PM2.5-CKD exposure–response function across the concentrations of PM2.5 experienced by humans worldwide has not been characterised.12–14 Characterisation of an exposure–response function that integrates all available evidence will allow for more accurate estimation of CKD burden for a geographic area or a population group with well-defined exposure estimates. Estimation of burden of kidney disease will also contribute to the global discussion about the relationship between environmental air pollution and non-communicable diseases in general and specifically on the contribution of air pollution to the global and national burden of CKD.14–16
In this work, we systematically searched all published reports on the relationship between PM2.5 and CKD and used advanced methodologies to build and characterise an integrated non-linear exposure response model; we then generated estimates of the global and national burden of CKD attributable to PM2.5 air pollution and estimated the burden attributable to levels of PM2.5 exceeding the WHO PM2.5 air quality standards.
Methods
Characterisation of the risk of CKD associated with PM2.5
To estimate the magnitude of the risk of CKD associated with PM2.5 exposure across the spectrum of concentrations experienced by humans, we curated all available evidence for use in an integrative meta-regression approach. Prior work in the quantification of the global health risk of PM2.5 has, for diseases with limited evidence across the entire PM2.5 exposure range, additionally incorporated outcome associations with secondhand smoke, household air pollution and active smoking exposures17 as a means of calibration of exposure–response curve morphology at higher—otherwise understudied—PM2.5 exposure values. However, recent literature has suggested that this approach may result in underestimation of risk,18 and therefore may not be the most optimal strategy to characterise risk if a preponderance of studies is available. Here, due to a potentially limited pool of PM2.5 and CKD studies, we chose to estimate the non-linear exposure–response with methodological considerations based on both the integrated exposure–response (IER) method, which incorporates proxy exposures into estimation, and global exposure morality model (GEMM) method, which relies exclusively on PM2.5 data, allowing for comparison of results generated from data with and without inclusion of proxy exposures.
Data curation
The protocol followed for identification of available evidence for incorporation in integrative meta-regression is reported following recommend guidelines (online supplementary material).19 We searched PubMed, Web of Science and the Cochrane library for literature on cohort, case–control and cross-sectional studies of the association between CKD and PM2.5.20 21 Searches were also conducted to identify studies on CKD and secondhand smoke, household air pollution and active smoking.17 Following the strategies outlined in our protocol, searches on 20 May 2019 resulted in identifying for potential inclusion 322 studies on ambient fine particulate matter air pollution, 301 on secondhand smoke and 535 on active smoking. We screened these studies based on the following inclusion criteria: published in a peer-reviewed journal; reported as having a cohort, case–control or cross-sectional study design; provided a measure of relative risk; available in English; and assessed risk of a kidney disease outcome. We initially selected a CKD outcome definition of an estimated glomerular filtration rate (eGFR) <60 mL/min/1.73 m2, as this is the most commonly used outcome definition in epidemiological studies of CKD.22–36 However, this definition was relaxed for proxy exposures, due to paucity of usable studies, to include kidney disease outcomes that have displayed relative risks similar in magnitude to incident eGFR <60 mL/min/1.73 m2 in prior literature, such as eGFR decline ≥30% from baseline or incident stage 4 CKD.2 We furthermore excluded abstracts, as they lacked sufficient detail necessary for assessing risk of bias. Exposure type specific inclusion criteria included requiring studies on secondhand smoke to have a never-smoker comparison group and requiring studies on active smoking to have exposure definitions based on number cigarettes smoked per day. From selected studies, data were abstracted on study design, study outcome, range of exposure in the cohort, relative risk, relative risk uncertainty and aspects needed for risk of bias assessment. Studies risk of bias were scored using the Newcastle-Ottawa Scales for cohort and case–control studies and an adapted Newcastle–Ottawa scale for cross-sectional studies.37 38 These scales allow for assignment of a numeric score to each study as a means of assessing the potential of bias, where a higher score indicates less potential. Each study was independently scored by two study team members; any discrepancies in score were resolved by additional scoring by third member, where the majority score was taken. Scoring components that were tailored specifically for this study have been included in the protocol (supplement). Studies that scored less than 50% of the maximum score were considered to lack suitability for inclusion in the analyses.20 After applying eligibility criteria, we identified for inclusion in analyses six studies on PM2.5 and CKD, one study on secondhand smoke and CKD and three studies on active smoking and CKD. Further details are provided in the supplement.
Supplemental material
Integrated non-linear exposure–response model
To incorporate all relevant evidence on the association between PM2.5 and CKD, we constructed integrated non-linear exposure–response models by adapting aspects of the GEMM approach by Burnett et al (2018)18 and the IER approach by Burnett et al (2014).17 The GEMM uses state-of-the-art modelling techniques to model the shape of the association between PM2.5 and disease, leveraging study data that span the PM2.5 exposure range experienced by humans. A series of random effects models that pool the relative risk among studies are constructed, each assuming a different monotonic functional form, which are then ensembled to create a final estimate of the exposure–response. The relative risk for a model may be equated by  , where RR(z) is the relative risk of z the exposure value, θ is the parameter estimate and ω(z) is a logistic weighting function
  with r the range of pollutant concentrations and α, μ and τ predefined parameters that affect the shape and curvature of estimated relations. A study’s log(RR) is then estimated as

where z is the exposure for study s, i versus 0 is the ith exposure contrast, and hyperparameter values are set as α = (1,3,5,7,9), τ = (0.1, 0.2, 0.3, 0.4, 0.5, 0.6), and μ = (0th, 25th, 50th, 75th and 100th percentile of the PM2.5 distribution among all study cohorts). This results in a total 150 curves with monotonic morphology that include linear, log-linear, supralinear, sublinear and S shapes, where the choice of hyperparameters were made in line with prior literature.18 These models were used to construct an ensembled estimate (a weighted average), where models are weighted by model fit (better fit resulting in a higher weight), and errors are obtained through bootstrap.39 In defining zsi and zs0 for PM2.5, if risk across several categories of exposure were given, the median of each category was used, otherwise the 5th and 95th percentile (assuming a normal distribution) were used. Contrast values for secondhand smoke and active smoking were based of prior literature, where moderate or severe passive smoking and number of cigarettes per day were translated into PM2.5 mass inhaled concentration; a zs0 of zero was used.17 For the distribution of μ, we assumed an uniform distribution between the minimal and maximal PM2.5 values across the studies, as this allowed for a wide range of μ whose definition was not dominated by any one study with a large sample.
We employed four strategies in building the integrated non-linear exposure response model where we: (A) constructed the model using exclusively PM2.5 study data and deweighted cross-sectional studies40 (this approach most closely emulates the analytic considerations and underlying assumptions of the GEMM model by Burnett et al18); (B) constructed the model using PM2.5 study data only and did not deweight cross-sectional studies; (c) additionally included data from the proxy exposure studies based on IER methods17 and deweighted cross-sectional studies; and (D) additionally included data from proxy exposure studies and did not deweight cross-sectional studies. Data were weighted by sampling variance and risk of bias using the quality effects weighting method as proposed by Doi and Thalib.40 Models in cross-sectional studies were deweighted by setting the risk of bias scores to a minimal value (1), a reflection of their inability to establish temporality in exposure–response relations (and the resultant higher risk of bias). Random effects models were fit using the rma.mv routine in R with the options: method=“REML”, optimizer=“optim”. A compound symmetry (CS) covariance structure was specified; for models that incorporated proxy exposures, a structure of (“CS”, “CS”), adding correlation at the study (nested within exposure type) and exposure type levels, was used.17 18 Two studies that were done in potentially the same cohort by the same group (Chen and Yang) were treated as being at the same study level. We additionally tested models specifying unstructured covariance; however, results were robust to this change, so the more parsimonious structure was kept.18 41 Resultant estimated risk are plotted for each of the four model versions, where a reference of 2.4 µg/m3 is used, and all risk under 2.4 µg/m3 was set to null, a reflection of burden estimation where a theoretical minimum risk exposure level (TMREL) of 2.4 µg/m3 was used.18 As a means of visual presentation of fit for comparison of models with and without incorporation of proxy exposure data, we present for the best fit models (among the 150 models in the ensemble) a plot of the  along with plots of the studies data points. One thousand replications using a parametric bootstrap approach was used in obtaining the UI, where the 2.5th and 97.5th percentiles of the resultant distribution of the ensemble estimates are reported.18 39
Burden estimation
Data on the global burden of CKD were obtained from the 2017 Global Burden of Disease (GBD) study,42 where the GBD estimates CKD stage 1–5. Briefly, deaths due to CKD are estimated using vital registration and verbal autopsy data sources, to which a garbage coding algorithm is applied in order to redistribute cause of death codes deemed implausible or possibly miscoded. Prevalence is estimated from a collation of studies on population level CKD rates and is augmented by population-based surveys of renal function and renal registry reports, including end-stage renal disease data from 109 countries and data on CKD stage 3–5 from 59 countries.43 These data were linked with 2017 PM2.5 global exposure estimates made available by GBD investigators44–47; GBD estimates population weighted annual mean PM2.5 concentrations for each country and territory at an approximate 11 km × 11 km resolution from a synthesis of satellite-based estimates, chemical transport models and ground-level measurements from 9960 monitors from 108 countries; the population-weighted root mean squared error of the model was 8.11 µg/m3.48 Using risk estimates from the integrated non-linear exposure–response models, we calculated the population attributable fraction (PAF) based on the equation  where
where  is the difference in the transformed PM2.5 contrast between
  the population-weighted PM2.5 exposure estimate for the country or territory and
  the TMREL exposure level, and
  the parameter estimate.39 We set a TMREL of 2.4 µg/m3 and estimate the global CKD burden attributable to PM2.5.18 We estimated the absolute number, rate per 100 000 persons, and age-standardised rate per 100 000 persons for CKD incidence, prevalence, disability-adjusted life-years (DALYs) and deaths attributable to PM2.5. Further details are provided in the supplement. Ninety-five percent uncertainty intervals were obtained through 1000 realisations of the burden, where uncertainty was contributed to by risk estimation and uncertainty in GBD burden estimates. All reported numbers should be interpreted along with their 95% uncertainty intervals.
We then estimated the burden of CKD due to PM2.5 for 194 countries and territories based on the risk estimates of the integrated non-linear exposure–response model from the strategy of using only PM2.5 studies and deweighting the cross-sectional studies; we choose this strategy as our primary approach as it does not rely on proxy exposures (known to result in underestimation of risk), and—by deweighting cross-sectional studies—it will more closely approximate the ideal setting in which only high-quality longitudinal studies of PM2.5 and CKD are used. We estimated burden by World Bank income classification and conducted an estimated to expected ratio analyses by constructing a negative binomial model of the relation between age-standardised DALY rates of CKD due to PM2.5 and sociodemographic index (SDI), a summary measure of a country’s level of sociodemographic development,49 where SDI was treated as a restricted cubic spline to allow for non-linearity in the association. This ratio compares the estimated burden of CKD attributable to PM2.5 to the expected burden of CKD attributable to PM2.5 based on a country’s SDI. We furthermore estimated the burden of CKD attributable to PM2.5 concentrations above a TMREL (counterfactual) of 10 µg/m3, the WHO air quality standard for average annual PM2.5 concentrations. Estimates for global burden and burden by World Bank income category were calculated through summation of the 194 countries and territories in our data. Maps were generated in ArcMap 10.5 (ESRI, Redlands, California, USA) and R Studio (R Core Team) and plots in SAS EG V.7.1 (SAS Institute, Cary, North Carolina, USA).
Patient and public involvement
No patients were involved in developing the hypothesis, the specific aims, or the research questions, nor were they involved in developing plans for design or implementation of the study. No patients were involved in the interpretation or writing up of results. There are no plans to disseminate the results of the research to study participants.
Results
An integrated non-linear exposure–response model
We integrated all available evidence to build and characterise a non-linear exposure–response model of the relationship between PM2.5 and risk of CKD; a flow chart of data curation and description of included studies are available in supplementary figure S1 and table 1.1 2 50–57 For potential inclusion in the meta-regression analyses, we identified six studies on PM2.5, one study on secondhand smoke, and three studies on active smoking (online supplementary figure S1 and table 1), leading to a total of 30 data points, 15 of which were from PM2.5 studies. No studies on household air pollution and risk of CKD were identified.
Summary of studies incorporated in integrated non-linear exposure-response modelling
We considered four analytic approaches to building the integrated non-linear exposure response function: (A) in analyses considering only studies on PM2.5 and risk of CKD and where cross-sectional studies were deweighted (we designated this as the primary model), the exposure–response function exhibited evidence of an increase in risk with increasing PM2.5 concentrations and the rate of risk increase gradually attenuated as PM2.5 concentration increased (figure 1A); (B) analyses considering only studies on PM2.5 and CKD and where cross-sectional studies were not deweighted produced consistent results (figure 1B); (C) analyses that also included active and passive smoking data as proxies of PM2.5 exposure and where cross-sectional studies were deweighted yielded an exposure–response function that exhibited less risk for each given PM2.5 concentration than when proxy exposures were not included (figure 1C); (D) analyses that also included active and passive smoking data as proxies of PM2.5 exposure and where cross-sectional studies were not deweighted yielded results consistent with those in approach C(figure 1D). Plots of estimated risk versus study data points suggested that compared with models built using only PM2.5 data, incorporation of proxy exposures resulted in underestimation of risk associated with PM2.5 exposure (online supplementary figures S2A–D).
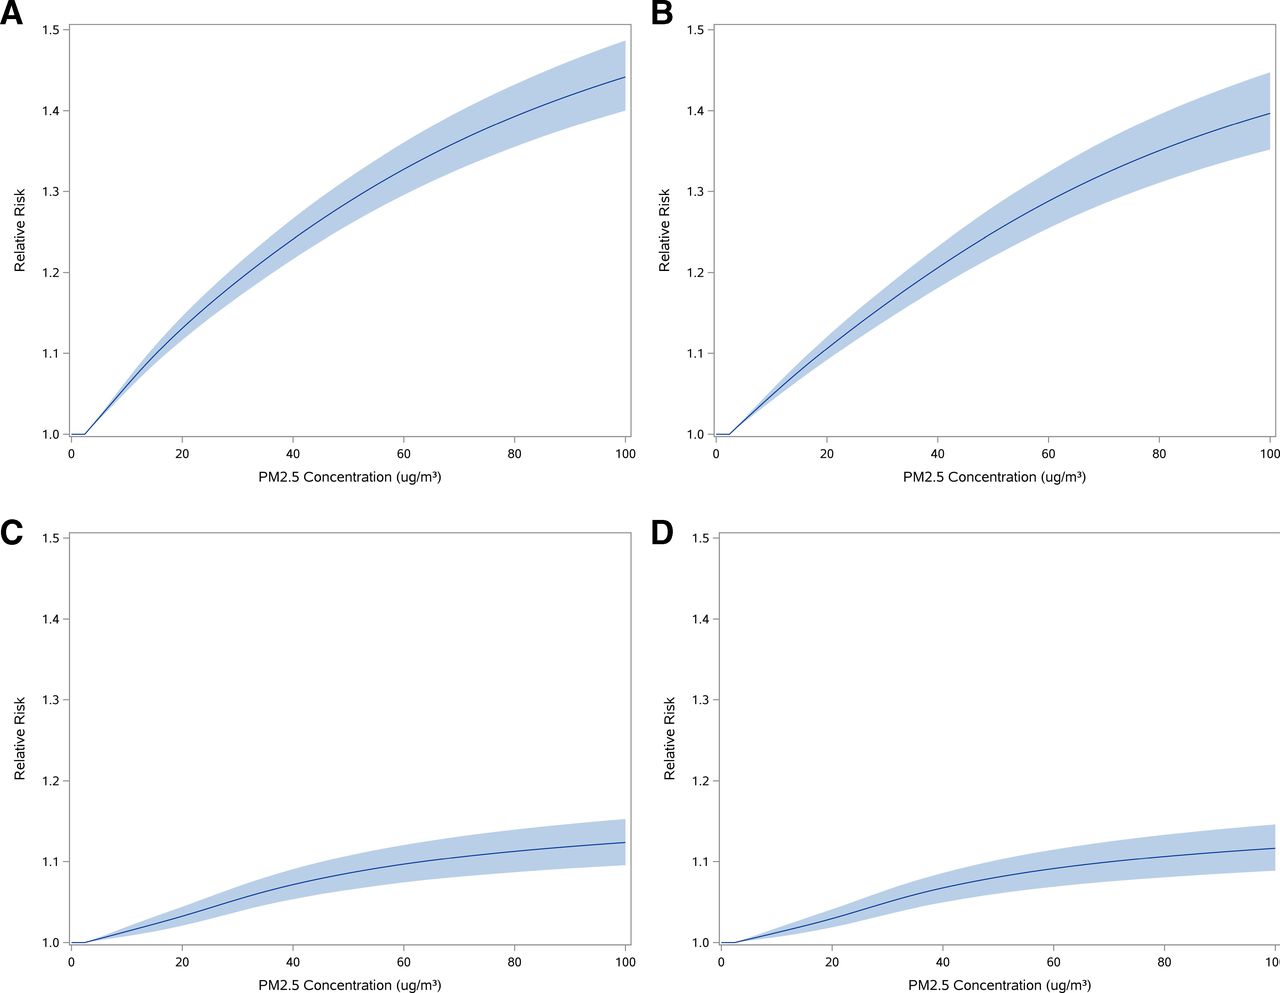
Integrated non-linear exposure–response curve of PM2.5 and CKD. Curves are presented for modelling strategies where: (A) only PM2.5 study data were used and cross-sectional studies were deweighted; (B) only PM2.5 study data were used; (C) data from studies on proxy exposure were additionally incorporated and cross-sectional studies were deweighted; and (D) data from studies on proxy exposure were additionally incorporated. Ninety-five per cent UI are presented as bands. A reference value of 2.4 µg/m3 was used; all risk under the reference was set to unity. PM2.5, ambient fine particulate matter.
Global Burden of CKD attributable to PM2.5 air pollution
We estimated the global burden of CKD attributable to air pollution using the PM2.5 exposure–risk function where only studies on PM2.5 and CKD were used and cross-sectional studies were deweighted (we designated this as the primary model and is depicted in figure 1A). At the global level, our estimates suggest that incidence of CKD attributable to PM2.5 air pollution was 3 284 358.2 (95% UI 2 800 710.5 to 3 747 046.1) and prevalence was 122 409 460.2 (108 142 312.2 to 136 424 137.9). There were 6 593 134.6 (5 705 180.4 to 7 436 870.1) DALYs and 211 019.2 (184 292.5 to 236 520.4) deaths due to CKD attributable to PM2.5 pollution. Rates per 100 000 and age-standardised rates per 100 000 for incidence, prevalence, DALYs and death due to CKD attributable to PM2.5 air pollution are provided in table 2.
Estimates of the global burden of CKD attributable to PM2.5 air pollution
In analyses using the exposure–response model where data from cross-sectional studies were not deweighted, the burden estimates closely matched those produced using the primary exposure–response model (where cross-sectional studies were deweighted), where the estimated absolute number of prevalent cases of CKD and DALYs due to CKD attributable to PM2.5 were 88.8% and 89.1% of those of the primary model (table 2). In analyses using the exposure–response model, which also incorporated smoking data produced lower estimates of burden (table 2), estimating 33.5% and 33.7% as many prevalent cases of CKD and DALYs due to CKD attributable to PM2.5 as the primary model; when cross-sectional studies were deweighted, the model estimated 31.5% and 31.8% as many prevalent cases of CKD and DALYs due to CKD attributed to PM2.5 as the primary model, respectively.
Burden of CKD attributable to PM2.5 air pollution in 194 countries and territories
We estimated the number, rate per 100 000 persons, and age-standardised rate per 100 000 persons for incidence, prevalence, DALYs and death due to CKD attributable to PM2.5 air pollution for 194 countries and territories based on the primary model (online supplementary tables S1–S4). A map of the prevalent number of CKD attributable to PM2.5 is presented in figure 2A. Maps of the age-standardised DALYs rates, PAF, and age-standardised incidence, prevalence and death rates due to CKD attributable to PM2.5 air pollution are provided in figure 2B and online supplementary figures S3–S6, respectively. Overall, there was substantial geographic variation in age-standardised burden, it was more pronounced in northern Africa, several countries in the Middle East, Southeast Asia, India and China.
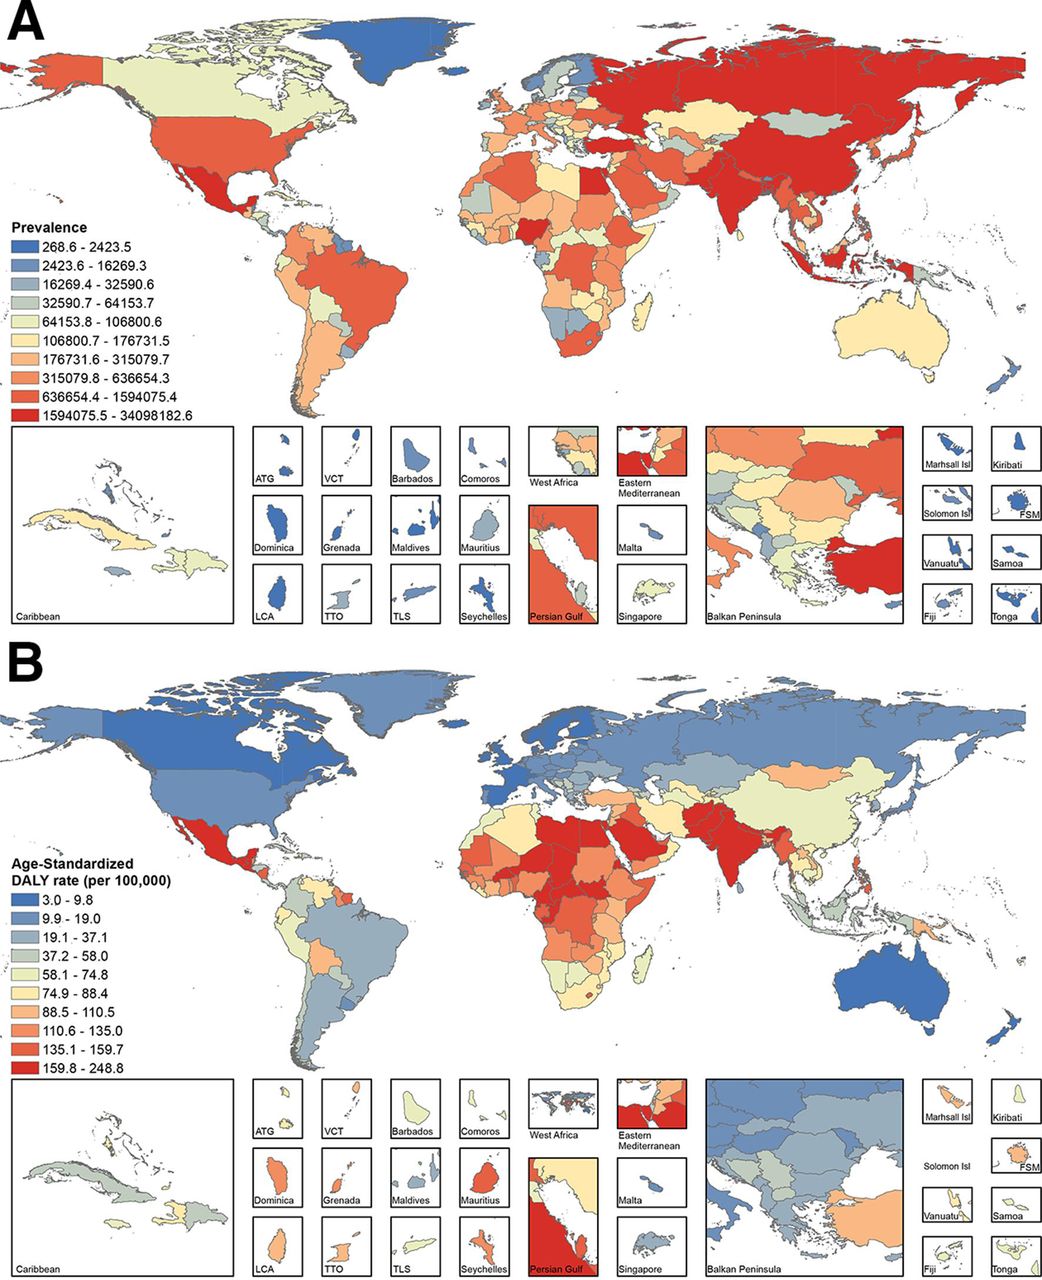
Global burden of CKD attributable to PM2.5 in 194 countries and territories. (A) Prevalence of CKD attributable to PM2.5; (B) age-standardised disability-adjusted life-years (DALYs) rate (per 100 000) due to CKD attributable to PM2.5. Countries are coloured by decile. CKD, chronic kidney disease; PM2.5, ambient fine particulate matter. ATG, Antigua and Barbuda; FSM, Federated States of Micronesia; Isl, Island; LCA, Saint Lucia; TLS, Timor-Leste; TTO, Trinidad and Tobago; VCT, Saint Vincent and the Grenadines.

Map of the estimated to expected ratio of age-standardised disability-adjusted life-years (DALYs) due to CKD attributable to PM2.5 based on level of sociodemographic development. Countries and territories are coloured by the estimated to expected ratio the age-standardised DALYs rate based on their sociodemographic index (SDI), where a ratio greater than one indicates greater than expected age-standardised DALYs, while a ratio less than one is less than expected. CKD, chronic kidney disease.
Burden of CKD and sociodemographic development
Age-standardised rates for incidence, prevalence, DALYs and death due to CKD attributable to PM2.5 pollution by World Bank income category are provide in table 3. The results suggest that the burden was higher in low income and lower middle income countries. Across the development spectrum, there was wide variation in estimated to expected age-standardised DALY rates where several low and high SDI countries exhibited substantial deviation (both higher and lower) from expected burden based on their level of development (figure 3 and online supplementary table S5).
Estimates of the population attributable fraction and age-standardised burden rate (per 100 000) of CKD attributable to PM2.5 by World Bank income classification
Burden of CKD attributable to PM2.5 levels above the WHO limit of 10 µg/m3
We then estimated the burden of CKD attributable to PM2.5 concentrations above the WHO air quality standards (10 µg/m3). Our results suggest that 72.8% of prevalent cases of CKD attributable to PM2.5 and 74.2% of DALYs due to CKD attributable to PM2.5 were due to concentrations above 10 µg/m3 (table 4).
Estimates of the global burden of CKD due to PM2.5 above the WHO air quality guidelines for PM2.5 (10 µg/m3)
Discussion
In this work, we integrated all available evidence of the relationship between PM2.5 and risk of CKD to build and characterise a non-linear exposure–response function to describe the risk of CKD across PM2.5 concentrations experienced by humans. We estimated that in 2017, there were 3 284 358.2 (95% UI 2 800 710.5 to 3 747 046.1) incident and 122 409 460.2 (108 142 312.2 to 136 424 137.9) prevalent cases of CKD attributable to PM2.5; and 6 593 134.6 (5 705 180.4 to 7 479 818.4) DALYs and 211 019.2 (184 292.5 to 236 520.4) deaths due to CKD attributable to PM2.5 pollution. We produced estimates of CKD burden attributable to PM2.5 pollution for 194 countries and territories and provided evidence that the burden is disproportionately borne by low income and lower middle income countries. Finally, we also show that 72.8% of the prevalent cases of CKD attributable to PM2.5 air pollution and 74.2% of DALYs due to CKD attributable to PM2.5 were associated with PM2.5 levels above the WHO air quality standards.
We employed four strategies to build the non-linear exposure-risk function. We observed that deweighting cross-sectional studies did not appreciably influence the morphology of the risk–exposure model, nor did it result in substantially different estimates. However, the inclusion of active and passive smoking as proxies of PM2.5 exposure resulted in a much smaller risk estimates and subsequently much lower burden estimates. These results are consistent with findings from Burnett and collaborators18 who noted that prior methodological approaches that incorporated active and passive smoke as proxy exposures of PM2.5 resulted in significant underestimation of burden of death attributable to PM2.5 pollution.18 More accurate estimation of CKD burden hinges on the availability of high-quality cohort studies representing the full spectrum of PM2.5 exposure experienced by humans.
The WHO now officially recognises air pollution as a risk factor for non-communicable diseases, and there is increasing recognition that tackling air pollution is critical to addressing the rising tide of non-communicable diseases.16 Estimates of burden of non-communicable diseases attributable to air pollution are important to inform this effort, guide policy and inform future directions.12–14 In particular, as experimental evidence has accumulated over the past decade providing plausible biological mechanism to explain the effect of PM2.5 on the kidney,4–10 and as large epidemiological studies linking PM2.5 exposure with risk of kidney disease and death due to kidney disease became available, the need for a greater understanding and more accurate estimation of the burden of kidney disease attributable to PM2.5 air pollution became more evident.16 58 We previously provided estimates of CKD burden attributable to PM2.5, which relied on a single large US cohort study.11 In this work, we integrated all available evidence and provided global and national estimates of burden of CKD attributable to PM2.5 air pollution. The GBD study estimates that exposure to ambient particulate matter pollution is associated with 83 million DALYs59 likely underestimating—according to Burnett and colleagues18—the global toll of death and disability attributable to air pollution.18 Our estimates suggest that CKD DALYs attributable to PM2.5 air pollution were 6.5 million accounting for 7.8% of all DALYs attributable to ambient particulate matter pollution, reflecting the sizeable toll of this—so far largely ignored non-communicable disease.12–15 59 As a significant body of epidemiological evidence on the effect of PM2.5 on risk of kidney disease has accumulated over the past decade, it is important that PM2.5 and CKD be considered for inclusion as a risk–outcome pair in future iterations of the comparative risk assessment framework of the GBD study. Such inclusion would allow for the derivation of estimates of the burden of CKD attributable to ambient PM2.5 air pollution in the same computational modelling system considering other risks—including other environmental, occupational, behavioural and metabolic exposures48—and other health outcomes (eg, under 5 mortality, which may be a competing risk for non-communicable diseases manifesting later in life), thus enabling more accurate comparative estimation of the burden of diseases attributable to PM2.5 and the health burden of PM2.5 relative to other risks. The GBD study framework also facilitates comparative evaluation of the health sequalae of PM2.5 across geographies and over time.
We observed that estimates of the burden of CKD attributable to PM2.5 air pollution exhibited substantial geographic variability and were higher in low and lower middle income countries—countries that are least equipped to deal with the untoward health consequences of pollution.11 35 60–62 Variations in PM2.5-associated CKD burden reflect the influence of differences in PM2.5 exposure and differences in underlying CKD rates. Our estimated to expected ratio analyses based on SDI suggest that at both ends of the development spectrum there are several countries that exhibited much higher (and much lower) burden than expected. To the extent that sociodemographic and economic development may be both a driver for environmental air pollution and enabler of mitigation mechanisms, the bidirectional diversion from expected burden across the SDI spectrum suggests the likely presence of other forces (or drivers) of this burden and the potential—for so far unrealised—opportunities for reduction in burden.35 60
Our estimates suggest that the majority of the burden was attributable to PM2.5 levels above the WHO air quality guidelines for annual mean PM2.5 concentrations. The findings emphasise that for much of the world PM2.5 levels remain too high and that further effort to reduce PM2.5 concentrations—and meet the WHO air quality standards—may be associated with substantial reduction in burden of CKD worldwide.11 16
This study has several limitations. While we integrated data from all available studies on PM2.5 and CKD, our approach is inherently limited by the availability of data, and in particular, the paucity of large high-quality longitudinal studies of PM2.5 and CKD from areas with very high PM2.5 concentrations3 and the lack of data for very low levels of PM2.5 below the TMREL. There was also limited geographic diversity in the studies of PM2.5 and CKD in that most were from western countries, few from East Asia, and none from Africa and the southern hemisphere. Our analyses did not consider potential heterogeneity of effect by population or regional characteristics, and we did not account for potential temporal or geospatial differences in composition and toxic content of PM2.5. PM2.5 is also associated with diabetes and hypertension, both known causal drivers of CKD; while the studies included in our metaregression analyses considered hypertension and diabetes as potential confounders, addressing the knowledge gap of whether to what extent the association between PM2.5 and CKD is mediated by diabetes and hypertension may help further refine PM2.5 burden attribution. Causal interpretation should be made with caution. In this work, we estimated the global and national burden of CKD attributable to PM2.5 using GBD data for CKD burden, and PM2.5 exposure estimates at the national level.63 Our analyses do not include potential exposure to air pollutants other than PM2.5 or to indoor air pollutants and do not provide further insight into PM2.5 attributable burden at the subnational level. Our estimates of CKD attributable to PM2.5 at the global and national levels reflect the influence of PM2.5 levels across the globe and of demography and underlying CKD rates.
Strengths include the application of state-of-the-art methodologies to build an integrated exposure response function using data from several high-quality longitudinal cohort studies of PM2.5 and CKD, and in particular, the incorporation of studies from China where PM2.5 exposure is much higher than western countries. The functional form of our integrated exposure–response function and the resulting estimates of burden were not sensitive to deweighting of cross-sectional studies. To build our estimates, we leveraged the availability of the 2017 GBD data, which is the most comprehensive compilation and analysis of global health information available, and provided several measures of burden including incidence, prevalence, DALYs and death.
In sum, we built and characterised an integrated non-linear exposure–response model for PM2.5 and CKD and show that the global burden of CKD attributable to PM2.5 air pollution is substantial. The estimated burden was unevenly distributed, and more disproportionately borne by low income and lower middle income countries. That nearly 3/4 of the burden is associated with PM2.5 concentrations above the WHO air quality standards suggests potential unrealised opportunities for reduction in CKD burden.
Acknowledgments
In this report, we used the publicly available Global Burden of Disease studies data and methodologies. The Global Burden of Disease Collaborator Network is composed of more than 3000 collaborators worldwide and is headquartered at the Institute for Health Metrics and Evaluation (IHME) in Seattle, Washington. The estimates used in generating this manuscript relied on the GBD data and methodologies. We acknowledge the visionary global health leadership of IHME and the contribution of all collaborators without whom this report would not be possible.
References
Footnotes
Handling editor Sanne Peters
Twitter @zalaly
Correction notice This article has been corrected since it was published online.
Contributors Research area and study design: BB and ZA-A; data acquisition: BB and EA; data analysis and interpretation: all authors; statistical analysis: BB, YX and MC; supervision and mentorship: ZA-A. Each author contributed important intellectual content during manuscript drafting or revision and accepts accountability for the overall work by ensuring that questions pertaining to the accuracy or integrity of any portion of the work are appropriately investigated and resolved. ZAA takes responsibility that this study has been reported honestly, accurately and transparently; that no important aspects of the study have been omitted; and that any discrepancies from the study as planned have been explained.
Funding The research was funded by the Institute for Public Health at Washington University in Saint Louis.
Map disclaimer The depiction of boundaries on the map(s) in this article do not imply the expression of any opinion whatsoever on the part of BMJ (or any member of its group) concerning the legal status of any country, territory, jurisdiction or area or of its authorities. The map(s) are provided without any warranty of any kind, either express or implied.
Competing interests None declared.
Patient and public involvement Patients and/or the public were not involved in the design, or conduct, or reporting, or dissemination plans of this research.
Patient consent for publication Not required.
Ethics approval This research project was reviewed and approved by the Institutional Review Board of the VA Saint Louis Health Care System.
Provenance and peer review Not commissioned; externally peer reviewed.
Data availability statement All data is publically available. Data are available upon request.