Article Text

Abstract
Introduction Caesarean section (CS) rates are increasing globally. CS can be a live-saving procedure when medically indicated, but it comes with higher risks for women and newborns when done without medical indication. Crucially, inequalities in who receives CS exist, both within and across countries. Understanding factors driving increasing rates and inequalities of CS is imperative to optimise the use of this life-saving intervention. This study aimed to investigate trends of CS use and inequalities across sociodemographic characteristics in Indonesia over a 30-year period.
Methods Seven waves of the Indonesia Demographic and Health Survey were used to estimate trends and inequalities in CS from 1987 to 2017. Relative and absolute inequalities across a range of sociodemographic characteristics were estimated and trends in inequalities were assessed through changes in rate ratio and rate difference.
Results The proportion of facility-based births in Indonesia has increased in the past 30 years, coinciding with an increase in CS rate (CSR) (1991 CSR: 1.6% (95% CI 1.3 to 1.9); 2017 CSR: 17.6% (95% CI 16.7 to 18.5)). Higher rates of CS are observed mostly in Western Indonesia, while lower CSRs are observed in Eastern Indonesia. Inequalities of CSRs in Indonesia are observed across type of health facility (public/private), regions, places of residence, wealth quintiles and maternal education, with the highest CSRs in more affluent and educated groups. Widening absolute inequalities of CS are observed across all sociodemographic characteristics, except facility type, where CSR gaps between public and private facilities have closed on both relative and absolute scales.
Conclusion This study provides evidence of increasing trends in CSRs and widening absolute inequalities in CSRs across different sociodemographic groups of women in Indonesia. The context of increasing CSRs across society, however, may have resulted in more stable relative inequalities. Improving understanding of the drivers of these trends in Indonesia and, particularly, of women’s and providers’ perspectives and preferences for childbirth, should be prioritised to optimise the use of CS.
- maternal health
- obstetrics
- public health
- cross-sectional survey
- health policy
This is an open access article distributed in accordance with the Creative Commons Attribution Non Commercial (CC BY-NC 4.0) license, which permits others to distribute, remix, adapt, build upon this work non-commercially, and license their derivative works on different terms, provided the original work is properly cited, appropriate credit is given, any changes made indicated, and the use is non-commercial. See: http://creativecommons.org/licenses/by-nc/4.0/.
Statistics from Altmetric.com
Key questions
What is already known?
Caesarean section rates are increasing globally, with limited additional benefit for women and newborns’ health.
Despite considerable interest and investments to increase health access for the poor in Indonesia, trends and inequalities in the use of caesarean section in Indonesia have not been assessed.
What are the new findings?
Caesarean section rates have steadily increased in the past 30 years in Indonesia.
Increasing inequalities of caesarean section are observed across the sociodemographic characteristics examined: urban, richer and more educated women are more likely to have a caesarean section.
Caesarean section rates are different across settings in Indonesia, suggesting that overuse and underuse of caesarean section may coexist.
What do the new findings imply?
Given the complexity of increasing absolute inequalities and the coexistence of overuse and underuse of caesarean section in Indonesia, public health programmes need to be flexible to optimise the use of caesarean section in Indonesia.
Monitoring practices and policies should be implemented to continuously assess caesarean section rates, and improve equitable access to quality maternity care for all women in Indonesia.
Further qualitative research is needed to understand preferences, drivers and barriers to caesarean section across individual, family, health worker and health system levels.
Introduction
Caesarean section (CS) is a life-saving procedure during childbirth when vaginal birth is not possible. However, CS conducted without any medical indication has not shown to improve maternal and perinatal outcomes.1 2 Instead, its potential short-term and long-term complications such as haemorrhage, uterine rupture, anaesthetic related complications as well as increased obstetric risks in subsequent pregnancy after CS might outweigh any risks of vaginal birth.3 4 CS rates (CSRs) have increased globally over the past few decades. Analysis of trend data across 169 countries shows that CSRs have doubled worldwide to 21% from 2000 to 2015, with an average annual increase of 4%.5 6 Between 1990 and 2014, the highest absolute increases occurred in Latin America (19.4%), followed by Asia (15.1%).5 Importantly, Asia had the highest average annual increased rate of CS of 6.4% during this period.5 There is no consensus on the optimal CSR at population or hospital level.1 However, the range of 10%–15% at a population level has been used pragmatically for international monitoring as the benchmark to ensure maternal and perinatal health benefits and reduce potential harms.1 6–8
In addition to rising CSRs, inequalities in who receives CS exist, both within and across countries,8 and no population-level CSR can ensure that all CS are conducted in women who need it. These disparities highlight inequities in the use of CS based on a woman’s sociodemographic characteristics and where she lives. According to the latest global estimates in 2014, CSRs ranged from less than 1% in South Sudan to over 50% in Dominican Republic.6 8 Likewise, within countries, wealthier and more educated women have higher CSRs compared with poorer and less educated women.6 8 Globally, CS is more frequently used in private compared with public health facilities, suggesting that access and financial ability are positively correlated with higher CSRs.6
Indonesia has taken important strides to improve maternal health (box 1. Context and maternal health services in Indonesia); however, is also faced with challenges in combating social and health inequalities. The wealthiest groups and those residing in Western Indonesia regions enjoy substantially higher income and better access to healthcare, education and infrastructure, while the Eastern Indonesia regions are still lagging behind.9–11 These inequalities are also reflected in health indicators. For example, a study on maternal services usage in Indonesia shows that the richest women are 5.5 times more likely to have facility-based births and three times more likely to receive CS compared with the poorest women.12 Furthermore, a 72-country study assessing inequalities of CS found that the rate difference of CS in Indonesia are 19% higher in the richest group compared with the poorest and 9.5% higher among women living in urban compared with rural areas.8 While these studies are crucial in shedding light on Indonesia’s CS trends and its potential inequalities, Nababan et al12 only assessed maternity services trends up to 2012, with primary focus of trends in economic inequalities and Boatin et al8 only explored the trends of CS at two time points (2002 and 2012) and only across economic status and place of residence. No previous studies have estimated trends in inequalities of CS in Indonesia across other sociodemographic characteristics.
Context and maternal health services in Indonesia
Indonesia is a lower middle-income country comprised of over 15 000 islands, 34 provinces and 416 districts, with a population of more than 260 million people.62 In 2018, 55.9% of the population lived in urban areas, with 44.1% in rural areas.63 In the same year, 9.8% of Indonesians still live below the national poverty line, with 30% of population were either poor or vulnerable in falling back to poverty.64 It is reported that around 28% and 34% of the poor live in urban and rural areas, respectively.64 Despite this demographic and economic status, increasing rates of CS have been reported in Indonesia, rising from 2% to 16% from 1986 to 2012.12 This increase aligned with increasing trends in facility-based birth from 22% to 73% during the same period.12 Between 1986 and 2012, antenatal care (ANC) coverage has also increased, from 61% to 85% for four or more visits and from 81% to 95% for at least one visit.12
The Government of Indonesia has implemented extensive programmes to improve maternal and neonatal health.23 65 This includes the implementation of the Safe Motherhood Program in 1987 and the Village-based Midwife program in 1989. These programmes strengthened sustainable maternal health services at village level and assigned 54 000 new midwives across Indonesia, within 7 years of its inception, to staff ‘small birthing units’ called maternal huts (polindes) at the village level, which are supervised by community health centres (puskesmas) at the subdistrict level.13 23 24 65 66 These national initiatives were accompanied by a range of improvements to the continuum of maternity care services and were followed by a number of Initiatives such as the Integrated Health Post (posyandu), Mother Friendly Movement in 1996, Making Pregnancy Safer strategy in 2000, development of National 18 Health Indicators in 2008 and Expanding Maternal and Neonatal Survival Program in 2011.24 65
Furthermore, Indonesia has undergone health system reform towards Universal Health Coverage, to ensure equal access to health services both at public and private facilities across regions and sociodemographic groups.65 67 This reformation began with the implementation of posteconomic crisis Social Safety Net health card scheme in 1998 when economic crisis hit the country in 1997.12 15 In 2004, National Social Security System law was established and followed by the launched of Askeskin (health insurance for the poor) in 2005, which later transformed into Jamkesmas in 2008 to include the near poor and Jampersal in 2011 to provide maternity insurance for all pregnant women in Indonesia.24 25 65 67 In 2014, the government replaced all of these fragmented insurance schemes into one national health insurance programme called as Jaminan Kesehatan National (JKN) by National Agency of Social Insurance (Badan Penyelenggara Jaminan Sosial (BPJS) Kesehatan), which intended to cover all populations in Indonesia.65 These programmes and policy changes have contributed directly and indirectly to increased skilled birth attendance, referrals to health facilities and a 72% relative reduction in the maternal mortality ratio from 446 in 1990 to 177 per 100 000 live births in 2017.13 23 68–70 Despite these improvements, maternal mortality remains high in Indonesia compared with the neighbouring Southeast Asian countries.60 69
Indonesia’s health sector is organised at five levels; village, subdistrict, district, province and central.24 65 The backbone of Indonesia’s health sector is located at subdistrict level through community health centres, which have subservices through maternity hut, village health post (poskesdes) and subhealth health centre (pustu) at the village level.24 65 Based on the health service organisation, the desired scenario for woman to access public maternity services is through the following: pregnant women at village level receive free pregnancy care under the JKN scheme at either maternity hut, village health post, subhealth health centre or community health centres by village-based midwife and additional monthly ANC at integrated health post to increase its coverage.24 44 45 Low-risk vaginal births take place at maternity huts, with higher risk pregnancies referred to the first-tier health facility (community health centres or private clinics).44 45 When higher level care is needed, such as instrumental vaginal birth or CS, women are referred to the first referral hospitals (public or private) at district level. Women will be referred further if the first referral is not able to manage the condition, to the provincial or national referral hospitals.24 44 45 Beyond the described ideal theoretical scenario, challenges remain in the utilisation of health services and functional referral systems, including use of insurance schemes among different sociodemographic groups.25 61 67 68 71 Furthermore, women living in urban areas with financial capabilities and not relying on JKN often bypass this system to give birth at private clinics.46
A holistic understanding of the various dimensions of inequalities in CSRs in Indonesia is crucial to understand the current state of CS in the country and to inform future monitoring, policies and actions. This study aims to explore trends and inequalities in CSRs in Indonesia from 1987 to 2017. Specifically, we aimed to present trends in CS for the whole population, and trends in CS on relative and absolute inequalities by regions, place of residence, type of health facility and groups (wealth quintile and maternal education). Importantly, Hatt et al13 found that CS in Indonesia has slightly decreased after the economic crisis in 1997. In this paper, we would like to see how this crisis impacted CSRs among different groups of women.
Methods
Source of data
This study used data from Indonesia Demographic Health Surveillance (IDHS). IDHS is a cross-sectional, nationally representative survey conducted every 5 years, led and funded by the Government of Indonesia with the support of the US Agency for International Development. The survey uses standardised questionnaires and rigorous methods for data collection by trained field workers using face to face interviews with women aged 15–49 years old.14 IDHS sampling design employed a stratified two-stage cluster sampling method with response rates reported to be at least 90%, which ensures representativeness of the data.15 16 The first stage of the sampling involved selection of enumeration areas using probability proportional to size approach where areas with larger size have higher chance to be selected as the sample.15 16 This then followed by selecting random sample of households within the selected enumeration areas.15 16 Ethics review has been conducted by DHS and informed consent was obtained from participants. Following the data collection, the survey data were deidentified and are publicly available (https://dhsprogram.com), therefore this study is exempted from ethics review.
We used repeated cross-sections from seven waves of IDHS data: 1991, 1994, 1997, 2002, 2007, 2012 and 2017, covering a span of 30 years from 1987 to 2017. The data collected on each survey year recorded births from the previous 5 years; for example, survey year 1991 covered all birth records starting from the previous IDHS survey in 1987. For women who gave birth multiple times within each survey period, only the most recent birth was included in this analysis, in order to ensure no births were double counted.
Patient and public involvement
This study is an analysis of secondary data. Although members of the public were surveyed, no patients or members of the public were directly involved in its design, conduct, reporting or dissemination.
Outcome: CS indicators
CS data are collected based on women’s self-report to a survey question: ‘Was (NAME) delivered by caesarean, that is, did they cut your belly open to take the baby out?’, which has been demonstrated as reliable.8 17 The primary outcome of this study is CSR, defined as the percentage of all live births born by CS.
Two secondary indicators were analysed: birth rate across different settings (percentage of all live births at public facility, private facility or others (home or community)) and CS timing (whether the decision for CS was made before or after onset of labour pain). This timing difference could be a proxy indicator to determine whether the CS was based on maternal request or due to pregnancy or labour complication.
Inequality assessment
Absolute inequality was estimated by calculating rate difference (RD) in CSRs between two subgroups of interest (eg, richest–poorest) and relative inequality was estimated by calculating rate ratio (RR) between sub-groups (eg, richest:poorest). Trends in inequalities were assessed through changes in absolute and relative inequality measures and summarised using Blakley et al’s inequality typology,18 where, for example, a typology of increasing CSR, decreasing absolute inequality (RD) and decreasing relative inequality (RR) is denoted by ‘↑CSR, ↓RD, ↓RR’.
Exposure: inequality subgroups
We estimated CSRs for each subgroup of five sociodemographic characteristics: type of health facility, regions, place of residence, economic status and maternal education. Type of health facility CSRs and inequalities were estimated by comparing CS births at public and private facilities. Regions were grouped based on the division of six main islands in Indonesia (Java and Bali, Sumatra, Kalimantan, Nusa Tenggara, Sulawesi, and Maluku and Papua).12 19 CSRs and inequalities across regions were estimated by subtracting the CSRs of Java and Bali and Maluku and Papua, as the two regions are the most and least developed areas in Indonesia.12 19 Inequalities in place of residence measured the difference in CSRs between women living in urban and rural locations. Maternal education was categorised by women with no education, or with only primary (no education and primary), secondary and higher. Education-related inequalities were estimated by comparing attendance (regardless of completion) of higher to no education and primary education. Finally, economic status was assessed through wealth quintiles from Q1 (poorest) to Q5 (richest), with economic-related inequalities assessed by comparing CSRs between the richest and poorest quintiles.
Wealth quintiles were included in IDHS variables for years 2002–2017. For survey year 1991, 1994 and 1997, wealth quintile variables were not included, therefore they were calculated independently using the DHS wealth quintile construction guide.20 Wealth quintiles were calculated using the data collected in the household questionnaires consisting information around household ownership (eg, housing characteristics of flooring, roofing, wall and toilet type, water source), ownership of consumer items and other characteristics related to economic status.20 21 These data were then assigned to a factor score using principal components analysis to develop wealth quintile index from Q1 (poorest) to Q5 (richest)20 21
Statistical analysis
95% CI was used to report uncertainty of our CSRs and inequality estimates. Calculation of the 95% CIs is accounted for the two-stage cluster sampling design by applying survey weights appropriately. This also made the results representative of the national and regional corresponding populations.22 All the analyses were conducted using Stata V.16 software (StataCorp. 2019. V.16. College Station, Texas, USA: StataCorp LLC) and all figures were plotted using ggplot2 package in R programming software (R Core Team (2019). R Foundation for Statistical Computing, Vienna, Austria).
Results
Trends of birth and CS, according to health facility type
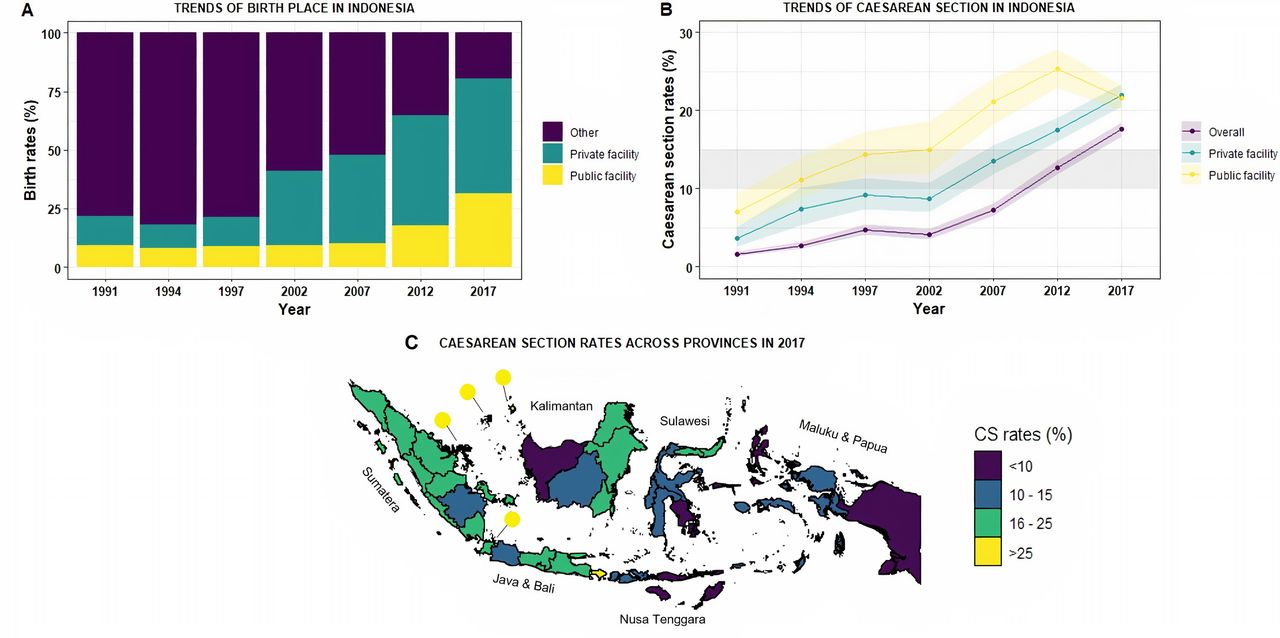
Table 1 shows trends in CSRs and the inequalities of interest over the 30-year study period. Figure 1A shows the breakdown of births by facility type between 1991 and 2017. The proportion of women giving births at health facilities in Indonesia has increased, especially after 1997 when economic crisis hits the country. A higher proportion occurs in private facilities (in comparison to public facilities) across all years. In 2017, the end of the study period, 49.4% (95% CI 48.0 to 50.9) of births occurred in private facilities, 31.2% (95% CI 30.1 to 32.4) in public facilities and 19.3% (95% CI 18.1 to 20.7) of births occurred outside a health facility (see online supplemental table 1).
Supplemental material
Trends in inequalities of CSRs in Indonesia from 1997 to 2017

Trends of birth and CSRs from 1991 to 2017 and regional variations on CS rates in 2017. Panel A shows trends of births at different type of birth facility in Indonesia from 1991 to 2017, while panel B shows CSRs at different type of birth facility. Detailed table listed on online supplemental table 1. The grey horizontal band on panel B indicates the 10%–15% optimal range for CS at a population level, while the coloured band indicates the 95% CI of CSRs estimate at among all births, among births at private facilities, and among births at public facilities. Panel C shows CSRs across 34 provinces in Indonesia, listed on online supplemental table 2. CS, caesarean section; CSRs, CS rates.
Supplemental material
Figure 1B shows trends in CSRs according to facility type. Overall, CSRs increased from 1.6% (95% CI 1.3 to 1.9) in 1991 to 17.6% (95% CI 16.7 to 18.5) in 2017. This increase largely occurred after 2002. For most years, CSRs were higher in public compared with private facilities. However, in 2017, the CSR in public facilities fell to a similar level as private facilities (2017 RR: 1.0 (95% CI 0.9 to 1.1)) (figure 1B).
CS inequalities based on type of health facility
Figure 2 depicts trends of CSRs across five sociodemographic characteristics and shows widening absolute inequalities of CSRs on each sociodemographic characteristics, except in type of health facility.

Trends in absolute inequalities of CS across different socioeconomic determinants in Indonesia from 1991 to 2017. Vertical blue lines indicate the absolute difference of CSRs across different socioeconomic status. The grey horizontal band indicates 10%–15% optimal range for CS at a population level. Detailed table listed on table 1. CS, caesarean section; CSRs, CS rates.
In terms of inequalities of CSR across health facility, figure 2A shows from 1991 to 2012, CSRs were consistently higher in public facilities (in comparison to private facilities). In the context of greater increases in CSR in public facilities, absolute inequality was increasing, with relative inequalities falling (a typology of ↑CSR, ↑RD, ↓RR) between 1991 and 2012. This changed in 2017—CSR decreased in public facilities and, as a result, were similar to the CSR observed in private facilities, which continued on an upward trend (figure 2A, table 1). When considering the whole study period, this results in a typology of increasing CSRs but decreasing absolute and relative inequalities (↑CSR, ↓RD, ↓RR).
Regional and provincial inequalities of CS in Indonesia
Figure 1C shows the highest CSRs (>25%), which are observed in Western Indonesia (Java & Bali, Sumatera, Kalimantan) and the lowest CSRs (<10%) are observed in Eastern Indonesia (Nusa Tenggara, Sulawesi, Maluku & Papua). Online supplemental table 2 lists the CSRs by province in 2017.
Figure 2B shows CSR trends according to regions. Between 1994 and 2017 (1991 data not recorded), CSRs are increasing in each region. They are persistently higher in the more developed regions of Java and Bali in Western Indonesia compared with the less developed regions of Maluku and Papua in Eastern Indonesia. For example, in 2017, the relative inequality comparing Java and Bali to Maluku and Papua is 2.0 (95% CI 1.5 to 2.5) and the absolute inequality is 9.3% (95% CI 6.6% to 12.1%).
To assess how these inequalities have changed over time, the study period can be split in two. First, up to 2002, there are small increases or stable in CSRs. However, after 2002 CSRs increased in all regions, but at a faster rate in more developed regions, leading to increasing absolute inequalities. Taking the study period as a whole, this has led to inequalities increasing on both the absolute and relative scale, resulting in a typology of ↑CSR, ↑RD, ↑RR.
Urban and rural inequalities of CS
Figure 2C shows CSRs in urban and rural areas. Taking the study period as a whole, CSRs have increased in both rural and urban areas, and CSRs are higher in urban than rural areas. For example, in 2017, the relative inequality comparing urban to rural areas was 1.9 (95% CI 1.7 to 2.1) and absolute inequality was 10.7% (95% CI 8.9 to 12.5).
Between 1991 and 2002 CSRs increased from 3.1% (95% CI 2.4 to 4.1) to 6.7% (95% CI 5.5 to 8.1) in urban areas but remained stable in rural areas. Similar to the regional trends outlined above, from 2002, there is a clear increase in CSRs in both urban and rural areas. Increasing rates in urban and rural areas have not led to equitable CSRs, with increasing absolute inequality and large (but decreasing) relative differences, resulting in a typology of ↑CSR, ↑RD, ↓RR.
Economic and maternal education inequalities of CS in Indonesia
Figure 2D,E shows CSRs according to wealth quintiles and maternal education. Across the whole study period, the advantaged groups (richest quintile and higher education) have higher CSRs. For example, in 2017, the relative inequality comparing women in the wealthiest quintile to the least wealthy is 4.9 (95% CI 4.1 to 5.8) and the absolute inequality is 25.6% (95% CI 23.1 to 28.2).
For the whole study period, CSRs steadily increased in the wealthiest quintile and higher education groups. This was not the case in lower wealth and education groups. Similar to the trend outlined previously in disadvantaged geographical regions and rural areas, there was little to no increase in CSRs prior to 2007. This led to increasing relative and absolute wealth and education inequalities from 1991 to 2002; a typology of ↑CSR, ↑RD, ↑RR.
From 2007, however, CSRs began to increase in the lower wealth and lower education groups. This led to absolute inequalities closing or remaining stable among the richer (Q4) group. However, even with these CSR increases for less advantaged social groups, absolute inequalities comparing the most and least advantaged groups clearly increased from 1991 to 2017 and relative inequalities increased or remained stable, resulting in an inequality typology of ↑CSR, ↑RD, -RR for the whole study period.
Births across facility type, regions and wealth quintiles
Figure 3 depicts differences in mode of birth by region, type of facility and wealth quintiles. It shows that in 2017, higher proportions of women in Western Indonesia (Java and Bali, Sumatra, Kalimantan) have more births (vaginal and CS) at private compared with public facilities. This trend, however, reversed in Eastern Indonesia (Nusa Tenggara, Sulawesi, Maluku and Papua), where higher proportions of women are observed to give births at public compared with private facilities. Furthermore, higher proportions of CS are also observed in Western Indonesia as compared with Eastern Indonesia, where proportions of vaginal births are higher. Across all regions, as economic status increases, more births occur in private than public facilities.

Differences in mode of birth by main regions, type of facility and socio-economic status in Indonesia in 2017. This figure shows patterns in 2017 (CS birth at public and private, vaginal birth at public and private and vaginal birth at home) based on main island divisions and wealth quintiles. It shows higher proportion of births, both vaginal and CS births, are occurring at private facilities in Western Indonesia, but this pattern is reversed in eastern Indonesia where higher proportions of births (vaginal and CS births) are observed at public facilities. Higher CSRs are also observed at Western Indonesia in comparison to eastern Indonesia, where the rate of vaginal births is higher. It also demonstrates how births (vaginal and CS births) at private facilities are increasing as economic status increases. Full table of contributing data is available in online supplemental table 3. CS, caesarean section; CSRS, CS rates.
Supplemental material
Timing variations in CS
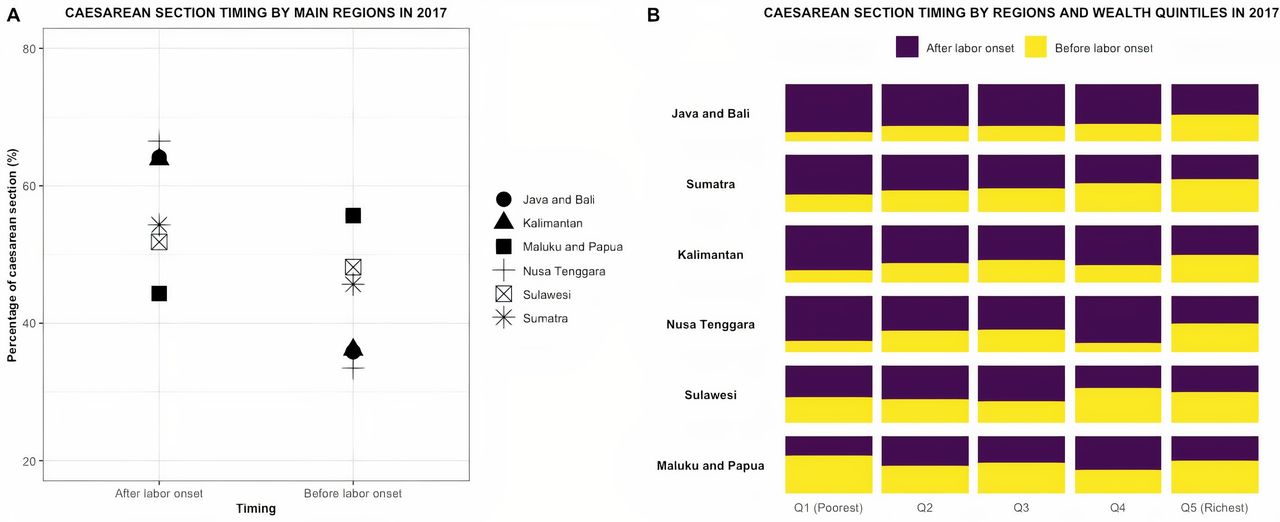
The decision for CS was most often taken after the onset of labour. Figure 4A shows that the timing of CS in every region was decided after onset of labour, except in Maluku and Papua regions, where more than half of CS were decided before the labour onset (55.7%, 95% CI 39.7 to 70.5). Further analysis on timing of CS decisions based on women’s economic status shows that in Western Indonesia, the CSRs that were decided before the labour onset were increasing as wealth increases (figure 4B). However, this pattern is not observed in Eastern Indonesia.

CS timing across regions and economic status. Panel A shows CS timing across main regions, based on major island divisions in Indonesia (Java and Bali, Sumatra, Kalimantan, Nusa Tenggara, Sulawesi, Maluku and Papua). Panel B shows CS timing across main regions and economic status in Indonesia. Full table can be seen in online supplemental table 4. CS,caesarean section.
Supplemental material
Discussion
In Indonesia, there have been substantial increases over 30 years in facility-based births (21.9% to 80.7%) and CSRs (1.6% to 17.6%). Large variations in CSRs in Indonesia are observed across regions, type of health facility, place of residence, wealth quintiles and maternal education, indicating that likely overuse and underuse of CS coexist. Higher CSRs are observed mostly in the more developed Western Indonesia, while lower CSRs are observed in Eastern Indonesia. Similarly, highest CSRs are found in urban, more educated, affluent or advantaged groups. Alarmingly, absolute inequalities of CS have widened during the last three decades across all sociodemographic characteristics examined, except type of health facility, where CSRs are similar in public and private facilities in 2017.
Health policies and insurance scheme transformations have contributed substantially to the increase of facility-based births in Indonesia in the past 30 years. The implementation of The Indonesian Village Midwife Program in 1989, which still continues through 2020, to ensure ‘a midwife in every village’ has increased skilled birth attendance, home births attended by professional and facility-based births after 1991.13 23–25 Insurance scheme transformations further strengthened these improvements. For example, the implementation of health insurance scheme post economic crisis called Social Safety Net in 1998 has increased utilisation of healthcare by the poorest by 6.5%.25 26 Additionally, poor women with Jamkesmas (health insurance for the poor and near poor) are 17% more likely to have skilled birth attendance and 19% more likely to give birth at health facilities.27 A recent published study also found that enrolment in Jaminan Kesehatan National (national health insurance) has increased utilisation of maternal health services (antenatal care 4+visits by 7.4%, facility-based births by 10.2%, skilled birth attendance by 3.0% and postnatal care by 4.0%), with larger impact among women live in Eastern Indonesia and among poor women.28
The increase in facility-based births also coincides with increases in CS, which aligns with the trend of overmedicalisation once women enter the health facility. Since 1991, CSRs rose consistently, except from 1997 to 2002 when the economic crisis hits Indonesia. While this economic crisis does not seem to be associated with any reductions of facility-based birth (figure 1A),13 there is a slight downward trend or stagnation of the CS following this recession, which is more accentuated among the disadvantaged groups across each five characteristics in the same period (figure 3). After the economic crisis, CSRs continued to steadily increase (figure 1B). Although the data do not allow to infer casualty, we hypothesised that the health insurance schemes targeting the poor may have had some effect on CS, particularly since 2002 where there is a clear increase of CS in rural areas, among the women in the poorest quintiles, and in no educated or only primary educated women. However, widening gaps persist in CSRs between the advantaged and disadvantaged groups (figure 3).
Similar to global trends, this study found that CS in Indonesia is increasing with widening inequalities across regions, place of residence, wealth quintiles and maternal education. As in most countries such as in Ghana, Nigeria, Vietnam, Brazil, in Indonesia, CSRs are higher in Western Indonesia, urban areas, and among richer, more educated women.8 29–33 The reason why CSRs are increasing and are higher in these populations may vary by context, but intersectional characteristics between living in more affluent areas coupled with higher education and financial capability may increase women’s exposure to information, societal views and even fashions (e.g. media, internet, women’s magazines) on options and autonomy to choose for mode of childbirth, which may shift their preference towards CS compared with vaginal births.34 Research into understanding the reasons and dynamics underpinning this trend are urgently needed to design interventions to optimise the use of CS.
It is important to note that the current COVID-19 pandemic might further exacerbate the increase of CS in Indonesia, especially in light of conflicting information between media and national guidelines, where media reported that all pregnant women are mandated to have CS during the pandemic despite risk-based decision-making suggested by the national guidelines.35–38 The current pandemic serves as an important reminder in understanding the main drivers of increasing CS and its inequalities in Indonesia, which could be then used to optimise CS use in the country.
In Indonesia, more women gave birth in private facilities compared with public facilities. This is divergent from the situation in other countries in Africa, Latin America and Asia, where private facility births have only begun increasing in recent years.39–43 There might be several factors contributing to higher births at private facilities in Indonesia, including insurance schemes and women’s preferences. Indonesia’s insurance health system allows women to choose their health facility (public or private), provided that the facility has cooperated with the insurance company to accept insured patients and most private facilities do.44 45 Preferences for private facilities due to reputation, especially in urban areas,46 may translate in to higher proportions of women giving birth at private instead of public facilities. Unlike the trend on facility-based births; however, the CSRs were higher across time in public compared with private facilities, except in 2017, when the rates are similar. This trend is unique compared with other countries in the world where CSRs are higher at private compared with public facilities.6 While there are no existing studies explaining this trend, some possible causes for this are that women in Indonesia might not request to have CS or see advantages of CS as women in other countries.47 Further research is needed to understand this unique trend in Indonesia. It is also important to note that the decrease of CS in public facilities and the increase of CS in private facilities during the last 30 years (figure 1B) could also be due to insurance schemes and women’s preference for private services. Thus, this does not eliminate future possibility where private facility’s CSRs are higher compared with public facilities.
This study found that the proportion of CS decided before labour onset in Western Indonesia was increasing as wealth increases. The proportion of CS before labour onset may act as a proxy indicator for maternal request, therefore, our analysis may suggest that women’s request for CS is higher among richer women and in more advantaged areas. While there is currently no research exploring women’s motivations for requesting a CS in Indonesia, studies from other countries have described that women’s preferences for CS are due to fear of labour pain, previous painful childbirth, previous CS, perceived pregnancy risk, CS deemed as ‘safer, quick, painless and easy’ than vaginal birth, prioritising women and baby’s health and women’s ‘right to choose’ CS.48–52 Further research is needed to understand women’s opinions and views related to CS in Indonesia. An improved understanding of these views could lead to the development of health education materials that communicate the pros and cons of different modes of birth.
Factors related to the health systems, facilities and providers might also influence the CSRs.47 Research conducted in other settings found that some health providers prefer CS to vaginal birth due to uncertainties in birth timing, belief that CS is a safer option, risk of complications during vaginal birth, fear of litigation, women’s autonomy, financial incentives, personal convenience and not enough labour rooms at the facility.48 51 53 Indonesia’s health system might also unintentionally reward health providers to undertake CS, as higher payments for CS compared with vaginal birth is routine in the country. Therefore, Indonesia’s future increasing CSRs might also be due to its health system and further research into factors related to providers and their views are warranted.
Implications for future policies, programmes and research
A key implication of this study is that CSRs are highly variable across different settings in Indonesia, which suggests both potential overuse and underuse. Therefore, any public health programme would need to be flexible to optimise use of CS. This includes simultaneously implementing measures to reduce medically unindicated CS among populations with potential overuse and improve access to safe CS in areas where underuse may be suspected, specifically in Eastern Indonesia. Recent systematic reviews have summarised types of non-clinical interventions to optimise CS use, intervening at different levels from women and families, healthcare providers, to health systems.54 55 These interventions include childbirth preparation programmes for women and families, implementation of clinical guidelines and protocols, mandatory second opinion for CS, audit and feedback, equalising fees across mode of births and implementation of collaborative models care at health system level.54 Additionally, monitoring CSRs and policies at health facility, regional and national level should be implemented. WHO has recommended the use of Robson classification to evaluate, monitor and compare CSRs.1 56 57 The Robson classification system classifies all women into one of 10 groups based on give obstetric characteristics (parity, number of foetuses, previous CS, onset of labour and gestational age).56 Furthermore, the national monitoring should include potential CS inequalities across different dimensions, such as main islands, provinces, urban and rural residence, economic status and education.58 59 These disaggregated data are crucial ‘to identify where and why inequalities exist’ and ensure that public health programmes are responsive to health equity needs by continuously tailoring action according to local evidence and data.58 Finally, qualitative research is needed to understand preferences, drivers and barriers to undertake CS at individual, family, provider and health system levels. This will facilitate the development of context-appropriate interventions to optimise CS use at different settings in Indonesia.
Strengths and limitations
To our knowledge, this study is the first comprehensive study exploring CS trends and inequalities in Indonesia for the past 30 years. The study used large nationally representative data to examine CS trends and inequalities. This is the first analysis interpreting how inequalities are increasing and decreasing in Indonesia and provides critical evidence of an increasing trend and worsening inequalities of CS throughout several geographic and sociodemographic dimensions.
This study also has some limitations. First, the data do not include the indications for CS, therefore, we cannot estimate the proportions of medically indicated or unindicated CS or conduct further analyses based on obstetric characteristics, such as exploring CSRs by Robson group.60 61 While we have used information of the timing of the CS (before or after the labour pain onset), which is available in the 2017 IDHS data, as a proxy indicator for CS by maternal request or due to complications, we cannot reliably ensure the clinical nature of either timing. Finally, despite the clear inequalities of CS captured in this study based on different sociodemographic characteristics, there could be other characteristics in which CS inequalities may be observed among different groups of women in Indonesia, such as religion.
Conclusion
At the national level, the CSR in Indonesia has increased from 1.6% in 1991 to 17.6% 2017. By exploring CSRs among different subgroups, we found that the national average hides wide and increasing inequalities across different sociodemographic groups of women suggesting that overuse and underuse coexist. Monitoring inequalities in CS is critical to optimise CS use, achieve equity in maternity services and Universal Health Coverage. Improving understanding of the underlying crucial drivers for these trends in Indonesia and, particularly, of women’s and providers’ perspectives and preferences for childbirth should be prioritised to optimise the use of CS.
Acknowledgments
We would like to acknowledge the support from our institutions in facilitating the completion of this work. RIZ is sponsored by Australian Awards Scholarship (ST000SSF2) for her master's education, funded by Australian Department of Foreign Affairs and Trade (DFAT), and received an open access publication award from the Centre for Health Equity (University of Melbourne School of Population and Global Health). GD is supported by a National Health and Medical Research Council of Australia funded Centre of Research Excellence in Disability and Health (APP1116385). APB is supported by UNDP/UNFPA/UNICEF/WHO/World Bank Special Programme of Research, Development and Research Training in Human Reproduction, Department of Sexual and Reproductive Health and Research, WHO. MAB’s time is supported by an Australian Research Council Discovery Early Career Researcher Award (DE200100264) and a Dame Kate Campbell Fellowship (University of Melbourne Faculty of Medicine, Dentistry, and Health Sciences).
References
Supplementary materials
Supplementary Data
This web only file has been produced by the BMJ Publishing Group from an electronic file supplied by the author(s) and has not been edited for content.
Footnotes
Handling editor Sanni Yaya
Twitter @ranazahroh
Contributors RIZ, MAB, GD and APB designed the study. RIZ conducted the data analysis and took the lead in manuscript writing with inputs from MAB, GD and APB. All authors discussed and interpreted the results, provided critical feedback, commented on the manuscript and agreed on the final version of the manuscript for publication.
Funding The authors have not declared a specific grant for this research from any funding agency in the public, commercial or not-for-profit sectors.
Map disclaimer The depiction of boundaries on this map does not imply the expression of any opinion whatsoever on the part of BMJ (or any member of its group) concerning the legal status of any country, territory, jurisdiction or area or of its authorities. This map is provided without any warranty of any kind, either express or implied.
Competing interests None declared.
Patient consent for publication Not required.
Data availability statement The data that support the findings of this study are openly available on The DHS Program website at https://dhsprogram.com/.
Supplemental material This content has been supplied by the author(s). It has not been vetted by BMJ Publishing Group Limited (BMJ) and may not have been peer-reviewed. Any opinions or recommendations discussed are solely those of the author(s) and are not endorsed by BMJ. BMJ disclaims all liability and responsibility arising from any reliance placed on the content. Where the content includes any translated material, BMJ does not warrant the accuracy and reliability of the translations (including but not limited to local regulations, clinical guidelines, terminology, drug names and drug dosages), and is not responsible for any error and/or omissions arising from translation and adaptation or otherwise.