Article Text

Abstract
Introduction Despite renewed commitment to universal health coverage and health system strengthening (HSS) to improve access to primary care, there is insufficient evidence to guide their design and implementation. To address this, we conducted an impact evaluation of an ongoing HSS initiative in rural Madagascar, combining data from a longitudinal cohort and primary health centres.
Methods We carried out a district representative household survey at the start of the HSS intervention in 2014 in over 1500 households in Ifanadiana district, and conducted follow-up surveys at 2 and 4 years. At each time point, we estimated maternal, newborn and child health coverage; economic and geographical inequalities in coverage; and child mortality rates; both in the HSS intervention and control catchments. We used logistic regression models to evaluate changes associated with exposure to the HSS intervention. We also estimated changes in health centre per capita utilisation during 2013 to 2018.
Results Child mortality rates decreased faster in the HSS than in the control catchment. We observed significant improvements in care seeking for children under 5 years of age (OR 1.23; 95% CI 1.05 to 1.44) and individuals of all ages (OR 1.37, 95% CI 1.19 to 1.58), but no significant differences in maternal care coverage. Economic inequalities in most coverage indicators were reduced, while geographical inequalities worsened in nearly half of the indicators.
Conclusion The results demonstrate improvements in care seeking and economic inequalities linked to the early stages of a HSS intervention in rural Madagascar. Additional improvements in this context of persistent geographical inequalities will require a stronger focus on community health.
- health systems
- child health
- health services research
- maternal health
- cohort study
This is an open access article distributed in accordance with the Creative Commons Attribution Non Commercial (CC BY-NC 4.0) license, which permits others to distribute, remix, adapt, build upon this work non-commercially, and license their derivative works on different terms, provided the original work is properly cited, appropriate credit is given, any changes made indicated, and the use is non-commercial. See: http://creativecommons.org/licenses/by-nc/4.0/.
Statistics from Altmetric.com
Key questions
What is already known?
Low- and middle-income countries require substantial investments in health system strengthening (HSS) and universal health coverage (UHC) to reach the health-related Sustainable Development Goals.
There is a major gap in the evidence to inform HSS and UHC policies due to challenges in the assessment of such complex interventions, with cross-benefits at the population level.
What are the new findings?
After 4 years of integrating HSS activities across all levels of care within a government district, coverage increased by more than 4% per year for all recommended vaccines, for care seeking in children and adults, and for facility birth deliveries.
We also observed overall improvements in maternal care coverage and child mortality rates in the HSS catchment, but differences with the control catchment were modest and not statistically significant.
While economic inequalities in the coverage of most child and maternal health indicators were reduced, geographical inequalities worsened in nearly half of the indicators evaluated.
Key questions
What do the new findings imply?
HSS interventions can have positive population-level effects by increasing care seeking and reducing economic inequalities, both central goals of UHC policies.
Important gaps in geographical access to care can persist unless public health systems adequately strengthen community health programmes in remote, rural areas.
Our study highlights the value of iterative learning between HSS implementation and impact evaluation, based on the dynamic integration of data and analytics at multiple levels of a health district.
Introduction
As the world mobilises to develop vaccines and treatments for COVID-19, half of the global population lacks access to the essential health services necessary for preventing and treating the burden of illnesses that have been with us for far longer.1 2 To address this, most countries have renewed their commitment to universal health coverage (UHC) to achieve access to quality primary care for all,3 through policies that tend to focus on demand-side financial coverage; that is, reducing financial barriers to care. Achieving UHC also requires health system strengthening (HSS) to ensure that supply-side factors (eg, staffing, equipment and supplies) are consistently available for the provision of healthcare. The WHO has estimated that nearly three-quarters of all additional investments for low- and middle-income countries between 2015 and 2030 should be allocated to HSS, UHC and other sector-wide approaches, amounting to up to 300 billion US$ (US dollars) per year.4 Though such investments could prevent 97 million premature deaths by 2030,4 there is insufficient evidence to guide the design of national policies aimed to achieve both the demand and supply side of UHC.5–7
A key challenge for generating evidence is that these policies are complex, span multiple levels of the health system and have cross-cutting benefits for population health, especially for vulnerable groups. To account for this, a major focus in global health evaluation involves the follow-up of a comprehensive set of coverage and mortality indicators to measure progress on flagship sector-wide initiatives linked to the Sustainable Development Goals (SDGs).1 8 9 Key priorities of these initiatives are to improve aggregate health outcomes while reducing health inequalities.10–13 Multilateral health organisations such as the WHO and UNICEF have developed toolkits (eg, HEAT and EQUIST) to promote the adoption of equity analyses into national health planning and evaluation.14 15 These macro-level approaches allow progress across countries to be compared, providing insights into which policies may affect change. However, indicators are generally aggregated at the national level and available only every 5 years, creating challenges for inferring causality.16
Local HSS initiatives can offer opportunities to measure changes at more granular temporal and spatial resolutions in better controlled environments. Yet, most assessments of local health system performance still rely on facility-based data about service delivery, which are not representative of coverage at the population level,17 and few initiatives measure their impact on health equity.18–20 Given the complex nature of HSS and UHC, the health district is a key unit of analysis and implementation, but district-level evaluations are still scarce.16 21–24 Even experimental trials that successfully demonstrate impact locally using robust evaluation methods generally fail to scale because the data and information loops necessary to continuously inform scale-up are not integrated with policy.25–28 We accordingly lack evidence from data that are representative at the population level and sufficiently comprehensive to capture the cross-cutting benefits of HSS and UHC initiatives, while simultaneously being granular enough to inform policy and implementation. In this sense, adding adaptive evaluation designs that use robust data collection and analytics (eg, observational and quasi-experimental) in parallel to HSS interventions being implemented across the developing world can generate rigorous evidence while informing the implementation process via dynamic information loops and iterative learning.
Here, we take advantage of an HSS initiative in a rural district of Madagascar, a country with one of the least-funded health systems in the world.29 Starting in 2014, the non-governmental organisation, PIVOT, partnered with the government of Madagascar to establish a model health system in the southeastern district of Ifanadiana. A range of HSS programmes were initiated in a third of the district, ensuring health system readiness, improving clinical programmes and supporting integrated information systems at all levels of care. The first 2 years showed improved quality and coverage of primary care services,30 and declines in child mortality rates.31 The scope of the programmes and geographical footprint are being progressively scaled, and the government of Madagascar has designated Ifanadiana among the districts for piloting the national UHC strategy. Combining surveys from a district-representative longitudinal cohort32 with routine health system data, the goal of this study was to demonstrate how the dynamic integration of granular data and analytics at multiple levels of a health district can be used to evaluate the impact of local HSS initiatives, providing a platform for adaptive implementation. We assessed changes in health system coverage associated with the HSS intervention, with special attention to the evolution of economic and geographical inequity. Explicit information loops between research and implementation via a web-based interface make cohort results accessible to programme managers for operational use throughout the scale-up phase.
Methods
Study site and HSS intervention
Ifanadiana is a rural health district of approximately 180 000 people located in the region of Vatovavy-Fitovinany, in southeastern Madagascar. Per Ministry of Public Health (MoPH) norms, Ifanadiana district has one reference hospital, one main primary care health centre (CSB2) for each of its 15 communes (subdivision of a district with ~15 000 people; two additional CSB2s were built in 2016 and 2018), six additional basic health centres for larger communes (CSB1) and one community health site with two community health workers (CHW) for each of its 195 fokontany (subdivision of a commune with ~1000 population). The integrated district-level health system strengthening intervention (referred to as idHSS) carried out by the MoPH-PIVOT partnership is guided by existing MoPH policies and is implemented across all three levels of care in the district (community, health centre and hospital). This intervention (summarised in table 1 and online supplemental table S1) is structured through the integration of clinical programmes, health system ‘readiness’ and information systems. The clinical programmes include child health, with a focus on malnutrition and integrated management of child illness; maternal and reproductive health; social support; and infectious disease programmes, with a focus on tuberculosis, malaria and emerging diseases. Clinical programmes are implemented throughout community health sites, primary healthcare centres and district hospital (details can be found in33). Readiness includes infrastructure and sanitation, staffing and equipment to improve the quality of care; procurement systems; an ambulance network; trainings, frequent supervision and coaching of health staff. As part of the vision for UHC to increase healthcare access and reduce financial vulnerability, user fees are removed at all levels of care via payments from PIVOT to health facilities on behalf of patients (Section S1 and online supplemental table S2), and social support is provided to vulnerable patients. The core activities in the first 3 years (2014 to 2016) covered four communes with approximately one-third of the population of Ifanadiana (referred to as ‘idHSS catchment’). In 2017, idHSS activities expanded to a fifth commune. Some activities such as medical staff recruitments and strengthened information systems spanned the whole district (online supplemental table S1). The idHSS intervention, initially modelled after an earlier experience in HSS in Rwanda,34 35 is being tailored over time in collaboration with the government to respond to coverage gaps and intervention deficiencies identified through an iterative learning process that uses health system and population-level data (online supplemental table S1).
Supplemental material
Summary of HSS interventions implemented in Ifanadiana district between 2014 and 2017, classified by building block of HSS* affected
In addition to the idHSS intervention, during this period, the population of Ifanadiana benefited from two other notable programmes that covered both the idHSS catchment area and the rest of the district (referred to as ‘control catchment’). The PAUSENS project, funded by the World Bank, provided a basic package of services free of charge in all 13 CSB2 through a voucher system for every woman attending the health centre for antenatal, delivery or postnatal care (first 6 weeks) and children under age 5 with any illness (see Appendix, Section S1).36 The project also included training, support for child vaccination in remote areas and some equipment to health centres. The Mikolo project, funded by USAID, provided support to a network of 150 CHWs in the fokontany further than 5 km from a health centre in eight communes in Ifanadiana, four of which were in the idHSS catchment and four in the control catchment. The project organised annual trainings and periodic supervision, provided some equipment, supplies and an initial stock of medicines to each CHW. For more details, see online supplemental table S1. The main difference between the idHSS catchment and the control catchment was the implementation of the idHSS intervention by the MoPH-PIVOT partnership.
Patient and public involvement
Patients or the public were not involved in the design, conduct, reporting or dissemination plans of our research.
Population survey data: the IHOPE cohort
A longitudinal cohort study known as the Ifanadiana Health Outcomes and Prosperity longitudinal Evaluation (IHOPE), or IHOPE cohort, was initiated in 2014 to obtain demographic, health and socio-economic information from a representative sample of 1600 households in Ifanadiana district over time.32 Questionnaires were mostly adapted from the Demographic and Health Survey (DHS).37 The Madagascar National Institute of Statistics (INSTAT), which implements all major national health surveys in the country, was responsible for data collection, survey coordination, training and oversight. A two-stage sample was used, which stratified the district by the initial idHSS and control catchments. Eighty clusters, half from each stratum, were selected at random from enumeration areas mapped during the 2009 census, and households were then mapped within each cluster. Twenty households were selected at random from each cluster.
The first wave of data collection was conducted between April and May of 2014. Individual face-to-face interviews were conducted with women aged 15 to 49 years and men aged 15 to 59 years (usual residents or visitors) in 1522 of the sampled households (95.1% response rate). The original 1600 households were revisited between August and September of 2016 and again between April and May of 2018; any missing or refused households were replaced with others from the same cluster using a predefined random replacement list. Overall, 1514 households were interviewed during the first follow-up survey in 2016 (94.6% response rate) and 1512 during the second in 2018 (94.5% response rate). All residents, including children, had weight and height measured (or length in the case of infants). Data collected in the questionnaires included, among others, household composition (size, genders and ages); indicators of socio-economic status (education, employment and household durable assets); illness in last 30 days for all household members and care seeking for illness; preventive behaviour (bed net ownership, access to water and sanitation); women’s reproductive history and care seeking behaviour for reproductive health; children’s health, development and care seeking for illness; adult, maternal and child mortality.
French and Malagasy questionnaires used in the cohort, as well as data collection protocols, were standardised and validated for Madagascar during previous national surveys carried out by INSTAT. All adults (≥15 years) provided verbal consent for the in-person interview and anthropometric measurements. Parents or guardians provided consent for children ≤5 years of age. INSTAT provided survey data to the investigators with all individual identifiers removed and with geographical information at the cluster level. Spatial boundaries of each cluster were made available to the investigators and are stored separately; this information will not be published or shared publicly. Further details on data collection and survey design are available in.32
Health system utilisation data
We obtained data for the period of January 2013 to December 2018 from the MoPH for 13 CSB2 in Ifanadiana district on the number of new individuals per month attending each health centre for outpatient consultations or maternal care. We excluded two CSBs that did not exist for this 6-year period (built in November 2016 and April 2018), as well as the six CSB1 in the district because these lack medical doctors and provide a more limited number of health services. Given that the idHSS intervention started in early 2014 (shortly after the baseline survey) and affected utilisation rates that year, we included health system utilisation data since 2013 in order to have a true baseline before the idHSS intervention. These data were available from the health centres’ monthly reports to the district (RMA), which are aggregated from the health centres’ registers every month by MoPH staff. As a component of the idHSS intervention, data quality was maintained through joint MoPH-PIVOT supervisions carried out every 3 months at a subset of health centres to compare RMA values with registry data (see38 for more details). Starting in May 2015, the MoPH changed the estimation and reporting of outpatient utilisation rates. Thus, all subsequent utilisation data were gathered directly from the registers to ensure consistent estimates throughout the 2013 to 2018 period. Information on total catchment population for each health centre was obtained from official MoPH records. Consistent with MoPH estimates, catchment population of children under 5 years of age, expected number of pregnant women and expected number of deliveries were set at 18%, 4.5% and 4% of the total catchment population, respectively. Although official population data are sometimes deemed inaccurate, we previously showed that estimating catchment populations using available data for our district from other recognised sources such as WorldPop39 did not change the results of per capita utilisation rates analyses.38
Analysis of coverage and mortality rates from IHOPE cohort data
Under-five mortality at the population-level was estimated using the synthetic life-table method for DHS surveys.40 Under-five mortality was defined as the probability of death before age 60 months per 1000 children born alive. For each survey wave, we used information from the 5 years prior to the survey, which comprised a sample of 4063 children for 2014, 4037 children for 2016 and 3788 children for 2018. From these estimates, absolute and relative changes per year for each indicator and catchment area were estimated in univariate linear models, and these were used to estimate the difference over time between the two areas. In addition to these cross-sectional estimates, the difference in under-five mortality for the 2514 children followed-up over the 4 years was also assessed in each area. From this longitudinal analysis, incidence rates of death per person-year in children under 5 years of age were calculated using a Poisson regression.
Coverage indicators (see list in table 2 and online supplemental table S3) were estimated using standard definitions for DHS surveys.40 Vaccination coverage was defined as the proportion of children aged 12 to 23 months who received all recommended vaccines (three doses of polio and DTP, one dose of BCG and measles). Access to treatment was estimated as the proportion of children under 5 years of age who were ill with fever, acute respiratory infection or diarrhoea in the 2 weeks prior to the survey and sought medical treatment (at a hospital, health centre or community health worker). In order to measure the effect of the idHSS intervention on maternal health service coverage, indicators were estimated for the last pregnancy during the 2 years preceding the survey. In addition, to track a summary indicator of maternal, newborn and child health (MNCH) coverage, we estimated co-coverage indices (three interventions or less; five interventions or more) for women and children under 5 years of age and a modified version of the composite coverage index (CCI)41 that included all standard maternal and child interventions except for family planning, which was not available in the 2014 survey.
Model predictions of annual change in coverage associated with the idHSS intervention and in the rest of Ifanadiana district (control), 2014 to 2018
Coverage and mortality indicators were calculated for 2014, 2016 and 2018 both in the idHSS catchment (which changed over time) and in the control catchment (the rest of the district). Yearly changes in coverage between the idHSS and control catchments were modelled from individual-level data using multivariate logistic mixed regressions that included a random intercept at the cluster level, using the following formula:

Where Yij is the average coverage for yeari and clusterj; catchment reflects whether the household of the individual was part of the initial idHSS catchment to account for baseline differences in these two areas; exposure reflects the number of years of exposure of the cluster to the idHSS intervention to account for the expanding idHSS catchment; β1 is the yearly change in the control catchment, β2 is the baseline difference in utilisation between the initial intervention catchment and the control catchment and β3 is the yearly change associated with the idHSS intervention; bj and εj are the random intercept and error associated with each cluster, respectively. Results were reported as adjusted OR, and as predicted yearly change (using only the model’s fixed effects). The 95% CIs for yearly changes were estimated through parametric bootstrap (400 simulations per indicator). Data were entered into CSPro and all analyses were done using R statistical software, V.3.1.242 and R-package lme4 with the exception of population-level mortality rates and associated 95% CIs, which were calculated with SAS 9.3,43 and the observed under-five mortality incidence rate ratios, which were calculated with Stata, V.15.44 Changes of coverage in the initial idHSS catchment area (four communes) and in the control catchment were also estimated and compared using difference-in-difference analyses (online supplemental table S4) for consistency with analyses in our previous 2-year impact evaluation.31 Sampling weights that adjusted for unequal probability of selection due to stratification and non-response were calculated for household, women’s and men’s surveys. Estimates were obtained using survey commands available in R-package survey and applicable sampling weights.45
Analysis of geographical and economic inequalities in healthcare coverage from IHOPE cohort data
First, changes in the geographical distribution of coverage over time in Ifanadiana were assessed for each indicator. For this, average values for the 80 geographical clusters in the IHOPE cohort were estimated, each of which included 20 households and approximately 100 individuals. Then, given the spatial location of each cluster, a raster surface of the whole district was obtained to improve visualisation of results. This was done through inverse distance weighted interpolation on the empirical Bayes estimates of each cluster, using R-packages spdep and gstat.
Second, trends in economic and geographical inequalities in the idHSS catchment were assessed for each coverage indicator. To estimate economic inequalities, a household wealth index was calculated through a principal components analysis of household assets following standard DHS methods.40 To estimate geographical inequalities, the Open Source Routing Machine (OSRM) engine was used to accurately estimate the shortest path distance between the villages in each cluster and the nearest health centre. For this, we had previously mapped the entire district of Ifanadiana on OpenStreetMap, resulting in over 23 000 km of footpaths and 5000 residential areas mapped (see46 for details). For each indicator, we estimated wealth-specific and geographic-specific averages (bottom two quantiles vs top three quantiles) as well as composite indicators of inequality, such as relative concentration index and slope index of inequality.47 The relative concentration index (RCI) is a measure of relative inequality based on the concentration curve, a plot of the cumulative distribution of each coverage indicator (y-axis) in the population ranked by wealth or geography (x-axis) and adjusted by survey weights.47 The RCI is defined as twice the area between the line of equality (45° diagonal line) and the indicator’s concentration curve, and was calculated using R-package decomp.48 The slope index of inequality (SII) is a measure of absolute inequality that represents the difference in coverage between the highest and the lowest values of the wealth or geography rank (normalised between 0 and 1). It was estimated at the individual level as the slope of the health outcome on the individual wealth or geography ranks in a logistic regression, adjusted by survey weights.47 49
Third, trends in self-reported barriers to seek care were estimated in the idHSS and control catchments. For this, individuals of all ages who reported being ill but not seeking care at a healthcare facility in the IHOPE cohort surveys were asked to provide the primary and secondary reason for why they did not seek care. This information was added to the surveys from 2016 onwards, but was not available for 2014. Reasons were classified as no barrier (‘not severe enough’ or no reason reported), knowledge barrier (‘did not think they could help me’ and ‘did not know that a treatment existed’), health system barrier (‘lack of confidence in health staff’ and ‘health staff often absent’), financial barrier (‘impossible to stop work’ and ‘too expensive’) and geographical barrier (‘too far away or hard to reach’). Percentages of each barrier reported were estimated out of all primary and secondary reasons.
Analysis of healthcare utilisation from health centre data
For each health centre, we calculated the annual average in per capita utilisation rates for maternal health services (antenatal care, first and fourth visit; deliveries, and postnatal care) and outpatient care for any illness (all patients and children under 5 years of age). We estimated annual changes during the 2013 to 2018 period for health centres in the idHSS and control catchments using mixed logistic regression models equivalent to the analyses of survey data described above (with a random intercept for each health centre).
Development of a web interface for operational use of cohort results
In order to build explicit information feedback loops between the impact evaluation and programme implementation, we developed a user-friendly online application to facilitate use of the IHOPE cohort results by local health staff. It consists of a website interface that builds on the same data sources (ie, IHOPE cohort database) and methods for the estimation of changes in coverage and inequalities as presented in this manuscript, making the visualisation of results flexible and easily accessible by programme managers and decision-makers (in French and English). We used the package Shiny50 for R statistical software. This application is developed and maintained by the PIVOT research team, and hosted at the PIVOT dashboard website (http://research.pivot-dashboard.org/).
Results
Changes in coverage indicators and mortality rates
After 4 years of intervention, under-five mortality decreased in the original idHSS catchment from 104 (95% CI 73 to 135) to 89 deaths (95% CI 57 to 120) per 1000 live births, an average annual relative reduction of 4% (table 3). Infant mortality decreased from 66 (95% CI 40 to 92) to 59 deaths (95% CI 38 to 81) per 1000 live births, an average annual relative reduction of 3%. Neonatal mortality decreased from 47 (95% CI 27 to 68) to 33 deaths (95% CI 16 to 51) per 1000 live births, an average annual relative reduction of 7%. In comparison, infant and neonatal mortality rates increased in the rest of the district, and under-five mortality decreased by an average of only 3%. All three mortality indicators in both areas were higher in 2018 than in 2016, but the gap in mortality rates between the original idHSS and control catchments consistently increased during this period. Differences in mortality rates over time between the two areas were not statistically significant. Complementary to results on 5-year population average mortality rates described above, analyses of incidence rates of death in the 2514 children under 5 years of age followed up between 2014 and 2018 revealed that the incidence rate was 2% per person-year in the idHSS catchment (47 deaths) and 3% per person-year in the control catchment (123 deaths). This represented an incidence rate ratio of 0.6 (95% CI 0.4 to 1.0), with a borderline statistically significantly lower incidence of deaths of children under 5 years of age in the idHSS catchment (p=0.05).
Changes in population-level child mortality rates* in the initial idHSS and control catchments, 2014 to 2018
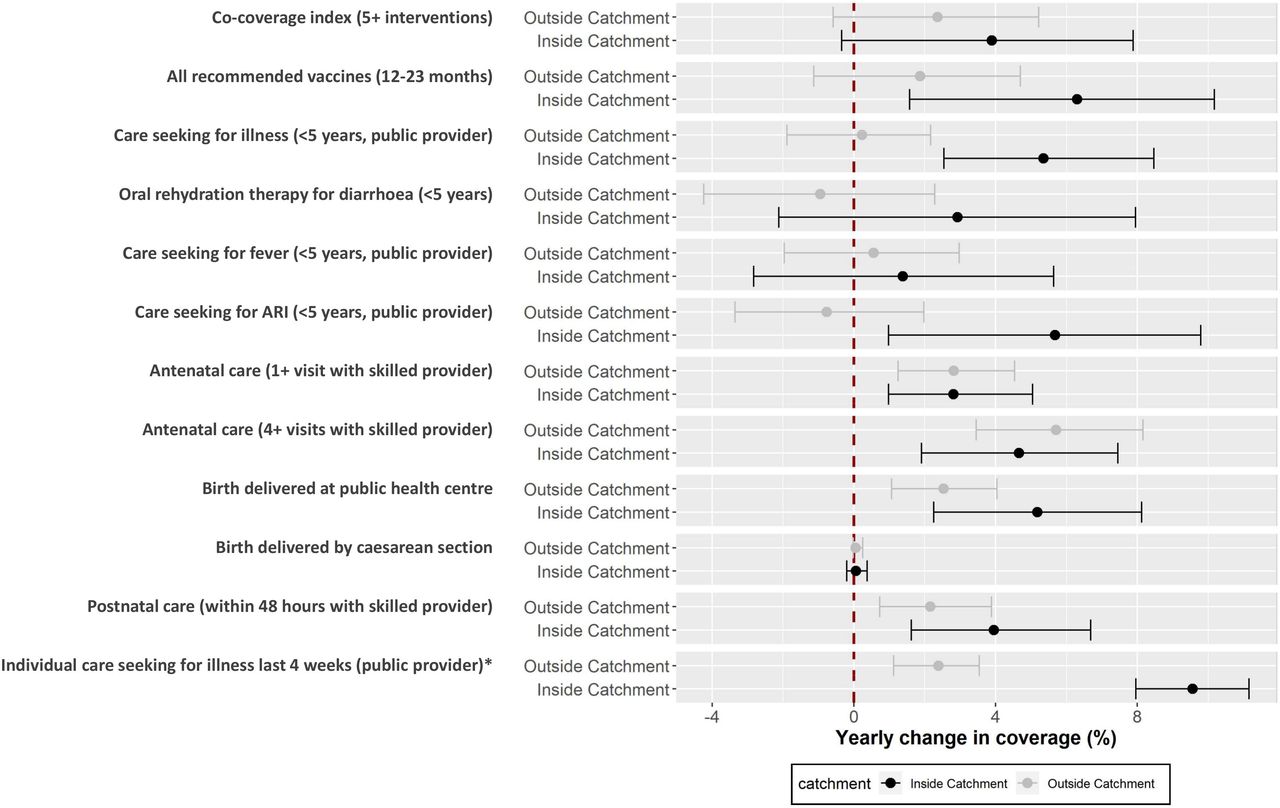
Reductions in mortality rates were accompanied with improvements in coverage indicators during this period for maternal, child and individual care (figure 1, table 2). The co-coverage index (5+ interventions), a summary index of maternal and child interventions increased by 4% annually in the idHSS catchment, nearly double than in the control catchment (figure 1). Differences between the two areas were particularly large for child coverage indicators, with annual increases in the idHSS catchment 4 to 6 percentage points higher than in the control catchment (vaccine coverage, care seeking for illnesses, ORS (oral rehydration salts) for diarrhoea, care seeking for acute respiratory infection (ARI)), except for care seeking for fever. Improvements in maternal coverage indicators were similar in the two areas for antenatal care (1+ and 4+ visits, annual increase of 3% and 6%, respectively). However, in the idHSS catchment, the proportion of deliveries at health facilities and postnatal care within 48 hours with a skilled provider improved by 3 and 2 percentage points more than in the control catchment, respectively. Care seeking for illness in individuals of all ages increased by nearly 10% per year in the idHSS catchment, compared with only 2% in the control catchment. Despite these positive results, the uncertainty around most of these estimates was high (figure 1). After accounting for baseline differences between the two areas and the average change in the district during this period (table 2), we found that the intervention was only associated with a statistically significant yearly improvement for care seeking for child illness (OR=1.2; 95% CI 1.0 to 1.4), care seeking for child ARI (OR=1.3; 95% CI 1.0 to 1.7) and care seeking for illness in individuals of all ages (OR=1.4; 95% CI 1.2 to 1.6). Model results for the full set of 45 coverage indicators is available in online supplemental table S3, and comparisons between the initial idHSS and control catchments are available in online supplemental table S4.

Annual change in key coverage indicators in Ifanadiana district, 2014 to 2018. Dots represent predictions based on fixed effects of the models described in table 2. Whiskers represent 95% CIs based on 400 bootstrap simulations of the same model. *Estimations for individual care seeking were obtained using 2016 to 2018 data only. ARI,acute respiratory infection,
Changes in health centre utilisation
The evolution of health centre utilisation rates in these two areas (table 4) was consistent with population-coverage results. We observed an increase in utilisation for all primary care services evaluated over the study period. However, the yearly improvement in per capita utilisation associated with the idHSS intervention was larger for outpatient consultations of individuals of all ages (OR=1.31; 95% CI 1.30 to 1.31) and consultations of children under 5 years of age (OR=1.25; 95% CI 1.23 to 1.26) than for any maternal care indicator evaluated.
Model predictions of annual change in health centre utilisation associated with the idHSS intervention and in the rest of Ifanadiana district (control), 2013 to 2018
Changes in geographical and economic inequalities in MNCH coverage
The spatial distribution of coverage in Ifanadiana district improved over time, especially in the idHSS catchment, but significant spatial heterogeneities remained both in the idHSS and control catchments. For instance, healthcare seeking behaviours for childhood illnesses (figure 2) was below 50% everywhere in the idHSS catchment in 2014. Rates increased to 60% to 85% across the idHSS catchment in 2016 and 2018, except for a remote area in one of the intervention communes (centre-right of the map), where populations have to travel over 4 hours by foot each way to reach the nearest health facility.46 In the majority of the control catchment area, healthcare seeking behaviours for childhood illnesses remained consistently below 50% during the study period (figure 2).

Geographical distribution of healthcare seeking behaviours for child illness, 2014 to 2018. It displays for each wave of the cohort the mean proportion of children under 5 years of age who were brought to a public provider (health centre or community health worker) when reported illness in the previous 2 weeks. Administrative limits of the HSS intervention catchment each year are shown in red. Equivalent maps for each indicator evaluated in this study are available through the accompanying Shiny App. HSS, health system strengthening.
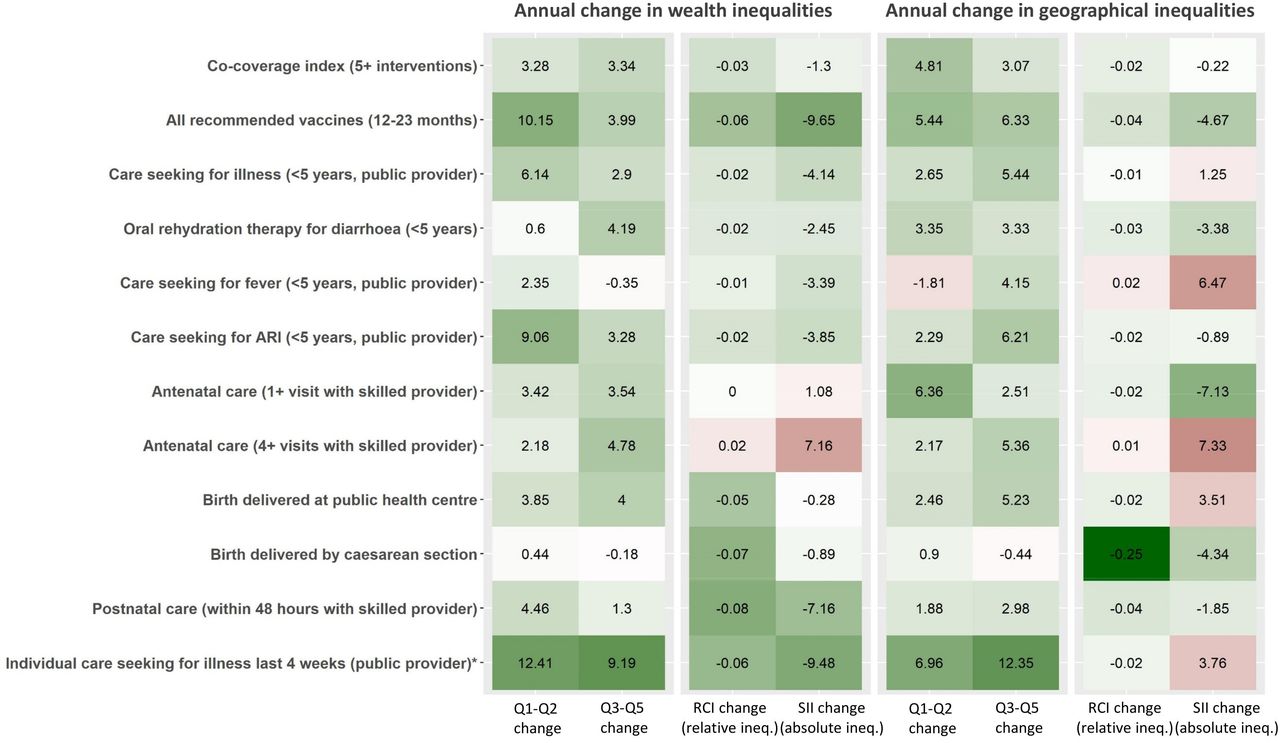
Annual change in inequalities for key coverage indicators in HSS intervention catchment, 2014 to 2018. Q1-Q2 and Q3-Q5 represent the change in the two worst-off and three best-off quantiles respectively. RCI and SII represent the change in relative concentration index (measure of relative inequality) and in slope index of inequality (measure of absolute inequality). Colour scale is based on scaled values for each variable, with red representing a worsening over time (reduction in quantile coverage, increase in inequalities) and green representing an improvement. Details are available in online supplemental tables S5 and S6). *Estimations for individual care seeking were obtained using 2016 to 2018 data only. ARI, acute respiratory infection; HSS, health system strengthening; ineq., inequalities; RCI, relative concentration index; SII, slope index of inequality.
The idHSS intervention implemented by the MoPH-PIVOT partnership was associated with reductions in economic and geographical inequalities for most indicators assessed (figure 3, online supplemental tables S5 and S6). Annual increase in coverage in the poorest two quantiles ranged from 0.6 to 12.4 percentage points. Both absolute and relative economic inequalities were reduced for all indicators except for antenatal care (1+ and 4+ visits). The largest reductions in absolute economic inequality were observed for child vaccination and care seeking for individuals of all ages (SII change of nearly −10 per year). Results for geographical inequalities were mixed. We observed a generalised improvement in coverage for populations living further from a health centre and an associated reduction in relative geographical inequalities. However, absolute improvements in coverage were larger in populations living close to a health centre for nearly half of the indicators assessed, leading to an increase in absolute geographical inequalities (SII), with annual changes ranging from −7.1 to +7.3. The indicators with the largest reductions in absolute geographical inequalities were child vaccination coverage, antenatal care (1+ visits) and birth delivered by C-section (SII change larger than +4 per year).
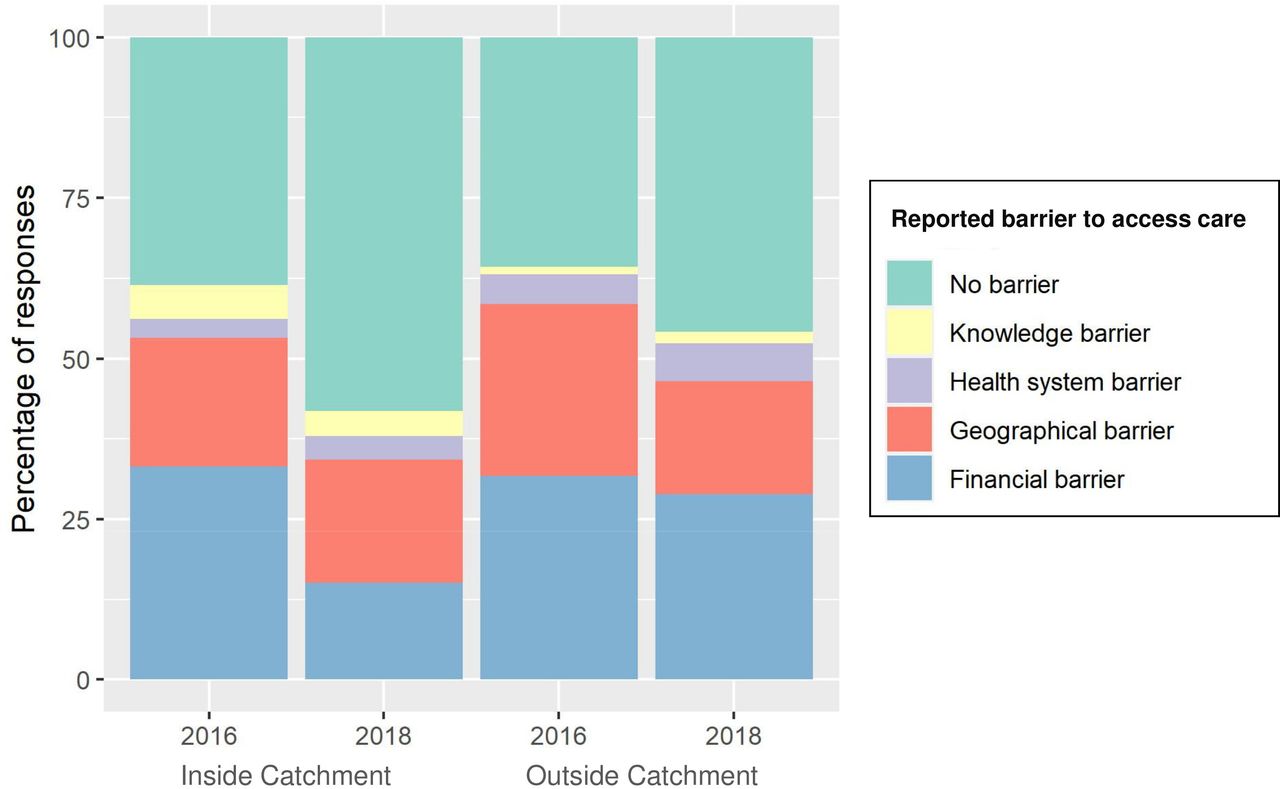
Analyses of inequalities were consistent with self-reported barriers to access health facilities by individuals who did not seek care following an illness (available only for 2016 to 2018). Reported financial barriers in the idHSS catchment more than halved (from 33% to 15%), while geographical barriers remained constant at 20% of responses (figure 4). Overall, reported barriers for not accessing care decreased by more than one-third in the idHSS catchment. In contrast, reported barriers only decreased by less than 15% in the control catchment, and the percentage of responses involving financial barriers barely changed during this period, remaining at about one-third of responses.

Reported reasons for not seeking care at a health facility, 2016 to 2018. It displays the percentage of responses out of all primary and secondary reasons that household members provided when they reported being ill in the previous 4 weeks but not seeking treatment at a health facility.
Information loops between impact evaluation and implementation: the IHOPE dashboard
Cohort results have been integral to the tailoring of the ongoing idHSS intervention, highlighting gaps in coverage or quality of care, insufficient progress in particular health programmes and potential solutions to address them. Though evaluation results are presented to managers and leadership of the MoPH-PIVOT partnership as they become available, there were inherent challenges in the routine use of this information. A user-friendly web interface is now accessible to programme managers in Ifanadiana district (figure 5), allowing visualisation of key information for over 40 coverage indicators from the IHOPE cohort for the planning and implementation of health interventions. These population-level results, available at granular temporal and spatial scales across Ifanadiana district, provide a breadth of information for iterative learning, complementary to more traditional dashboards of routine health system data. The IHOPE dashboard includes trends in coverage over time in Ifanadiana district, comparisons by intervention catchment and by commune; changes in economic and geographical inequalities; and spatial distribution of coverage over time. Information is updated every 2 years, and the number of indicators included will be progressively expanded to encompass most aspects of the idHSS intervention.

Web interface for operational use of cohort results by local health managers. Illustrative example of the interface available at http://research.pivot-dashboard.org/. It shows an analysis of child mortality indicators (under 5 years of age, infant and neonatal mortality) over time, in the idHSS catchment (solid line) and in the control catchment (dashed line). Top panels show trends in mortality between 2014 and 2018, while middle and bottom panels show absolute and relative change during the same period, respectively. HSS, health system strengthening; idHSS, integrated district-level health system strengthening; IHOPE, Ifanadiana Health Outcomes and Prosperity longitudinal Evaluation.
Discussion
In the coming decades, low- and middle-income countries will need to allocate substantial investments to HSS and UHC in order to achieve the health-related SDGs.4 Yet, there is still a substantial gap in the evidence to inform this shift due to challenges in the assessment of such complex interventions, with cross-benefits at the population level.5 28 We analysed changes in healthcare utilisation, coverage and mortality in a district-representative longitudinal cohort to assess the impact of the first 4 years of an ongoing idHSS initiative in a rural district of Madagascar. Our results reveal improvements in care seeking and economic inequalities, both central goals of UHC policies. Coverage increased by more than 4% per year for all recommended vaccines, for care seeking in children and adults and for facility birth deliveries, even in the poorest economic groups. Despite improvements in all coverage and mortality indicators in the idHSS catchment, only care seeking for children and adults were statistically significantly associated with the idHSS intervention. Differences with the rest of the district for maternal care coverage and under-five mortality rates were modest and non-significant. The persistence of geographical inequalities in access to care observed in the idHSS catchment highlights potential solutions for optimising the impact of HSS interventions, such as substantial investments in outreach activities and community health. More broadly, our study highlights the value of iterative learning between HSS implementation and impact evaluation, based on the dynamic integration of data and analytics at multiple levels of a health district.
Ensuring universal access to essential maternal and child health services via UHC packages and HSS is a strategic priority of the United Nations’ Every Woman Every Child Global Strategy.8 We show that in 4 years of intervention, coverage in the idHSS catchment improved faster than what has been observed globally, catching up with the global median coverage for most indicators of child care coverage (eg, ORS for diarrhoea, care seeking for acute respiratory infections, immunisations and so on).51 The idHSS intervention had the largest effects on care seeking for illness, not only for children but also for individuals of all ages, with annual relative improvements of 30% to 40%. This has led to an annual increase in health centre utilisation associated with the idHSS intervention of 25% in children and 31% in individuals of all ages, tripling utilisation rates in the control catchment by 2018. Yet, there remained substantial gaps for most maternal care indicators as compared with global trends. For instance, despite an annual increase of over 4 percentage points in recommended antenatal care visits (4+), coverage in 2018 was 20 percentage points lower than the 73% median global coverage.51 In addition, we observed significant district-level improvements over time in prenatal, delivery and postnatal care, but the idHSS intervention was not associated with an additional increase. Similarly, annual changes in maternal care visits at health centres in the idHSS intervention were consistently lower than improvements observed for outpatient visits. Implementation of a World Bank voucher programme targeting pregnant women in the whole district and a limited focus on maternal health activities in the idHSS catchment could partly explain these trends. As the World Bank programme ends and components of the idHSS intervention are expanded to the whole district in 2020 for the UHC pilot, changes in intervention coverage will be closely tracked through the IHOPE study to inform local implementation and national policies.
We observed increases in intervention coverage for the most vulnerable population groups and associated reductions in inequalities. Coverage of maternal and child services in the poorest two quantiles increased by 2 to 10 percentage points per year, substantially higher than the 0.5% to 1.5% median increase observed for low-income countries.52 This gap remains when comparing summary indices such as the CCI in worst-off groups, as the annual improvement in the idHSS catchment (2.9%; online supplemental table S5) was nearly three times higher than the average for low-income countries.53 Our local results provide a more positive picture than equivalent national analyses in countries undergoing UHC and other health reforms, which showed mixed results in addressing wealth inequalities.11–13 While Ghana observed progressive convergence between groups,12 inequalities persisted in Kenya and Rwanda.11 13 Among all the indicators assessed in our setting, antenatal care (4+ visits) was the only one for which both economic and geographical inequalities increased. This is consistent with a recent analysis of 84 national surveys, showing that wealth inequalities for recommended antenatal care visits (4+) still persist across geographical regions.10
Our study highlights the added value of integrating analyses of geographical inequalities into evaluations of UHC policies and HSS programmes to better assess their impact on remote populations. Although equity analyses are becoming commonplace, these have focussed so far on assessing inequalities in wealth, education and place of residence (rural vs urban).10–13 52 53 Impact evaluations rarely assess changes in geographical inequalities, even though it is well established that primary healthcare utilisation decreases exponentially for populations living at increasing distance of health facilities.54–58 In our setting, inequalities in geographical coverage were harder to address than economic inequalities, with half of indicators showing an increasing gap in absolute inequalities as a function of distance to a health facility. This is consistent with previous evidence suggesting that geographical barriers to primary healthcare can persist even in settings where user fees have been removed, making UHC policies insufficient to reach full population coverage of primary care services unless explicitly targeting remote populations.18–20 This type of analysis could be key in evaluating progress towards geographical equity as professionalised community health programmes and proactive community case management become part of broader HSS efforts.59 60
Despite improvements in health coverage and reductions in inequalities, child mortality trends observed in the idHSS catchment were lower than initially estimated in our 2-year evaluation.31 We observed annual reductions of under-five mortality rates comparable to national averages in the top 40% of countries tracked by the Countdown to 2015 initiative in 1990 to 2015.61 Decreases in neonatal mortality were larger, as the change in the idHSS catchment during this 4-year period (from 47 to 33 deaths per 1000 live births) was almost equivalent to the decrease observed in sub-Saharan Africa in nearly three decades (from 46 to 27 deaths per 1000 live births between 1990 and 2017).62 The gap between the idHSS catchment and the rest of the district increased for infant and neonatal mortality, as these rates increased from 2014 to 2018 in the control catchment. However, even the idHSS catchment experienced small increases in mortality rates from 2016 to 2018. It is possible that after an initial sudden impact in both coverage and mortality due to user-fee removals and other early programmes, further reductions in mortality rates may not be accomplished unless geographical coverage is improved. A pilot community health programme implementing proactive care is underway in one district’s commune and will be scaled to the rest of the idHSS catchment if shown effective. This, among other programmes addressing persistent geographical barriers in Ifanadiana, could contribute to accelerating reductions in child mortality.
The modest impacts that we observed on maternal care and child mortality indicators could be due to a range of factors related to intrinsic effectiveness of the interventions, fidelity of implementation or persistent barriers for accessing care. A key component of this study was to build feedback mechanisms between research and implementation so that results are available to programme managers for operational use. This will ensure that any issues identified during the impact evaluation can be addressed in a timely manner. Typically, experimental trials provide insights on whether a pilot intervention works using randomised controlled designs, whereas implementation research explores how, when and why the intervention works, making use of a variety of study designs, from quantitative to qualitative research.63 64 Here, we use an intermediate approach by combining a quasi-experimental design with a comprehensive set of population-level analyses at very granular spatial and temporal resolutions. Insights generated through the IHOPE cohort have influenced the design and implementation of the idHSS intervention over time. For instance, while the idHSS intervention was initially focussed on facility-based care, results on geographical access to care led a substantial shift towards strengthening community health programmes, which is currently evolving towards proactive care delivery given persistent geographical inequalities. Similarly, lags in maternal care improvements in the idHSS catchment have pushed new efforts by the MoPH-PIVOT partnership ever since, including implementation of emergency neonatal and obstetric care trainings, distribution of equipment, incentives for pregnant women to deliver at facilities (eg, social kits and waiting homes) and outreach activities for the provision of antenatal care at the community level. Visualisation of impact evaluation results into e-health tools could help further decentralise and accelerate this process, allowing programme managers to prioritise and plan activities over time to optimise coverage of key indicators. This approach is increasingly used in global health, with prior applications for malaria surveillance and health equity.14 65 66
Although frequent waves of population-level data collection allow for better granularity and important programmatic insights, the short time interval since the beginning of the idHSS intervention in combination with limitations of our quasi-experimental study design could also have prevented us from detecting significant impacts at this point. First, estimations of population-level child mortality were based on 5-year estimates to attain adequate sample sizes, leading to overlap in the mortality results, which were reported at 2-year intervals. Despite this, CIs were still wide, which may explain the inconsistent trends observed in the 4-year period. Allowing for longer evaluation periods will lead to progressively better estimates of intervention impact on mortality rates, with long-term trends less sensitive to variability in particular years. Second, we used two slightly different idHSS catchment populations in our analyses, to accommodate limitations in the methodology. While analyses of coverage and utilisation indicators allowed for changes in the idHSS catchment over time to include an additional commune in 2017, this was not possible for estimating inequalities or child mortality; these used the initial idHSS versus control catchment comparison for the whole study period. Third, the effects of HSS programmes could be non-linear (online supplemental figure S2), but given the short time frame of the study we only studied annualised linear effects. Finally, the process of implementing the idHSS intervention is not discrete and immediate, it is gradually being implemented and involves many simultaneous programmes at different levels of the health system. As a result, while we can infer an overall intervention impact, it is not possible to accurately estimate the effect of particular components of the intervention, some of which could have effects district-wide.
In conclusion, we show how the combination of a district-representative longitudinal cohort and health system data can help assess complex HSS interventions. The results demonstrate improvements in care seeking behaviours and economic inequalities linked to the early stages of an idHSS intervention in a rural district of Madagascar. Additional improvements in intervention coverage and child mortality in this context of persistent geographical inequalities will likely require a stronger focus on community health and last mile interventions. As the district moves on to pilot the national UHC strategy, use of this granular evaluation results via accessible, interactive e-health tools can be key for informing national implementation of UHC policies throughout the scale-up process.
Acknowledgments
The authors acknowledge the contributions and support of Jim Herrnstein, Robin Herrnstein and Benjamin Andriamihaja. They are grateful to all of the staff at PIVOT for their field support and their remarkable work in strengthening the health system in Ifanadiana. Thanks are due to the Madagascar Ministry of Health, at both the district and the central levels, for their continuous support and valuable insights. The authors also thank the Institut National de la Statistique (INSTAT) field teams for their involvement in the district-wide population survey.
References
Supplementary materials
Supplementary Data
This web only file has been produced by the BMJ Publishing Group from an electronic file supplied by the author(s) and has not been edited for content.
Footnotes
Handling editor Seye Abimbola
Contributors Conceived and designed the experiments: AG, ACM, MB. Performed the analysis: AG, ACM, MauR. Contributed reagents/materials/data/analysis tools: AG, ACM, MarR, H-TRR, BR. Wrote the initial draft of the manuscript: AG, ACM, KEF, MB. Revised the manuscript and accepted it in its final form: AG, ACM, LC, MarR, H-TRR, MauR, BR, KEF, JH, LuR, GR, LaR, SA, MBM, MLR, TL, GDS, MB.
Funding This study was funded by the Herrnstein Family Foundation.
Map disclaimer The depiction of boundaries on this map does not imply the expression of any opinion whatsoever on the part of BMJ (or any member of its group) concerning the legal status of any country, territory, jurisdiction or area or of its authorities. This map is provided without any warranty of any kind, either express or implied.
Competing interests Some authors are current or former employees of institutions discussed in this article, including the non-governmental organisation PIVOT and the Government of Madagascar. These affiliations are explicitly listed in the article.
Patient consent for publication Not required.
Provenance and peer review Not commissioned; externally peer reviewed.
Data availability statement Data are available upon request to the address research@pivotworks.org.
Supplemental material This content has been supplied by the author(s). It has not been vetted by BMJ Publishing Group Limited (BMJ) and may not have been peer-reviewed. Any opinions or recommendations discussed are solely those of the author(s) and are not endorsed by BMJ. BMJ disclaims all liability and responsibility arising from any reliance placed on the content. Where the content includes any translated material, BMJ does not warrant the accuracy and reliability of the translations (including but not limited to local regulations, clinical guidelines, terminology, drug names and drug dosages), and is not responsible for any error and/or omissions arising from translation and adaptation or otherwise.