Article Text

Abstract
Introduction Despite increasing utilisation of institutional healthcare in India, many healthcare facilities (HCFs) lack access to basic water, sanitation and hygiene (WASH) services. WASH services protect patients by improving infection prevention and control (IPC), which in turn can reduce the burden of healthcare-associated infections (HAIs). However, data on the cost of implementing WASH interventions in Indian HCFs are limited.
Methods We surveyed 32 HCFs across India, varying in size, type and setting to obtain the direct costs of providing improved water supply, sanitation and IPC-supporting infrastructure. We calculated the average costs of WASH interventions and the number of HCFs nationwide requiring investments in WASH to estimate the financial cost of improving WASH across India’s public healthcare system over 1 year.
Results Improving WASH across India’s public healthcare sector and sustaining services among upgraded facilities for 1 year would cost US$354 million in capital costs and US$289 million in recurrent costs from the provider perspective. The most costly interventions were those on water (US$238 million), linen reprocessing (US$112 million) and sanitation (US$104 million), while the least costly were interventions on hand hygiene (US$52 million), medical device reprocessing (US$56 million) and environmental surface cleaning (US$80 million). Overall, investments in rural HCFs would account for 64.4% of total costs, of which 52.3% would go towards primary health centres.
Conclusion Improving IPC in Indian public HCFs can aid in the prevention of HAIs to reduce the spread of antimicrobial resistance. Although WASH is a necessary component of IPC, coverage remains low in HCFs in India. Using ex-post costs, our results estimate the investment levels needed to improve WASH across the Indian public healthcare system and provide a basis for policymakers to support IPC-related National Action Plan activities for antimicrobial resistance through investments in WASH.
- health economics
- health policy
- health systems
- public health
- other infection
- disease
- disorder
- or injury
This is an open access article distributed in accordance with the Creative Commons Attribution Non Commercial (CC BY-NC 4.0) license, which permits others to distribute, remix, adapt, build upon this work non-commercially, and license their derivative works on different terms, provided the original work is properly cited, appropriate credit is given, any changes made indicated, and the use is non-commercial. See: http://creativecommons.org/licenses/by-nc/4.0/.
Statistics from Altmetric.com
Key questions
What is already known?
The burden of healthcare-associated infections (HAIs) worldwide is substantial but poses the greatest risk to patients in low/middle-income countries (LMICs), where common lapses in infection prevention and control (IPC), such as poor hand hygiene, can lead to the spread of HAI-causing pathogens.
Although adequate provision of water, sanitation and hygiene (WASH) is crucial to the appropriate practice of IPC, gaps in WASH infrastructure remain a significant problem in healthcare facilities (HCFs) of LMICs, and knowledge of the cost to implement WASH interventions in LMIC HCFs is lacking.
What are the new findings?
Improving WASH coverage across the Indian public healthcare system over a 1-year period would require an estimated US$354 million in capital costs and US$289 million in recurrent costs.
The most costly intervention would be on water service (US$238 million), followed by linen reprocessing (US$112 million), sanitation (US$104 million), surface cleaning (US$80 million), medical device reprocessing (US$56 million) and hand hygiene (US$52 million).
Investments in primary health centres would account for the majority (US$336 million) of total costs, followed by district hospitals and medical colleges (US$178 million), and community health centres (US$129 million).
What do the new findings imply?
The need for greater WASH investments in primary care facilities serving rural populations in India is an opportunity to address inequities in public healthcare financing through improvements in WASH.
However, the immediate and long-term costs of these interventions would be substantial and would require a coordinated effort from all national and subnational levels of government willing to provide long-term political and financial commitments.
Findings from this study can aid health policy planners allocate resources for future financing of WASH programs in HCFs and make informed decisions that improve the efficiency of healthcare delivery.
Introduction
Though essential to patient safety and universal health coverage, access to water, sanitation and hygiene (WASH) in healthcare facilities (HCFs) is poor in developing countries, especially in rural, public and primary healthcare.1 WASH infrastructure provides the enabling environment for healthcare workers to practice infection prevention and control (IPC), particularly basic practices, which require access to water, such as hand washing, medical device reprocessing and environmental surface cleaning. Inadequate WASH services and subsequent gaps in IPC increase patient risk for healthcare-associated infections (HAIs) and contribute to the growing problem of antimicrobial resistance (AMR).1–5 Higher rates of HAIs can lead to more frequent use of antibiotics and an overdependence on antibiotic prophylaxis, thereby accelerating AMR.6 Failures in WASH and IPC can also reduce institutional care-seeking, lower patient confidence in the healthcare system, and adversely impact individual and public health outcomes.7 8 With healthcare utilisation on the rise in low/middle-income countries (LMICs), improving WASH services in HCFs is critical to reducing the burden of HAIs and ensuring patient safety.9 10
In India, more than one in four HCFs lack basic water service (ie, a water source within 500 m of the facility).11 Sanitation coverage is especially low with only 55% of facilities having access to improved sanitation compared with the global average of 79% across LMICs.12 Even in facilities where WASH infrastructure is available, the accessibility, quality and functionality of services are often inadequate and/or inappropriate (eg, lack of potable water or safe water storage).13 Large discrepancies in WASH exist throughout the country with poorer WASH provision generally observed in rural as opposed to urban areas.14–16 The need for water infrastructure and WASH-related IPC resources also depends on the scope of services provided at different levels of the healthcare system.13 Compared with subcentres and primary health centres (PHCs), which deliver routine outpatient care to patients, secondary care and tertiary care facilities provide both inpatient and surgical care, which generally require more water-intensive IPC measures due to more invasive services offered.
The healthcare landscape in India has also changed in recent decades with the growth of the private sector in both outpatient and inpatient care.17 18 Although the increasing trend towards utilisation of the private sector is pronounced across all wealth quintiles, it is the poor that still rely most heavily on the public healthcare system and government-funded insurance schemes.17 18 However, public facilities are often overburdened, understaffed, and lacking in basic infrastructure and/or resources to deliver quality services; these bottlenecks in accessing quality healthcare force even the poorest populations to seek care in the private sector, which has some of the highest out-of-pocket expenditures in the world.18 19 Thus, investing in WASH provision in the public sector needs to remain a government priority in order to ensure access and availability of quality, public healthcare services for all populations, especially those most vulnerable. At present, the only national iniative for WASH in HCFs is the Kayakalp programme launched in 2015 as an extension of Swachh Bharat Abhiyan (SBA), the nationwide campaign for universal sanitation coverage.
The unit costs of improving WASH in HCFs are largely unknown in LMICs at a facility, system and country level. While numerous cost studies in India exist for different tiers of healthcare services, healthcare providers and diseases,20–26 little to no literature exists on the cost of improving WASH services in Indian HCFs. Rather, the majority of WASH-related cost studies in the Indian context are specific to the community setting,27–30 and/or address only a component of WASH improvement.28 31 32 Knowledge of the unit costs for various WASH interventions is important for budgeting and decision-making and can help policymakers in resource-limited settings strengthen health infrastructure for quality improvements in service and improve the efficiency of healthcare service delivery. Therefore, the purpose of this study was to estimate the financial cost of implementing WASH services across the Indian public healthcare system to inform allocation strategies of central and state governments responsible for the organisation and delivery of healthcare services.
Methods
Study setting and aim
The Indian public healthcare system is organised into three principal levels of care: (1) PHCs, which are often the first point of contact for many patients, (2) community health centres (CHCs), which act as referral units for five or six PHCs, and (3) subdistrict/district hospitals (DHs) and tertiary care facilities (eg, medical colleges (MCs)), which provide specialised care to patients typically referred from primary or secondary health centres.33 Though less regulated, the private sector is as equally extensive and commonly overburdened, with various forms of management from corporate networks and standalone hospitals to non-governmental/charitable HCFs.19
The aim of this study was to use ex-post, real-world costs to estimate the national financial cost (in 2018 prices) of implementing basic WASH interventions across the Indian public healthcare system for 1 year from the provider perspective. We emphasised interventions generally recognised as primary mediators in HAI incidence due to inadequate WASH. These include interventions on water—upgrading HCFs with below basic water service (eg, unimproved or limited service) to basic (ie, an improved water source on-site) and from basic water service to advanced (ie, an improved water source piped into the facility with additional collection points); interventions on sanitation—upgrading HCFs with below basic sanitation service to basic (ie, improved toilets present and separated for men/women and patients/staff); and interventions to improve access to hand hygiene infrastructure and the environmental decontamination of hospital surfaces, linens and medical equipment. Where applicable, we attempted to map interventions on water and sanitation to the WHO and UNICEF Joint Monitoring Programme (JMP) service ladder for WASH in HCFs (table 1),34 such that improvements to water and sanitation service levels would reflect 2030 Sustainable Development Goals (SDGs).35
WHO/UNICEF Joint Monitoring Programme service ladders for WASH in healthcare facilities
Study HCFs
A total of 32 HCFs were selected by convenience sampling, although not all sampled HCFs were able to provide cost data for all interventions as detailed in online supplemental table 1. For analysis of facility-level cost data, specialised and tertiary facilities in the public and private sector were grouped with PHCs, CHCs, DHs or MCs based on their facility size and number of beds, which ranged from specialised facilities with 20–290 beds to large multispecialty and tertiary facilities with 500–3800 beds. HCFs were geographically dispersed throughout 11 cities within the northern states/territories of Uttar Pradesh, Haryana, Chandigarh and Delhi, four cities within the central eastern state of Chhattisgarh, and one city within the southern state of Telangana. Among the surveyed government-run facilities, PHCs and CHCs were located in rural areas, while DHs and MCs were predominantly located in urban areas. Privately run specialty and tertiary hospitals served both urban and semiurban areas.
Supplemental material
Data collection
Using a survey questionnaire (appendix), we obtained ex-post cost data from March 2018 to September 2019 through interviews with hospital administrators and department officials (eg, stores, procurement, accounts, expenditure, hospital engineering and so on). We searched 2017–2018 expenditure reports and stock registers for cost information on consumables and other recurrent hospital supplies (eg, utility fees). For capital expenditures, including equipment and other non-consumables expected to last for more than 1 year, we searched expenditure reports and stock registers from previous years dating as far back as 1998. Data on outsourced services were obtained from contracts for the year 2018–2019. We also acquired information regarding facility size, hospital bed numbers and admission rates from hospital census records.
Costing method
Using the ingredients costing method,36 we estimated the direct unit costs and 95% CIs of each WASH improvement based on the average price of each service unit, as described in online supplemental table 2, and the quantity expected at each facility type. Unit cost refers to the total expenditure incurred by the healthcare service provider for one unit of a particular service related to a WASH intervention. For each unit of service, we calculated both capital and recurrent costs. The total annual cost of consumables was extrapolated from the monthly or weekly unit costs reported at the facility level. The 95% CIs for each service unit were calculated from the SD of the sample mean only among facilities reporting cost data.
Facility cost of improving water
For interventions to improve access and availability of water, we estimated the costs of upgrading HCFs with below basic water service to basic defined as an improved water source on-site (eg, an on-premise tube well, borehole, piped water system and/or vended water), and calculated costs at the facility level as opposed to estimating increases in per-unit changes in the water supply. Because surveyed facilities each reported using combinations of different improved water supply, treatment, storage and removal systems, the average costs could not be calculated for all individual inputs. Therefore, all cost inputs for basic water service were combined at the facility level and then averaged across facilities to obtain the mean cost across surveyed facilities. This included the capital costs of materials, equipment, labour and installation, and the recurrent costs of operating and maintaining water quality/safety and utility fees. We assumed sanitation waste was collected in the same water sewage system prior to wastewater removal.
Additionally, we calculated the average cost of further upgrading HCFs from basic water service level to advanced (ie, piped water distribution system) for all types of HCFs, as this would be necessary for implementation of water-intensive IPC interventions on hand hygiene and environmental decontamination. Service unit costs for installing a piped water distribution system were calculated at the facility level and included the combined capital costs of labour, equipment and materials, and the recurrent cost for maintenance staff, which were then averaged across facilities to obtain the mean costs of advanced water service.
Facility cost of improving sanitation
For interventions on sanitation, we evaluated the costs of upgrading HCFs with below basic sanitation service to basic (ie, improved toilets are separated for men/women and patients/staff), which we further define as a minimum of 4 toilets per outpatient department and 1 toilet per 20 inpatients according to WHO standards. Service unit costs were calculated for a single toilet and included the capital costs for equipment, labour and installation (eg, plumbing connection), as well as the recurrent costs for custodial services and repairs. To obtain facility-wide costs, we multiplied the unit cost per toilet by the quantity of toilets expected at each facility type to meet the minimum requirement for basic sanitation service.
Facility cost of improving hand hygiene
For interventions on hand hygiene, we assumed improved access to and availability of handwashing stations to meet WHO standards of 1 sink for every 10 inpatient beds, with an additional sink for every 4 toilets and 1 sink per outpatient department. We evaluated the cost per service unit of installing and maintaining a single handwashing station, including the capital costs of installation and equipment (eg, sinks and soap dispensers), and the recurrent costs of materials (eg, soap) and maintenance and repair staff. We then estimated the quantity of stations required to meet the minimum standard of 1 station per 10 patient beds and 1 additional station per department to calculate facility-wide costs.
Facility cost of improving environmental hygiene
For interventions on environmental decontamination, we evaluated the costs of interventions on three primary reservoirs: hospital surfaces, linens and medical devices. All costs associated with increasing access to and availability of detergents, low-level disinfectants, brooms, cloth and mops, as well as maintaining housekeeping staff to clean environmental surfaces periodically (ie, a minimum of at least once daily), were reported by hospitals as a combined monthly recurrent cost at the facility level. Similarly, recurrent costs associated with in-house linen reprocessing (eg, laundry staff, detergent and electrical fees) were reported as a monthly aggregate, while capital costs were calculated by summing the costs of machinery. For interventions on medical equipment reprocessing, recurrent costs included the combined monthly expense reported by HCFs for autoclave solution and high-level disinfectants for semicritical and critical devices. Capital costs included the median costs of an autoclave(s) or ethylene oxide steriliser(s). These costs were applied to all types of HCFs based on the essential medical equipment list provided by the Indian Public Health Standards for PHCs, CHCs and DHs.37
Facility cost estimates and adjustments
Where data were not available for a specific facility level, we scaled the cost of interventions using estimates of facility size and/or capacity, including the number of departments/wards, beds, toilets and hand hygiene stations (online supplemental table 3).37 To calculate the number of toilets required at each facility level for the provision of basic sanitation services, we estimated the number of inpatient beds (as a proxy for patients), the number of staff, as well as the number of outpatient departments in each facility type requiring designated toilets for women and staff. For the development of hand hygiene cost estimates, the number of handwashing stations was adjusted based on the approximate number of beds reported by each facility type and the number of department or wards at each facility. Because we could not find data on the average number of department and wards in MCs, we used the average number of toilets and handwashing stations reported by surveyed MCs to generate these statistics. Finally, recurrent costs obtained from 2017 to 2018 expenditure reports were adjusted for inflation using India’s Consumer Price Index to reflect 2018 prices (assuming an inflation rate of 4.86% in 2018).38 Capital costs, however, could not be adjusted to 2018 prices because we did not collect the years in which capital expenditures were incurred. Conversion from Indian rupees (INR) to US$ used the exchange rate for the base year 2018 (US$1=68.389 INR).39
National cost of improving WASH
The cost of improving WASH for the entire Indian public healthcare system was calculated by multiplying the average cost of each intervention by the proportion of facilities requiring intervention (online supplemental table 4), which was estimated using India-specific data from current literature and reports of WASH in HCFs.1 3 4 8 11–13 40–43 Because water-intensive IPC interventions require an advanced water service level, we included the cost of improving the water source in facilities with below basic service to basic and then to advanced when calculating national-level estimates. We then multiplied these values by the number of facilities reported nationally for each urban and rural facility type (online supplemental table 3) based on the most recently available data obtained from the Open Government Data Platform India and the Ministry of Health and Family Welfare (MoHFW).44 45 Although only an aggregate value of the total number of urban health centres was available, we applied the ratio of PHCs to CHCs in rural areas to urban centres and estimated the number of urban PHCs and CHCs to be 3547 and 778, respectively. We also assumed that all 1894 DHs (including subdistrict hospitals) were located in a metropolitan (urban) centre of the district headquarters. Twenty-nine government MCs located in predominantly rural states (eg, Assam, Bihar, Himachal Pradesh and Orissa) were assumed to serve rural populations, while the remaining 206 government MCs were assumed to be in urban settings.46–48
Sensitivity analysis
The main source of uncertainty in calculating national costs for improving WASH interventions across the Indian public healthcare system is in the lack of reliable estimates for the proportion of public HCFs in India requiring each WASH intervention type. Therefore, to test the sensitivity of our results, we conducted additional analyses varying the proportion of public HCFs requiring intervention based on the upper and lower uncertainty ranges as listed in online supplemental table 4.
Patient and public involvement
There were no funds or time allocated for patient and public involvement. Thus, we were unable to involve patients or the public in our research.
Results
Water service intervention costs by facility type
Based on ex-post costs obtained from surveyed facilities, the estimated financial costs of improving facility-wide water services from unimproved or limited to basic and advanced are presented in table 2. Overall, DHs and MCs had the highest unit costs for implementation of an improved water source constructed on premise. Though DHs and MCs required far greater capital investments in water infrastructure (US$71 183 per DH; US$138 328 per MC) than PHCs and CHCs (US$5816 per PHC; US$8803 per CHC), the costs of annual recurrent expenses relative to capital investments were greater for PHCs and CHCs. Assuming all facilities have basic water service, the additional cost of upgrading PHCs, CHCs, DHs and MCs with basic water service to advanced required a capital investment of US$2742, US$3491, US$35 491 and US$23 123, respectively, and an annual expense of US$434, US$981, US$11 244 and US$5520, respectively.
Costs of improving water services from unimproved or limited to basic or advanced
Service unit and facility-level costs of sanitation and water-intensive IPC interventions by facility type and/or setting
The service unit costs of interventions on sanitation and water-intensive IPC interventions, used to estimate facility-wide costs, are shown in table 3. Notably, we observed wide CIs for the cost of each service unit. The capital cost of a single flush toilet ranged from US$303 in rural facilities to US$626 in urban facilities, while the capital cost of a single sink with soap ranged from an average of US$393 in rural facilities to US$432 in urban. In general, facility-level costs were greatest for MCs and DHs, followed by CHCs and then PHCs. Costs for linen reprocessing were greater than costs for medical device reprocessing across all facility levels, and both interventions required greater investment in recurrent costs relative to capital costs. The highest annual recurrent cost, however, was associated with enhanced surface cleaning in MCs, which required an average annual expense of US$93 130 per MC.
Service unit costs of interventions on sanitation and hospital hygiene
National costs of WASH interventions across India’s public health sector
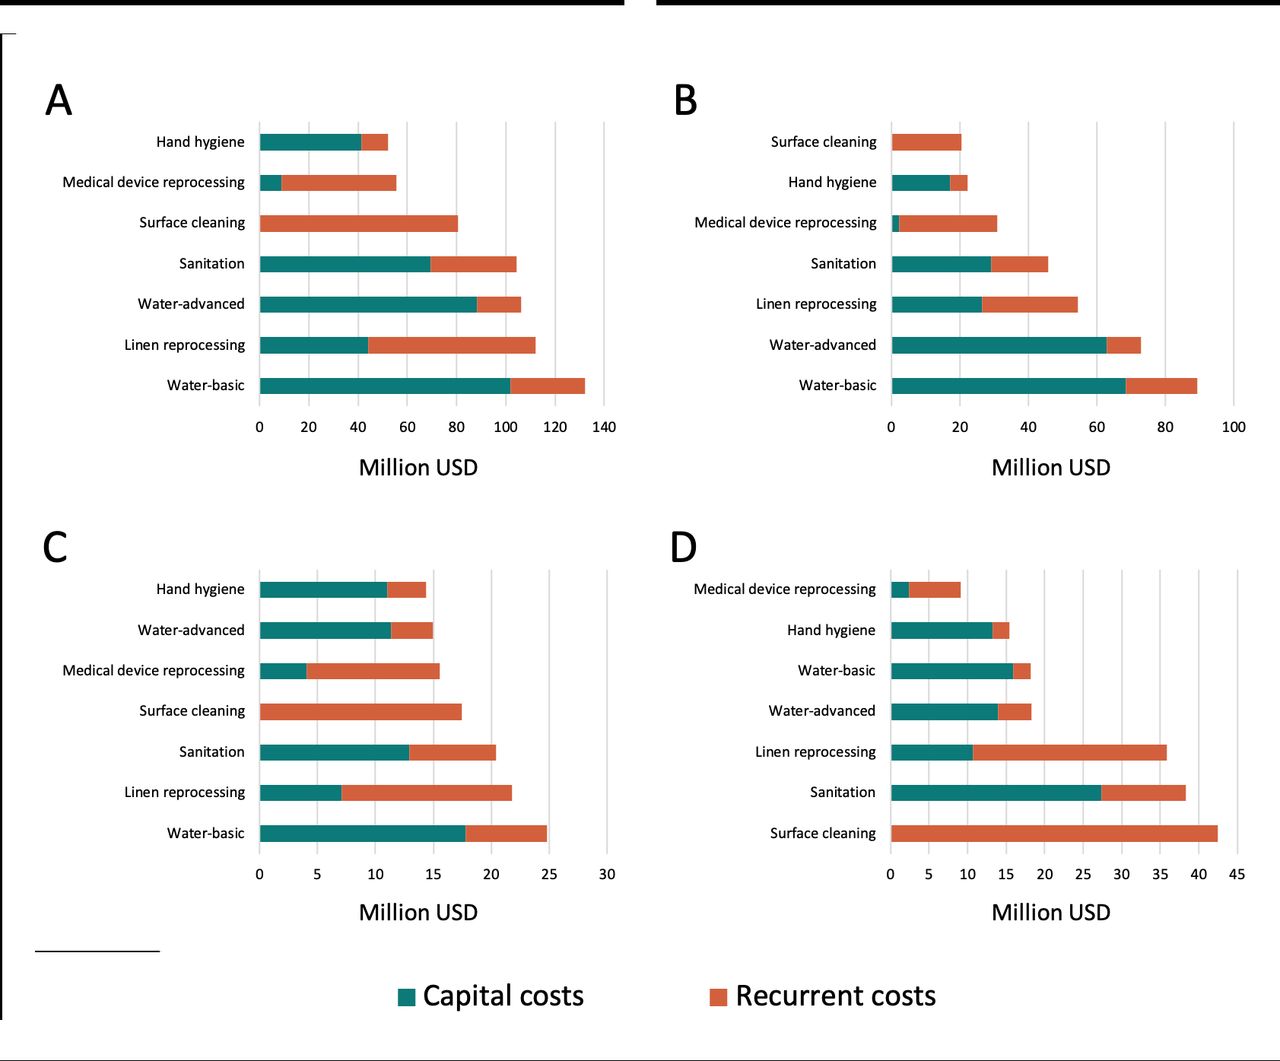
Extrapolating service unit and facility-level costs across urban and rural settings, we estimated the national cost of improving all WASH interventions (including advanced water service provision) for the first year would be US$643 (396–890) million (table 4 and figure 1), of which US$354 (229–478) million would be capital investment and US$289 (166–412) million would be recurrent costs. Rural facilities would compose the majority (64.4%) of total costs, with the greatest national level investments needed for PHCs (52.3%) as opposed to DHs/MCs (27.6%) and CHCs (20.1%). Advanced water service provision was the most costly intervention (US$238 million) followed by interventions on linen reprocessing (US$112 million), sanitation (US$104 million), surface cleaning (US$80 million), medical device reprocessing (US$56 million) and hand hygiene (US$52 million). However, national level costs would also differ widely by facility type (figure 1 and online supplemental table 5-7), with enhanced surface cleaning composing 23.9% of all national level costs for DHs/MCs, but only 6.1% for PHCs.
National costs* in millions of implementing WASH interventions across the Indian public healthcare system
National costs of implementing water, sanitation and hygiene (WASH) interventions across the Indian public healthcare system for 1 year for (A) all healthcare facilities, (B) primary health centers only, (C) community health centers only, and (D) district hospital and medical colleges only. Each bar is the estimated financial capital and recurrent costs of implementing and sustaining interventions in WASH for a period of 1 year. Costs were estimated from ex-post, real-world costs obtained from a survey of 32 Indian heatlthcare facilities, and reported in US dollars (USD) based on 2018 prices.
In sensitivity analysis, we varied the proportion of facilities that would require WASH intervention using the high and low uncertainty ranges. Our results found that the national cost of improving all WASH interventions would be US$958 (592–1324) million assuming upper limit estimates, and US$392 (244–539) million assuming lower limit estimates (online supplemental tables 8 and 9). In both scenarios, the majority of national costs would still be attributed to rural facilities and PHCs; interventions on water would remain the costliest, while interventions on hand hygiene and medical device reprocessing would remain the least costly. In contrast to our original results, sensitivity analysis using lower limit estimates found that the second most costly intervention would be sanitation, followed by surface cleaning and linen reprocessing. No other qualitative differences were found at the national cost level.
Discussion
A 2016 report on the status of WASH in HCFs in India found common gaps in WASH provision across 12 districts including: inadequate access, quality and functionality of WASH infrastructure; shortages of cleaning staff, tools and supplies; poorly equipped handwashing stations; and less provisioning of WASH infrastructure and services in PHCs and CHCs compared with DHs.13 Gaps in WASH provision do not only reflect the need for improvements but also the inequities in healthcare financing.49 50 Adequate WASH infrastructure is required to ensure effective IPC programmes in healthcare settings, which have been demonstrated to reduce HAI rates and hospital costs51 ; however, the cost of building WASH infrastructure and maintaining services nationwide is largely unknown.
We estimated the national financial costs of implementing and maintaining improvements in WASH services for the Indian public healthcare system over 1 year. Although DHs and MCs would require larger cost investments in WASH at the facility level, due to their relative size and complexity of services, the majority of investment at the national level would be needed to improve WASH in PHCs owing to the greater number of facilities lacking adequate services. Larger gaps in WASH provision in PHCs and CHCs would translate to greater investments for rural healthcare.13 Although one-time capital costs would be substantial, particularly for improvements in water and sanitation, recurrent costs would compose roughly 44.9% of overall costs indicating the need for long-term WASH investments to achieve sustainable improvements nationwide.
The costs of upgrading HCFs to basic and advanced water service would be substantial but are necessary for implementing water-requiring IPC interventions, which can help prevent the spread of HAIs and potentially reduce transmission of drug-resistant pathogens. As non-communicable diseases become more common and device use increases, large improvements in IPC are possible through investments in hand hygiene and medical devices cleaning.52–54 Costing studies of these interventions in LMICs, however, are few in number.55 Our study found that increasing access and availability of handwashing stations and sterilisation equipment would be the two least costly interventions to implement (figure 1A). In comparison, improving water service to advanced service levels would be the costliest intervention but a necessary one for implementation of all other studied interventions. Improving access to sanitation facilities would also require large capital investments with high annual maintenance costs but could potentially reduce the burden of diarrhoeal diseases and HAIs,4 56 preserve patient dignity, promote care-seeking behaviour among patients and restore faith in the healthcare system.8 57–60 Overall, these results can be used to improve understanding of the cost-effectiveness of WASH interventions given their differences in implementation costs and their impact on IPC. However, estimates from this study only include the financial cost of improving access and availability to WASH infrastructure. They do not include the cost of increasing adherence to IPC guidelines like hand hygiene compliance, which would require additional costs to promote behaviour change among staff.
Policy implications and strategies for implementation
Findings from our study highlight the urgent need to invest in WASH, particularly at the primary care level, which required the greatest proportion of WASH investment. Substandard WASH has impacts not only in PHCs, but also across the healthcare system as HAI pathogens can rapidly spread as patients move between facilities and communities. Moreover, because of the dichotomy between preventative services (provided by PHCs) and curative services (provided by some CHCs and most DHs), substandard WASH provision in PHCs can harm public perception of the value of preventative healthcare. In India, Panchayat Raj Institutions, a three-tiered system of local, self-governing bodies funded by state grants and local taxes, are responsible for the establishment of PHCs and the provision of essential services (eg, drinking water). To direct more funding towards WASH in PHCs, engaging Panchayat Raj Institutions is critical as they can help generate funds at the village level to support upkeep of WASH facilities in primary healthcare.
Improving budget allocation for WASH in HCFs alone is not enough. Lessons learnt from SBA demonstrate the need for major transformations in social-behavioural norms around cleanliness and hygiene alongside delivery of sanitation services.61 Behavioural challenges such as the custom of open defecation, which has been observed in HCFs across India,13 are especially common in rural areas, where investments in sanitation are most needed. Village Health Sanitation and Nutrition Committees can serve as a key resource in challenging these norms and optimising WASH uptake in HCFs through community action and participation.
The estimated first year cost to implement WASH improvements across the Indian public health sector would be roughly US$354 million and US$289 million in capital and recurrent costs, respectively. These costs are comparable to other national health schemes like Pradhan Mantri Jan Arogya Yojana (PMJAY), which seeks to provide free healthcare coverage for 40% of India’s population. PMJAY was budgeted roughly US$936 million for 2019–2020,62 suggesting that improving WASH in HCFs could be affordable if prioritised by the MoHFW. However, these improvements would need to be a coordinated effort for investments to be sustainable. While the construction of WASH facilities in HCFs is supported by the MoHFW’s National Health Mission and fully funded by the central government, ongoing maintenance of health services (including WASH) is the responsibility of the state government. Thus, long-term political and financial commitment must come from all levels of government. At the facility level too, establishing and maintaining WASH provision require interfacility cooperation and support from top management, especially in large, multidepartment facilities. Despite these challenges to implementation, the consequences of poor WASH provision and compromised IPC on AMR pose a unique opportunity for policymakers to strategically address the need for WASH and IPC investment within the framework of India’s National Action Plan on AMR in an effort to gain greater support from high-level officials. In particular, as LMICs like India scale up their AMR-National Action Plans, AMR sensitive interventions, which indirectly help contain AMR but are primarily for other objectives like improving WASH in HCFs,63 will be critical to addressing the burden of resistance.
Limitations
We estimated financial costs, which unlike economic costs, do not include the opportunity costs of government-subsidised services not captured in this study. We also evaluated costs over 1 year only, which is useful for understanding where the greatest initial investments are needed, but is not realistic for actual financial planning or comparing life cycle costs of assets with different useful lives. Additionally, we included the cost of capital and recurrent inputs, but did not include the costs of management time to deliver capital infrastructure.
There were also limitations related to study design and challenges to data acquisition including the small sample size of surveyed facilities, which limited the generalisability of our data and led, in part, to wide CIs for each calculated service unit cost. We also used proxy measures to extrapolate the cost of interventions for specific facility levels where data were unreliable or unobtainable. Data were also scattered across HCFs in different departments and were not readily available in some HCFs like small private hospitals. Public sector engagement was also more difficult to obtain as HCF participation was voluntary, resulting in the use of both private and public sector data. This may have led to increased variability in the cost data as we expected more public facilities to have greater access to government-subsidised utilities, wholesale supply sources and purchasing cooperatives. For instance, the average cost per unit for toilets and sinks was lower for public than for private facilities, and only public tertiary hospitals reported free sewage disposal services. Furthermore, cost data reported by HCFs for surface cleaning and medical device reprocessing combined capital or aggregated monthly costs, limiting more granular cost analysis.
There were also a number of challenges in calculating national costs. First, the number of HCFs present in urban and rural settings was obtained from 2016 urban and 2017 rural health statistics and may be underestimated. Second, there were limited data on the proportion of HCFs requiring WASH interventions in existing literature, although our sensitivity analysis found that despite varying these proportions, the greatest national costs were still attributed to PHCs and rural HCFs. However, qualitative differences in the percentage of national costs attributed to sanitation, surface cleaning and linen reprocessing were noted, suggesting that more research on the current status of WASH service levels in HCFs could improve national cost estimates for policy planning. Finally, we assumed that prices were rigid throughout our 1-year cost evaluation; and due to limitations in data collection, we were unable to apply 2018 market costs to capital expenditures, resulting in an underestimation of these costs.
Conclusion
This study is the first that we are aware of to estimate the national costs of implementing WASH interventions in HCFs across the Indian public health sector. Understanding the cost of interventions in relation to other competing needs is a necessary step in determining the cost-effectiveness of WASH interventions to reduce transmission of HAIs. These data can serve as grounds for policymakers to support IPC-related AMR National Action Plan activities through investments in WASH. By mapping interventions to the JMP service ladder for WASH in HCFs where possible, health policy planners and programme managers can use hospital cost information from this study to understand the efficiency of different WASH services across various settings in India, inform the allocation of resources for future financing of WASH programmes in HCFs and guide health interventions on a national level towards the targets set by the SDGs.
Acknowledgments
We thank our colleagues from the Centers for Disease Control and Prevention, who provided insight and expertise that greatly assisted the research. We would also like to show our gratitude to the individuals and institutions who generously shared their time, experience and materials for the purpose of this study, which would not have been possible without their support and participation.
References
Supplementary materials
Supplementary Data
This web only file has been produced by the BMJ Publishing Group from an electronic file supplied by the author(s) and has not been edited for content.
Footnotes
Handling editor Seye Abimbola
Twitter @katiektseng
Contributors KKT and EK—conceptualisation. JJ and SS – investigation. KKT and EK—methodology. KKT and SS—validation. KKT—formal analysis. KKT, EK, JJ and SS—writing, review and editing.
Funding This work was supported by the Centers for Disease Control and Prevention (Contract No: 200-2016-91774).
Competing interests None declared.
Patient consent for publication Not required.
Provenance and peer review Not commissioned; externally peer reviewed.
Data availability statement Data are available upon request.
Supplemental material This content has been supplied by the author(s). It has not been vetted by BMJ Publishing Group Limited (BMJ) and may not have been peer-reviewed. Any opinions or recommendations discussed are solely those of the author(s) and are not endorsed by BMJ. BMJ disclaims all liability and responsibility arising from any reliance placed on the content. Where the content includes any translated material, BMJ does not warrant the accuracy and reliability of the translations (including but not limited to local regulations, clinical guidelines, terminology, drug names and drug dosages), and is not responsible for any error and/or omissions arising from translation and adaptation or otherwise.